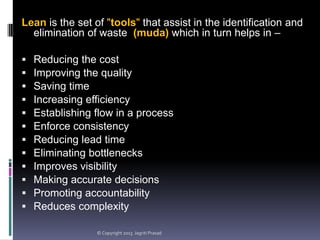
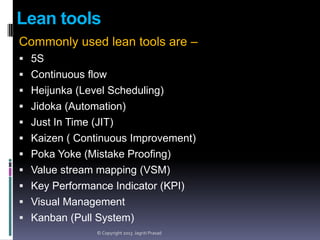
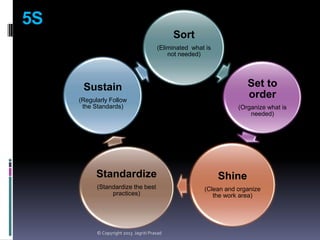
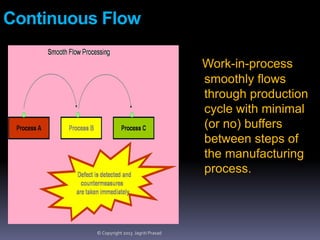
LEAN TOOLS

© Copyright 2013 Jagriti Prasad
HOW DOES THE TOOLS HELP ?

© Copyright 2013 Jagriti Prasad
Lean is the set of "tools" that assist in the identification and
elimination of waste (muda) which in turn helps in –













Reducing the cost
Improving the quality
Saving time
Increasing efficiency
Establishing flow in a process
Enforce consistency
Reducing lead time
Eliminating bottlenecks
Improves visibility
Making accurate decisions
Promoting accountability
Reduces complexity
© Copyright 2013 Jagriti Prasad
Lean tools
Commonly used lean tools are –
 5S
 Continuous flow
 Heijunka (Level Scheduling)
 Jidoka (Automation)
 Just In Time (JIT)

 Kaizen ( Continuous Improvement)
 Poka Yoke (Mistake Proofing)
 Value stream mapping (VSM)
 Key Performance Indicator (KPI)
 Visual Management
 Kanban (Pull System)
© Copyright 2013 Jagriti Prasad
5S
Sort
(Eliminated what is
not needed)

Set to
order

Sustain
(Regularly Follow
the Standards)

(Organize what is
needed)

Standardize

Shine

(Standardize the best
practices)

(Clean and organize
the work area)

© Copyright 2013 Jagriti Prasad
How does 5S help ?
Helps in saving time
 Saves time in looking for the items/tools.

Improves workplace condition
 Clean, spacious work centers helps in increasing safety.

Helps in increasing productivity
 Unnecessary items and dirt get in the way of employees and

negatively impact productivity.

Helps in eliminating other waste
 Waste of motion
 Waste or transport
 Waste of waiting
© Copyright 2013 Jagriti Prasad
Continuous Flow
Work-in-process
smoothly flows
through production
cycle with minimal
(or no) buffers
between steps of
the manufacturing
process.

© Copyright 2013 Jagriti Prasad
How does Continuous flow help ?
Helps in establishing the flow
 Reduces batching, establishes process flow, minimising

waiting between steps, improves quality and reduces lead
time.

Helps in eliminating
 Waste of inventory
 Waste of waiting
 Waste of transportation

Helps in increasing the profit
 Continuous flow in production cycle helps in increasing the

production with minimal waste which in turn increases the
profit.
© Copyright 2013 Jagriti Prasad
Heijunka (Level Scheduling)
Heijunka means sequencing, or smoothing of
production.
By multiplying the tasks, and distributing them better, and by
standardising them by carefully-studied smoothing, better
use can be made of the working time available for creating
value.
Work is appropriately distributed and no individual has too
much or too little work.

© Copyright 2013 Jagriti Prasad
How does Heijunka help?
Helps in monitoring and load balancing
 Provides a performance dashboard to help monitor the

work at all levels in real time.

Helps in better utilization of resources
 The use of resources (factories, shop floor, machinery)

has to be maximised by improving their use so that
more is produced with existing resources.

Helps in standerdising the work
 As it help in eliminating different types of wastes, It

helps in standardising the work.
© Copyright 2013 Jagriti Prasad
Jidoka (Autonomation)
Built in quality at the source
 It is a tool that provides

machine and operators the
ability to automatically stop
the work if any abnormality
occurs.

Jidoka is based on
 Don’t accept defects
 Don’t make defects
 Don’t pass defects on
© Copyright 2013 Jagriti Prasad
How does Jidoka help?
Eliminates waste of defect
 It prevents defective products from passing to the next

process. Helps in saving time and waste of raw material.

Ensures client/customer satisfaction
 Helps in maintaining the quality of the product.

Reduces labor cost
 Workers can frequently monitor multiple work stations at a

time.

Reduces lead time/ Turn around time
© Copyright 2013 Jagriti Prasad
Just In Time (JIT)
Production as per the
customers demand
 The production is done as

per the customer demand
and not as per the projected
demand.
 Relies on many lean tools,

such as Continuous Flow,
Heijunka, Kanban,
Standardized Work.

© Copyright 2013 Jagriti Prasad
How does Just In Time Help?
Effective in reducing the Inventory level
 As the production is done after receiving the customer

order, inventory storage is not required. Hence, reduces
the storage space.

Helps is Improving the cash flow
 As less cash is invested in inventory more of liquid cash is

available.

Helps in eliminating
 Waste of overproduction
 Waste of Idle time
 Waste of Inventory
© Copyright 2013 Jagriti Prasad
Kaizen(Continuous Improvement)

© Copyright 2013 Jagriti Prasad
How does Kaizen Help?
Helps in making assigning responsibility/ segregation
of duties
 Helps in providing strategy where employees work together

proactively to achieve regular, incremental improvements in
the manufacturing process.

Helps in eliminating wastes
 Combines the collective effort of the employees of a

company to create an continues process of eliminating
waste.

© Copyright 2013 Jagriti Prasad
Poka Yoke (Mistake Proofing)
Ensure that the process
is error free and stays
that way.
 Make the process in such

a way that it is impossible
to make errors.
 Use low cost ways,

reliable devices or
innovation for preventing
or detecting errors by
people or system in a
process.
© Copyright 2013 Jagriti Prasad
How does Poka Yoke help?
Helps in eliminates waste of defect
 Helps in detecting and preventing the occurrence of

defects in a process.

Helps in manufacturing process
 It helps in detecting defects in products and prevents

their further processing.

© Copyright 2013 Jagriti Prasad
Value Stream Mapping (VSM)
Material and information
flow mapping
 Commonly used in

manufacturing, healthcare,
software & product
development, logistics,
supply chain, and service
industries.

© Copyright 2013 Jagriti Prasad
A very simple VSM for Accounts Payable
process

© Copyright 2013 Jagriti Prasad
How does VSM help?
Helps in mapping the flow of the process
 Helps in mapping the current and future state of value

stream.

Helps in streamlining the process
 Helps you quickly visualize your entire process, identifying

bottlenecks where the processes can be streamlined or
improved.

Helps in eliminating the wastes
 Provides a read map to find the non value added activities

or wastes which can be eliminated from the process.
© Copyright 2013 Jagriti Prasad
Key Performance Indicators (KPI’s)
Metrics designed to
track the progress
towards the goals of
the organization by
assessing,
analyzing and
tracking processes.

© Copyright 2013 Jagriti Prasad
Points to be kept in mind while selecting the KPI’s
Focus on the critical few - measure the critical once, too
many KPI’s will lead to confusion.

Selected KPI’s should drive toward your strategic
intent - as KPI’s are the part of the operations strategic
plan.

KPI’s are relatable on all levels of the organization such as production of units per hour or invoices processed
per hour.

Data for KPIs are valid - data should be meaningful,
timely and reliable for sound management decision-making.

Ensure controllable KPI’s are selected - what you

measure must be controllable in order to obtain the strategic
objectives you desire.
© Copyright 2013 Jagriti Prasad
The best manufacturing KPI’s can be –
 Production per hour/per batch
 Waste of raw material per hour/ per batch

 Rate of production ( slow rate will reduce the output,





increased rate may lead to quality defects)
Performance targets (based on production, rate and
quality)
Takt time (cycle time of specific operations)
Overall equipment effectiveness (OEE)
Down time/ changeover time

© Copyright 2013 Jagriti Prasad
KPI’s in Accounts Payable process can be  Unmatched trade GRN ( open GRN)
 Open debits on vendor account
 Unmatched Direct debits
 E mail response time / query resolution time
 Vendor master creation and modification time
 Payment reminders received

 Expense/T&E processing time

A KPI is always a metric, but a metric may not be a KPI. KPI
must be a metric that will drive strategic competitive
advantage for the organization.

© Copyright 2013 Jagriti Prasad
How does KPI’s help?
Helps in achieving the organization goal
 Organisations use KPI’s to assess, analyze and track the

performance of the process.

Helps in driving the desired behavior
 Train your employees to work in a KPI-driven environment

to achieve the strategic objectives.

Helps in exposing and eliminating the wastes
 KPI’s helps in keeping a close eye on the production cycle,

quality, wastes and downtime.

© Copyright 2013 Jagriti Prasad
Visual Management

Process of displaying
critical information such
as KPI’s relating to
production output,
efficiency, quality and
downtime on the
production floor.

© Copyright 2013 Jagriti Prasad
How does Visual Management help?
Helps in driving the KPI’s
 It drives productivity throughout the organization by

increasing efficiency, quality and uptime.

Helps in increasing the performance/productivity
 It provides information to the supervisors in real time to

better monitor the performance and the area of
improvements.

Helps in increasing the production and profit
 Production is increased by tracking the productivity, wastes

and down time, which in turn helps in controlling the
operation cost, labour cost, inventory cost and increasing
the overall profit.
© Copyright 2013 Jagriti Prasad
Metric which can be displayed for AP
 Number of invoices received
 Target assigned

 Target achieved on hourly basis
 Number of quality check done with the number of
defects found

 Number of payments done with number of errors
 Number of vendor set up received and completed
 Number of queries received and responded

© Copyright 2013 Jagriti Prasad
Kanban (Pull System)
Replacing only what
has been consumed
and only what is
immediately
deliverable.
 It is to have a measured

queue of materials (raw
materials, work-inprocess, components,
whatever) ready to be
“pulled” by the next
process step. After the
materials are “pulled” a
signal is sent to the
preceding process step to
replace what was taken.
© Copyright 2013 Jagriti Prasad
How does Pull System help?
Helps in controlling flow of cash
 Less cash is required as the inventory is not stored in bulk.

Helps in preventing overproduction and over-ordering
 Replenish only what has been used, and reorder based on

rate of consumption, delivery frequency, and minimum order
quantity.

Helps in reducing
 overall inventory
 work in process (WIP)
 order turnaround time/lead time

Increase customer satisfaction
 High quality of goods is achieved as the goods are

produced as per the customer order.
© Copyright 2013 Jagriti Prasad
Summary
 Any waste which can be recorded/measured, can be

reduced/controlled.
 Clean, spacious work centers helps in increasing safety,

save time, increase productivity and motivates employees.
 Automation and continuous flow in a process helps in

reducing waste of time, Inventory, waiting and helps in
increasing the profit and maintaining the quality of the
product.
 Goals of the organization can be achieved by assessing,

analyzing and tracking the progress of the processes at all
levels.
© Copyright 2013 Jagriti Prasad
Thanks!
Jagriti Prasad
E mail – jagriti_knp@yahoo.com

© Copyright 2013 Jagriti Prasad

Lean Manufacturing Tools

  • 1.
    LEAN TOOLS © Copyright2013 Jagriti Prasad
  • 2.
    HOW DOES THETOOLS HELP ? © Copyright 2013 Jagriti Prasad
  • 3.
    Lean is theset of "tools" that assist in the identification and elimination of waste (muda) which in turn helps in –             Reducing the cost Improving the quality Saving time Increasing efficiency Establishing flow in a process Enforce consistency Reducing lead time Eliminating bottlenecks Improves visibility Making accurate decisions Promoting accountability Reduces complexity © Copyright 2013 Jagriti Prasad
  • 4.
    Lean tools Commonly usedlean tools are –  5S  Continuous flow  Heijunka (Level Scheduling)  Jidoka (Automation)  Just In Time (JIT)  Kaizen ( Continuous Improvement)  Poka Yoke (Mistake Proofing)  Value stream mapping (VSM)  Key Performance Indicator (KPI)  Visual Management  Kanban (Pull System) © Copyright 2013 Jagriti Prasad
  • 5.
    5S Sort (Eliminated what is notneeded) Set to order Sustain (Regularly Follow the Standards) (Organize what is needed) Standardize Shine (Standardize the best practices) (Clean and organize the work area) © Copyright 2013 Jagriti Prasad
  • 6.
    How does 5Shelp ? Helps in saving time  Saves time in looking for the items/tools. Improves workplace condition  Clean, spacious work centers helps in increasing safety. Helps in increasing productivity  Unnecessary items and dirt get in the way of employees and negatively impact productivity. Helps in eliminating other waste  Waste of motion  Waste or transport  Waste of waiting © Copyright 2013 Jagriti Prasad
  • 7.
    Continuous Flow Work-in-process smoothly flows throughproduction cycle with minimal (or no) buffers between steps of the manufacturing process. © Copyright 2013 Jagriti Prasad
  • 8.
    How does Continuousflow help ? Helps in establishing the flow  Reduces batching, establishes process flow, minimising waiting between steps, improves quality and reduces lead time. Helps in eliminating  Waste of inventory  Waste of waiting  Waste of transportation Helps in increasing the profit  Continuous flow in production cycle helps in increasing the production with minimal waste which in turn increases the profit. © Copyright 2013 Jagriti Prasad
  • 9.
    Heijunka (Level Scheduling) Heijunkameans sequencing, or smoothing of production. By multiplying the tasks, and distributing them better, and by standardising them by carefully-studied smoothing, better use can be made of the working time available for creating value. Work is appropriately distributed and no individual has too much or too little work. © Copyright 2013 Jagriti Prasad
  • 10.
    © Copyright 2013Jagriti Prasad
  • 11.
    How does Heijunkahelp? Helps in monitoring and load balancing  Provides a performance dashboard to help monitor the work at all levels in real time. Helps in better utilization of resources  The use of resources (factories, shop floor, machinery) has to be maximised by improving their use so that more is produced with existing resources. Helps in standerdising the work  As it help in eliminating different types of wastes, It helps in standardising the work. © Copyright 2013 Jagriti Prasad
  • 12.
    Jidoka (Autonomation) Built inquality at the source  It is a tool that provides machine and operators the ability to automatically stop the work if any abnormality occurs. Jidoka is based on  Don’t accept defects  Don’t make defects  Don’t pass defects on © Copyright 2013 Jagriti Prasad
  • 13.
    How does Jidokahelp? Eliminates waste of defect  It prevents defective products from passing to the next process. Helps in saving time and waste of raw material. Ensures client/customer satisfaction  Helps in maintaining the quality of the product. Reduces labor cost  Workers can frequently monitor multiple work stations at a time. Reduces lead time/ Turn around time © Copyright 2013 Jagriti Prasad
  • 14.
    Just In Time(JIT) Production as per the customers demand  The production is done as per the customer demand and not as per the projected demand.  Relies on many lean tools, such as Continuous Flow, Heijunka, Kanban, Standardized Work. © Copyright 2013 Jagriti Prasad
  • 15.
    How does JustIn Time Help? Effective in reducing the Inventory level  As the production is done after receiving the customer order, inventory storage is not required. Hence, reduces the storage space. Helps is Improving the cash flow  As less cash is invested in inventory more of liquid cash is available. Helps in eliminating  Waste of overproduction  Waste of Idle time  Waste of Inventory © Copyright 2013 Jagriti Prasad
  • 16.
  • 17.
    How does KaizenHelp? Helps in making assigning responsibility/ segregation of duties  Helps in providing strategy where employees work together proactively to achieve regular, incremental improvements in the manufacturing process. Helps in eliminating wastes  Combines the collective effort of the employees of a company to create an continues process of eliminating waste. © Copyright 2013 Jagriti Prasad
  • 18.
    Poka Yoke (MistakeProofing) Ensure that the process is error free and stays that way.  Make the process in such a way that it is impossible to make errors.  Use low cost ways, reliable devices or innovation for preventing or detecting errors by people or system in a process. © Copyright 2013 Jagriti Prasad
  • 19.
    How does PokaYoke help? Helps in eliminates waste of defect  Helps in detecting and preventing the occurrence of defects in a process. Helps in manufacturing process  It helps in detecting defects in products and prevents their further processing. © Copyright 2013 Jagriti Prasad
  • 20.
    Value Stream Mapping(VSM) Material and information flow mapping  Commonly used in manufacturing, healthcare, software & product development, logistics, supply chain, and service industries. © Copyright 2013 Jagriti Prasad
  • 21.
    A very simpleVSM for Accounts Payable process © Copyright 2013 Jagriti Prasad
  • 22.
    © Copyright 2013Jagriti Prasad
  • 23.
    How does VSMhelp? Helps in mapping the flow of the process  Helps in mapping the current and future state of value stream. Helps in streamlining the process  Helps you quickly visualize your entire process, identifying bottlenecks where the processes can be streamlined or improved. Helps in eliminating the wastes  Provides a read map to find the non value added activities or wastes which can be eliminated from the process. © Copyright 2013 Jagriti Prasad
  • 24.
    Key Performance Indicators(KPI’s) Metrics designed to track the progress towards the goals of the organization by assessing, analyzing and tracking processes. © Copyright 2013 Jagriti Prasad
  • 25.
    Points to bekept in mind while selecting the KPI’s Focus on the critical few - measure the critical once, too many KPI’s will lead to confusion. Selected KPI’s should drive toward your strategic intent - as KPI’s are the part of the operations strategic plan. KPI’s are relatable on all levels of the organization such as production of units per hour or invoices processed per hour. Data for KPIs are valid - data should be meaningful, timely and reliable for sound management decision-making. Ensure controllable KPI’s are selected - what you measure must be controllable in order to obtain the strategic objectives you desire. © Copyright 2013 Jagriti Prasad
  • 26.
    The best manufacturingKPI’s can be –  Production per hour/per batch  Waste of raw material per hour/ per batch  Rate of production ( slow rate will reduce the output,     increased rate may lead to quality defects) Performance targets (based on production, rate and quality) Takt time (cycle time of specific operations) Overall equipment effectiveness (OEE) Down time/ changeover time © Copyright 2013 Jagriti Prasad
  • 27.
    KPI’s in AccountsPayable process can be  Unmatched trade GRN ( open GRN)  Open debits on vendor account  Unmatched Direct debits  E mail response time / query resolution time  Vendor master creation and modification time  Payment reminders received  Expense/T&E processing time A KPI is always a metric, but a metric may not be a KPI. KPI must be a metric that will drive strategic competitive advantage for the organization. © Copyright 2013 Jagriti Prasad
  • 28.
    How does KPI’shelp? Helps in achieving the organization goal  Organisations use KPI’s to assess, analyze and track the performance of the process. Helps in driving the desired behavior  Train your employees to work in a KPI-driven environment to achieve the strategic objectives. Helps in exposing and eliminating the wastes  KPI’s helps in keeping a close eye on the production cycle, quality, wastes and downtime. © Copyright 2013 Jagriti Prasad
  • 29.
    Visual Management Process ofdisplaying critical information such as KPI’s relating to production output, efficiency, quality and downtime on the production floor. © Copyright 2013 Jagriti Prasad
  • 30.
    How does VisualManagement help? Helps in driving the KPI’s  It drives productivity throughout the organization by increasing efficiency, quality and uptime. Helps in increasing the performance/productivity  It provides information to the supervisors in real time to better monitor the performance and the area of improvements. Helps in increasing the production and profit  Production is increased by tracking the productivity, wastes and down time, which in turn helps in controlling the operation cost, labour cost, inventory cost and increasing the overall profit. © Copyright 2013 Jagriti Prasad
  • 31.
    Metric which canbe displayed for AP  Number of invoices received  Target assigned  Target achieved on hourly basis  Number of quality check done with the number of defects found  Number of payments done with number of errors  Number of vendor set up received and completed  Number of queries received and responded © Copyright 2013 Jagriti Prasad
  • 32.
    Kanban (Pull System) Replacingonly what has been consumed and only what is immediately deliverable.  It is to have a measured queue of materials (raw materials, work-inprocess, components, whatever) ready to be “pulled” by the next process step. After the materials are “pulled” a signal is sent to the preceding process step to replace what was taken. © Copyright 2013 Jagriti Prasad
  • 33.
    How does PullSystem help? Helps in controlling flow of cash  Less cash is required as the inventory is not stored in bulk. Helps in preventing overproduction and over-ordering  Replenish only what has been used, and reorder based on rate of consumption, delivery frequency, and minimum order quantity. Helps in reducing  overall inventory  work in process (WIP)  order turnaround time/lead time Increase customer satisfaction  High quality of goods is achieved as the goods are produced as per the customer order. © Copyright 2013 Jagriti Prasad
  • 34.
    Summary  Any wastewhich can be recorded/measured, can be reduced/controlled.  Clean, spacious work centers helps in increasing safety, save time, increase productivity and motivates employees.  Automation and continuous flow in a process helps in reducing waste of time, Inventory, waiting and helps in increasing the profit and maintaining the quality of the product.  Goals of the organization can be achieved by assessing, analyzing and tracking the progress of the processes at all levels. © Copyright 2013 Jagriti Prasad
  • 35.
    Thanks! Jagriti Prasad E mail– jagriti_knp@yahoo.com © Copyright 2013 Jagriti Prasad