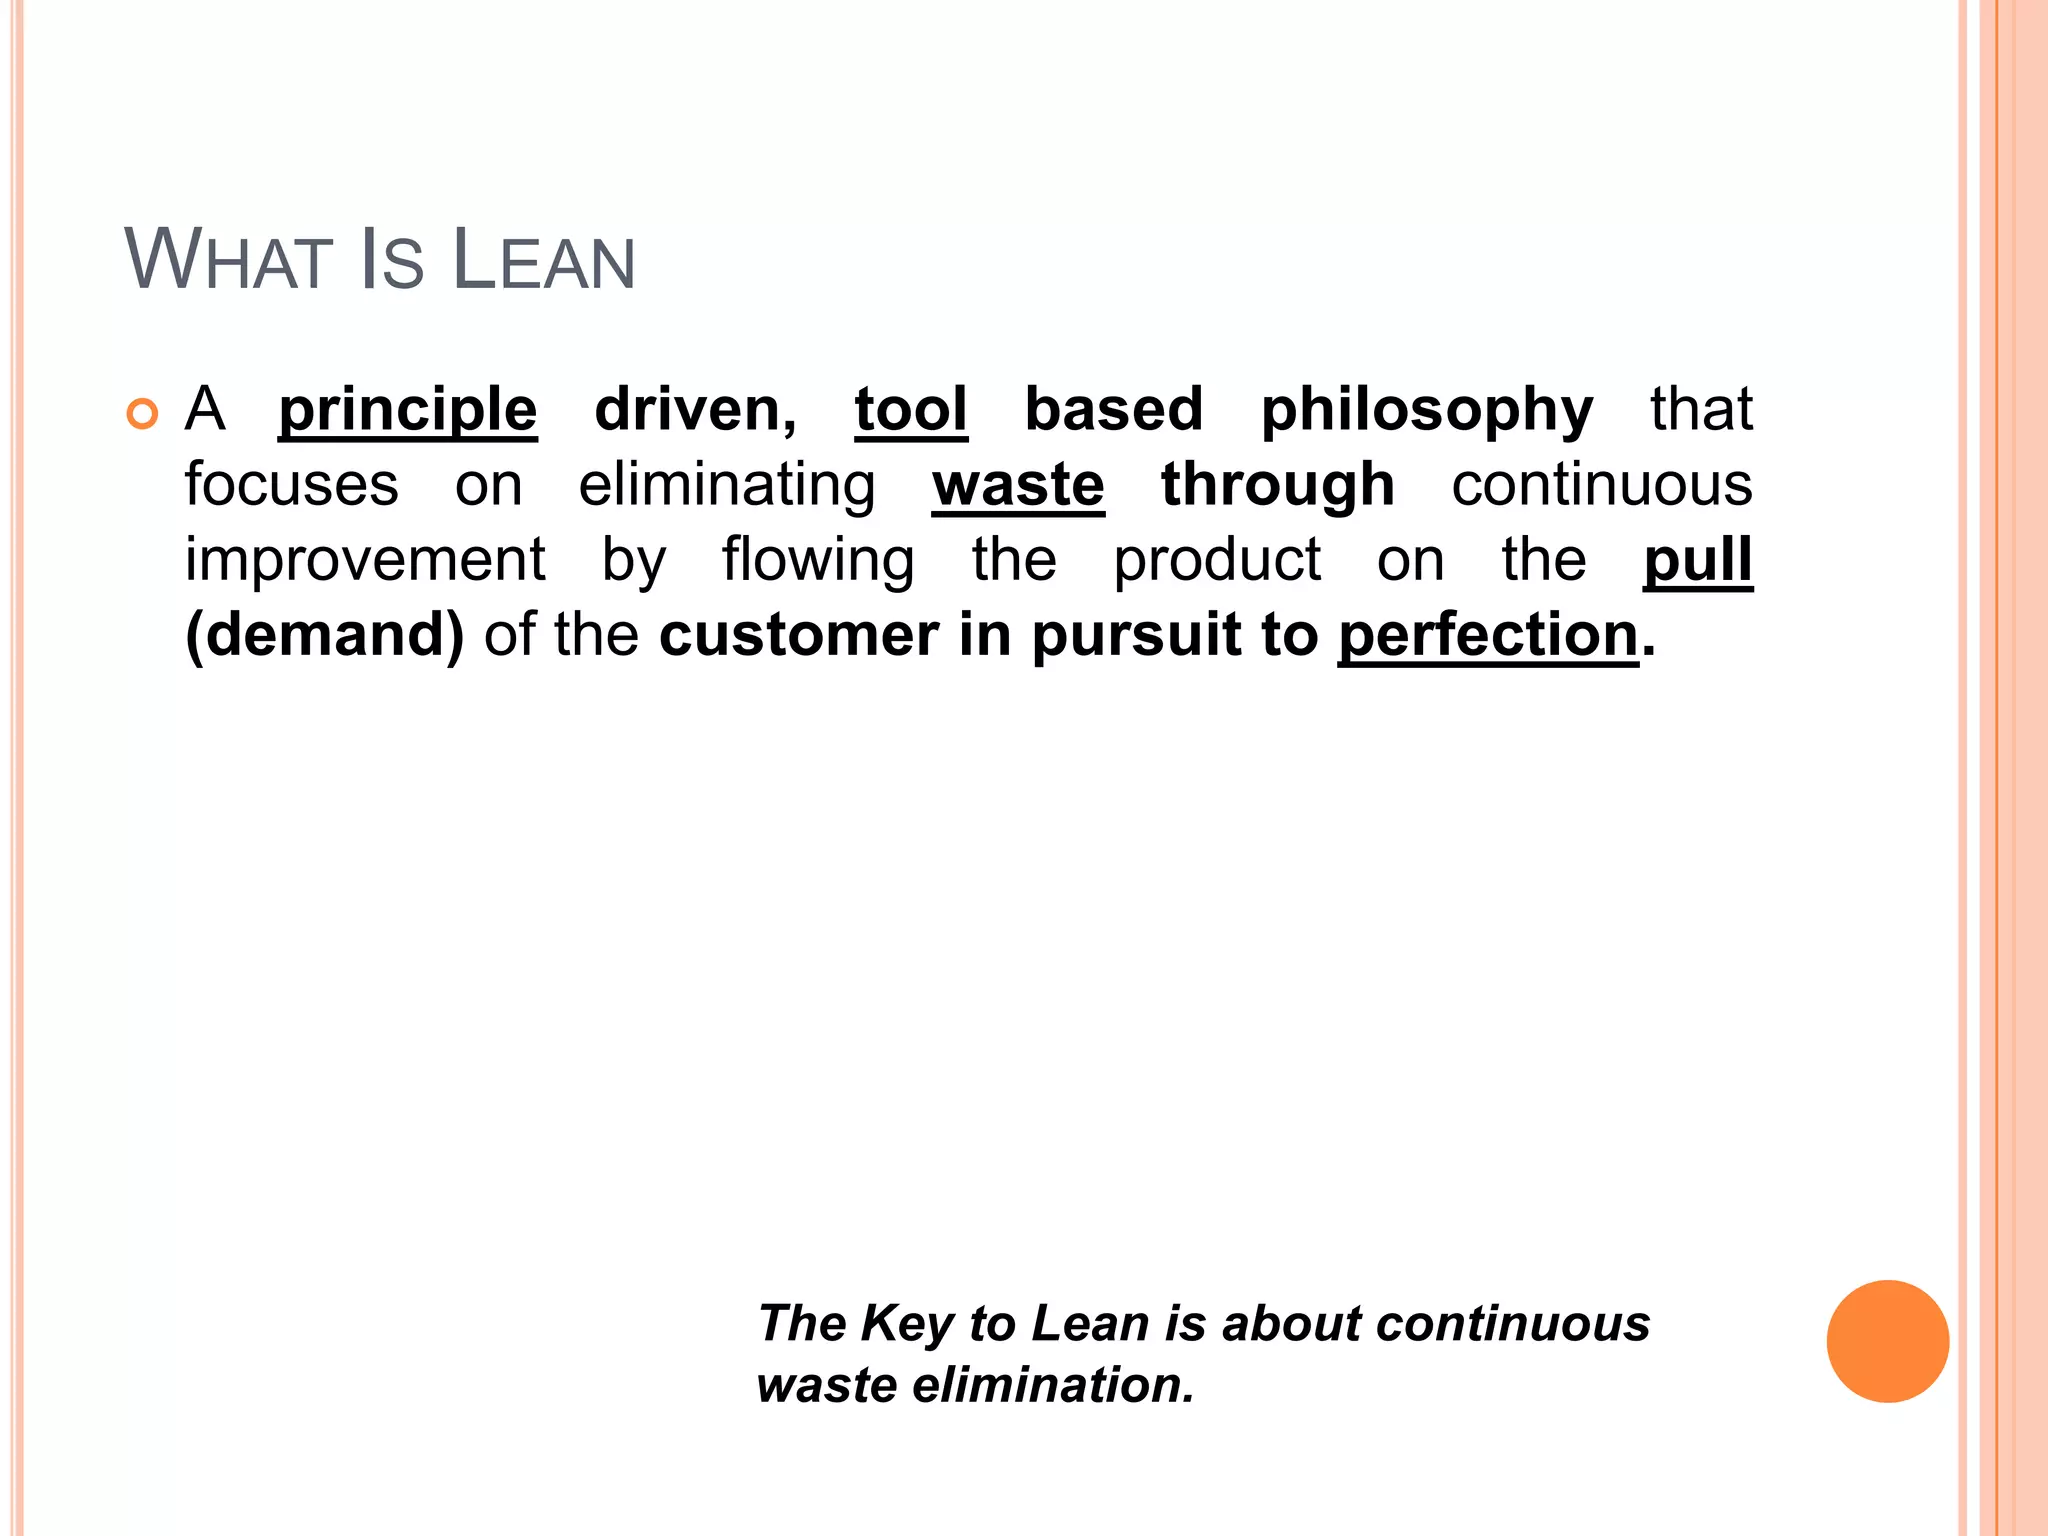
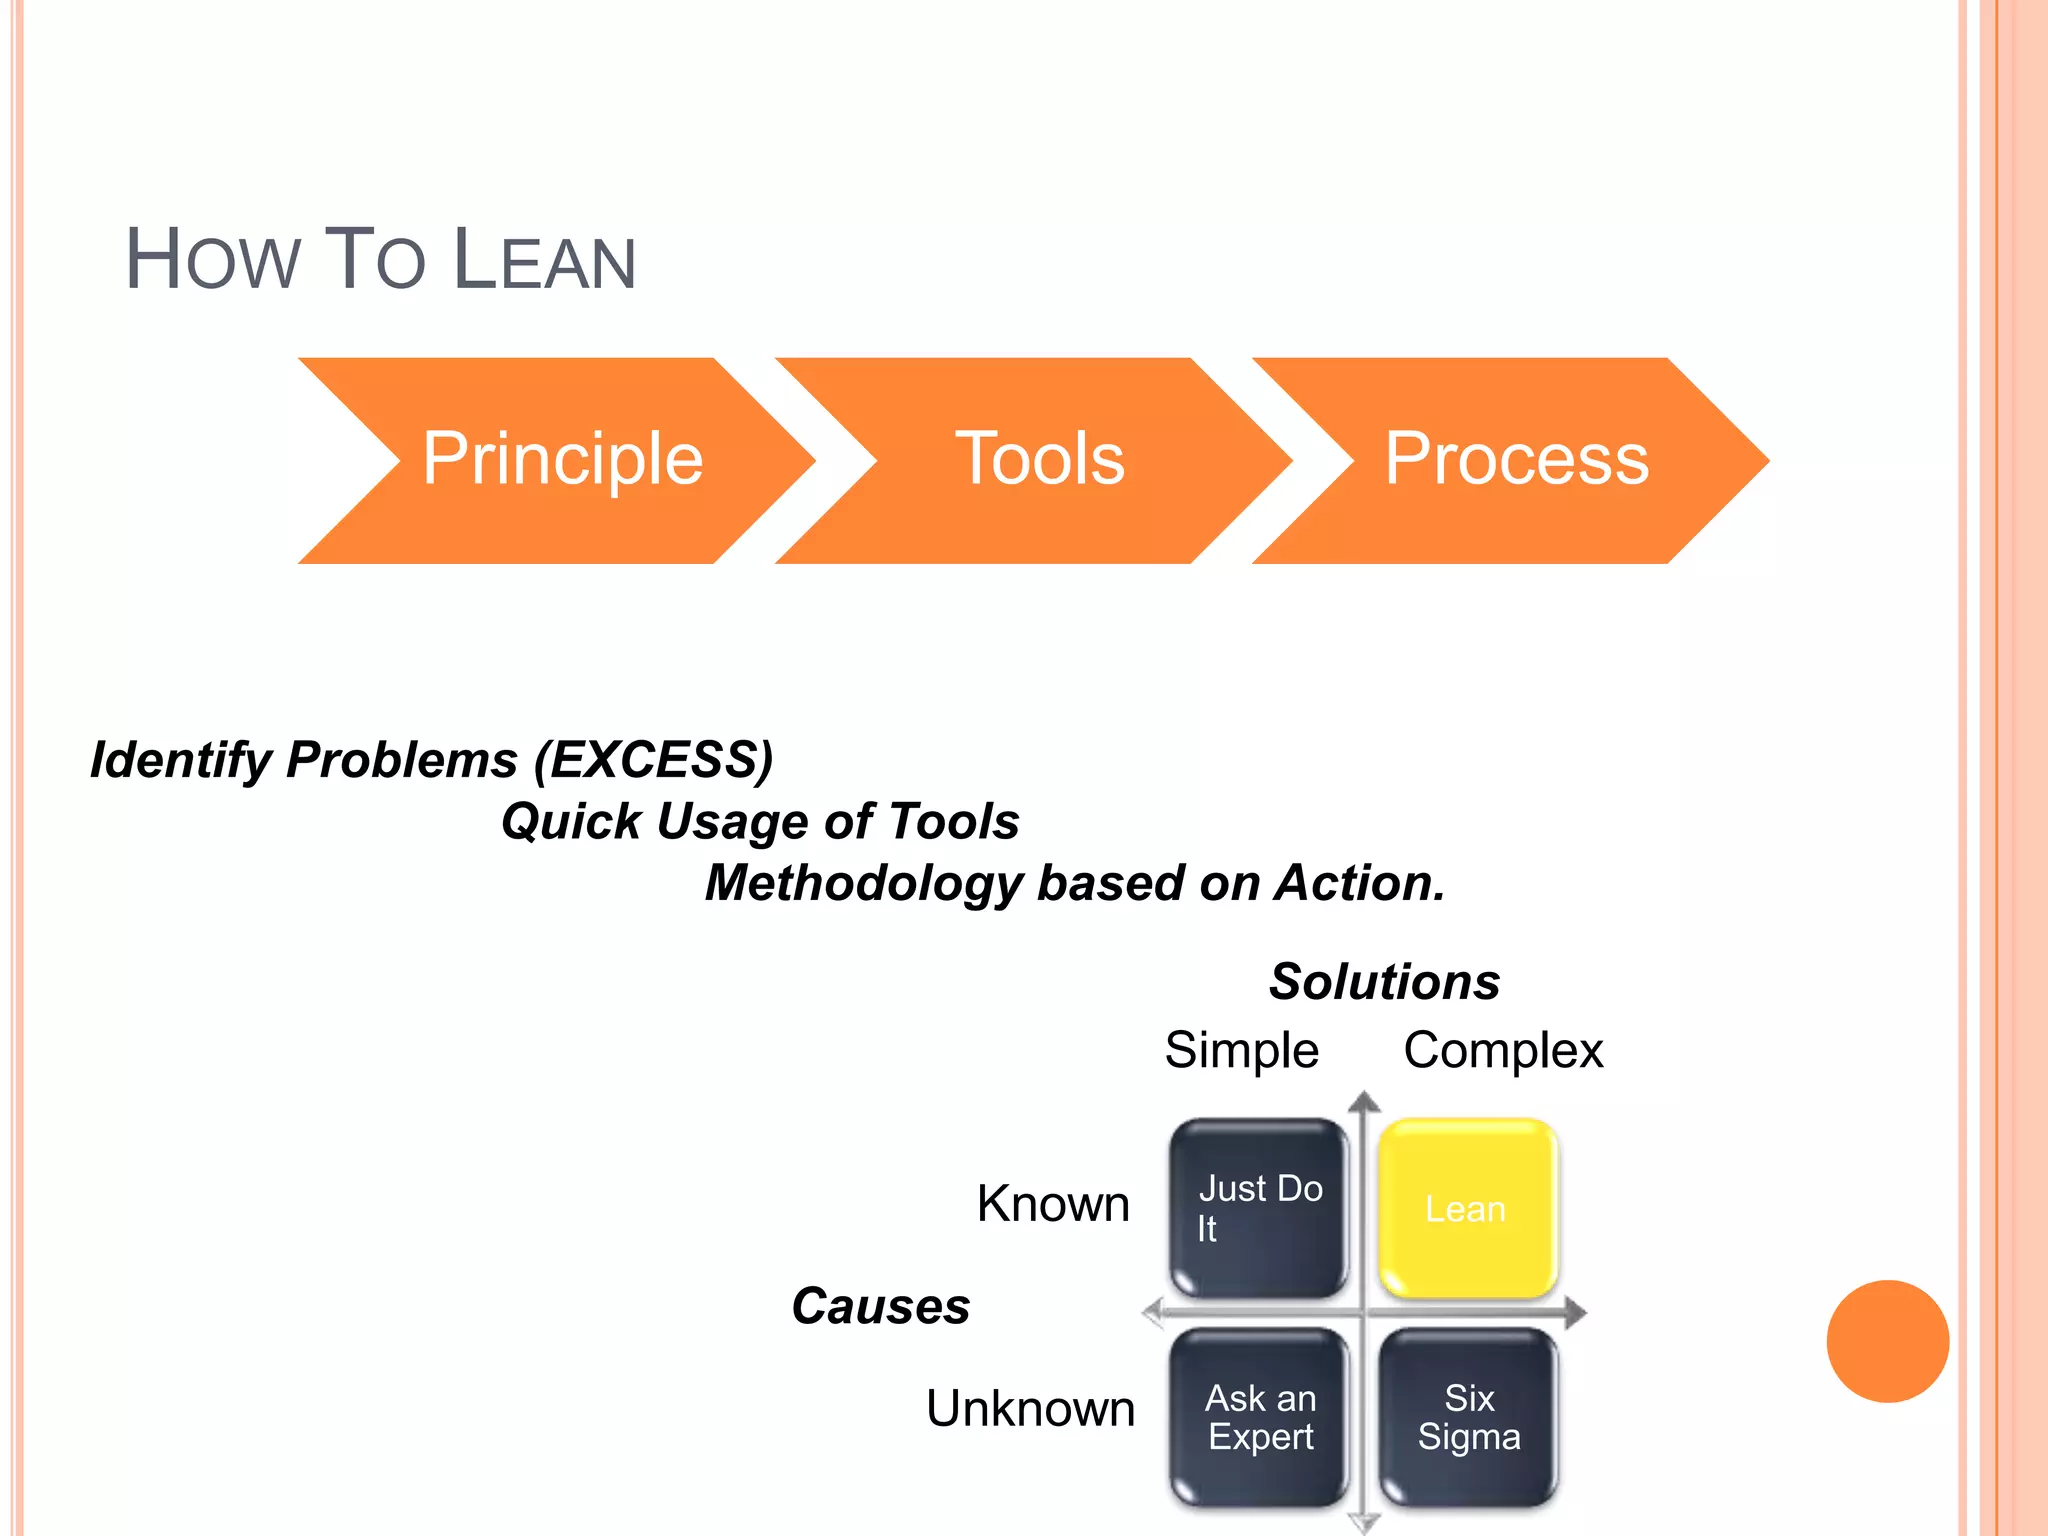
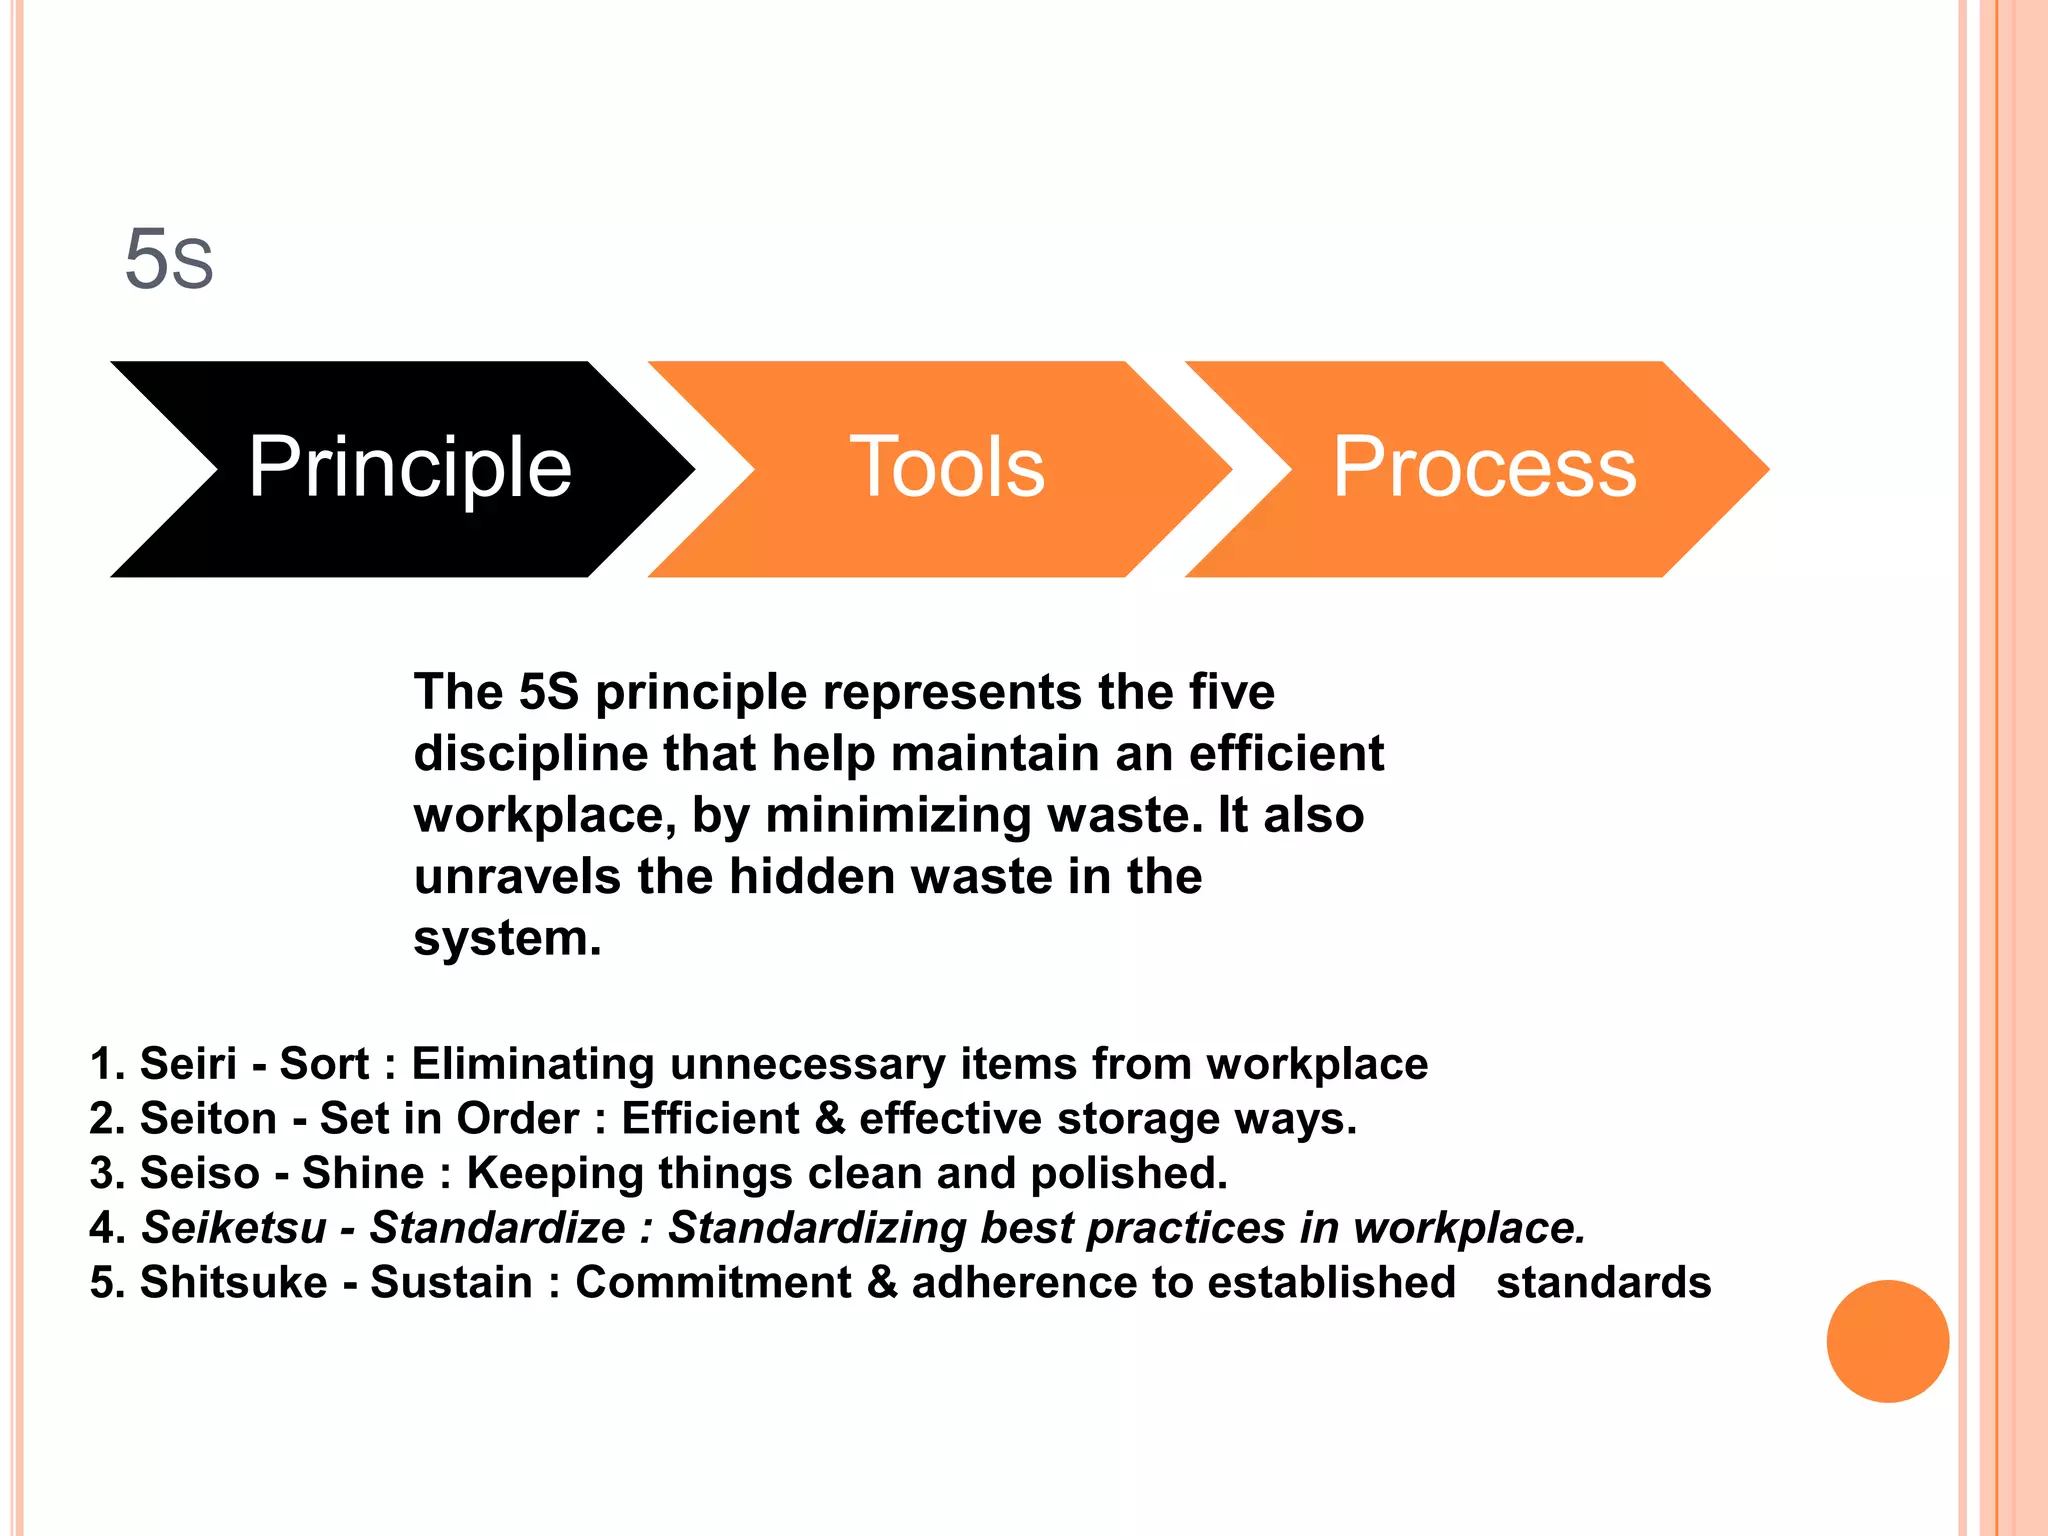
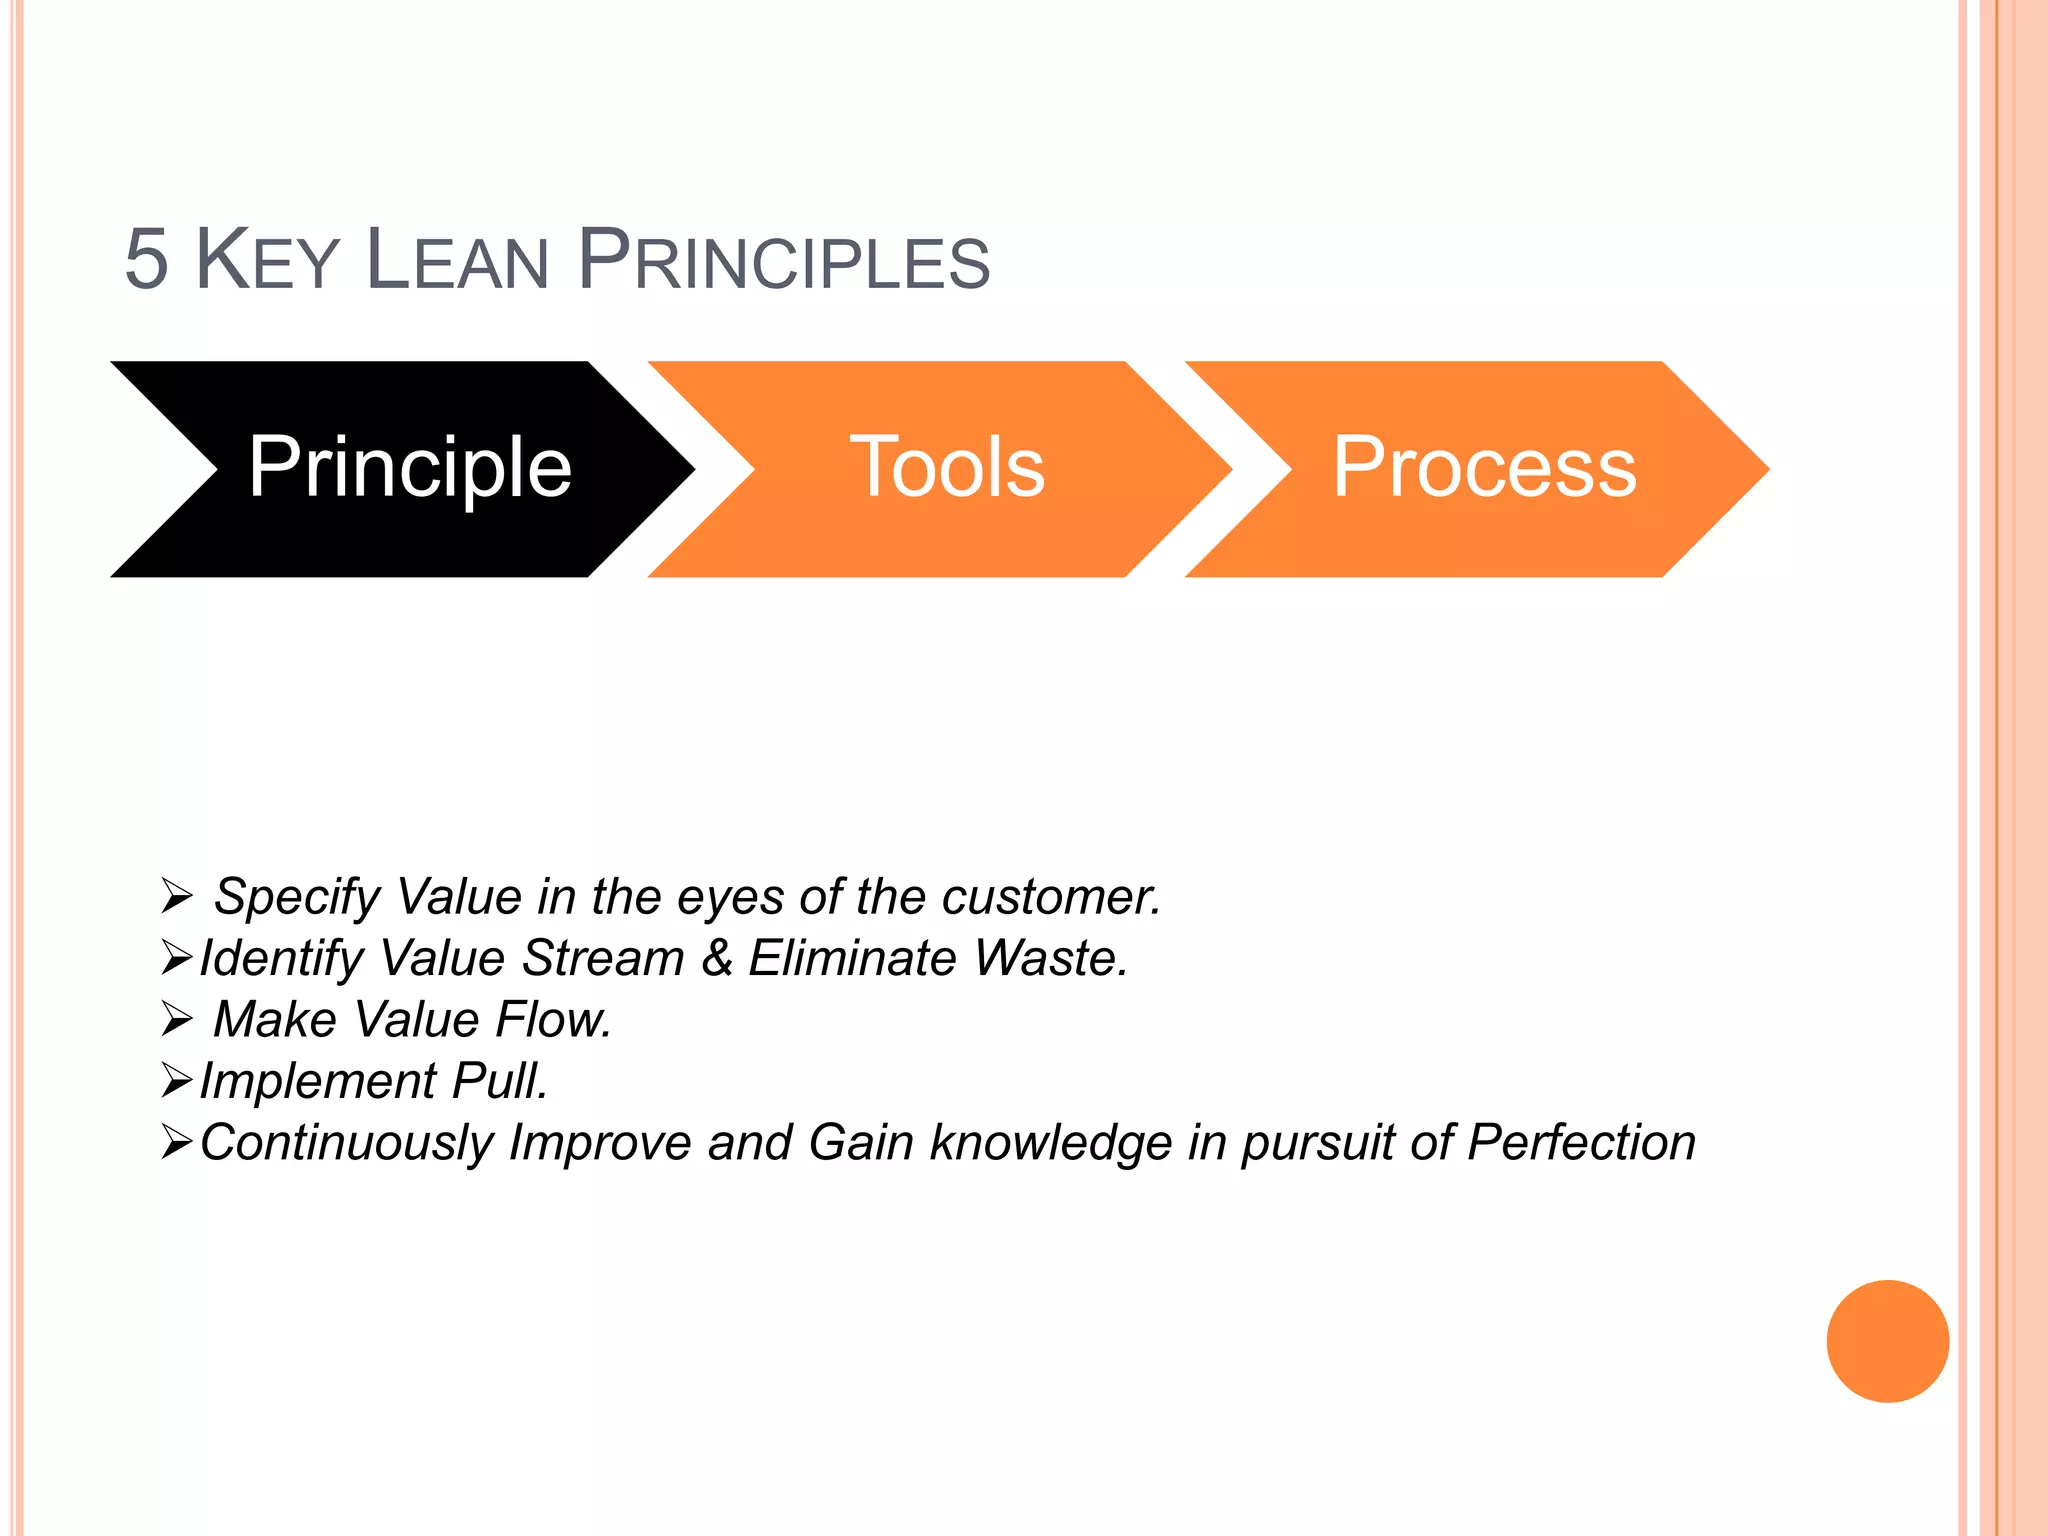
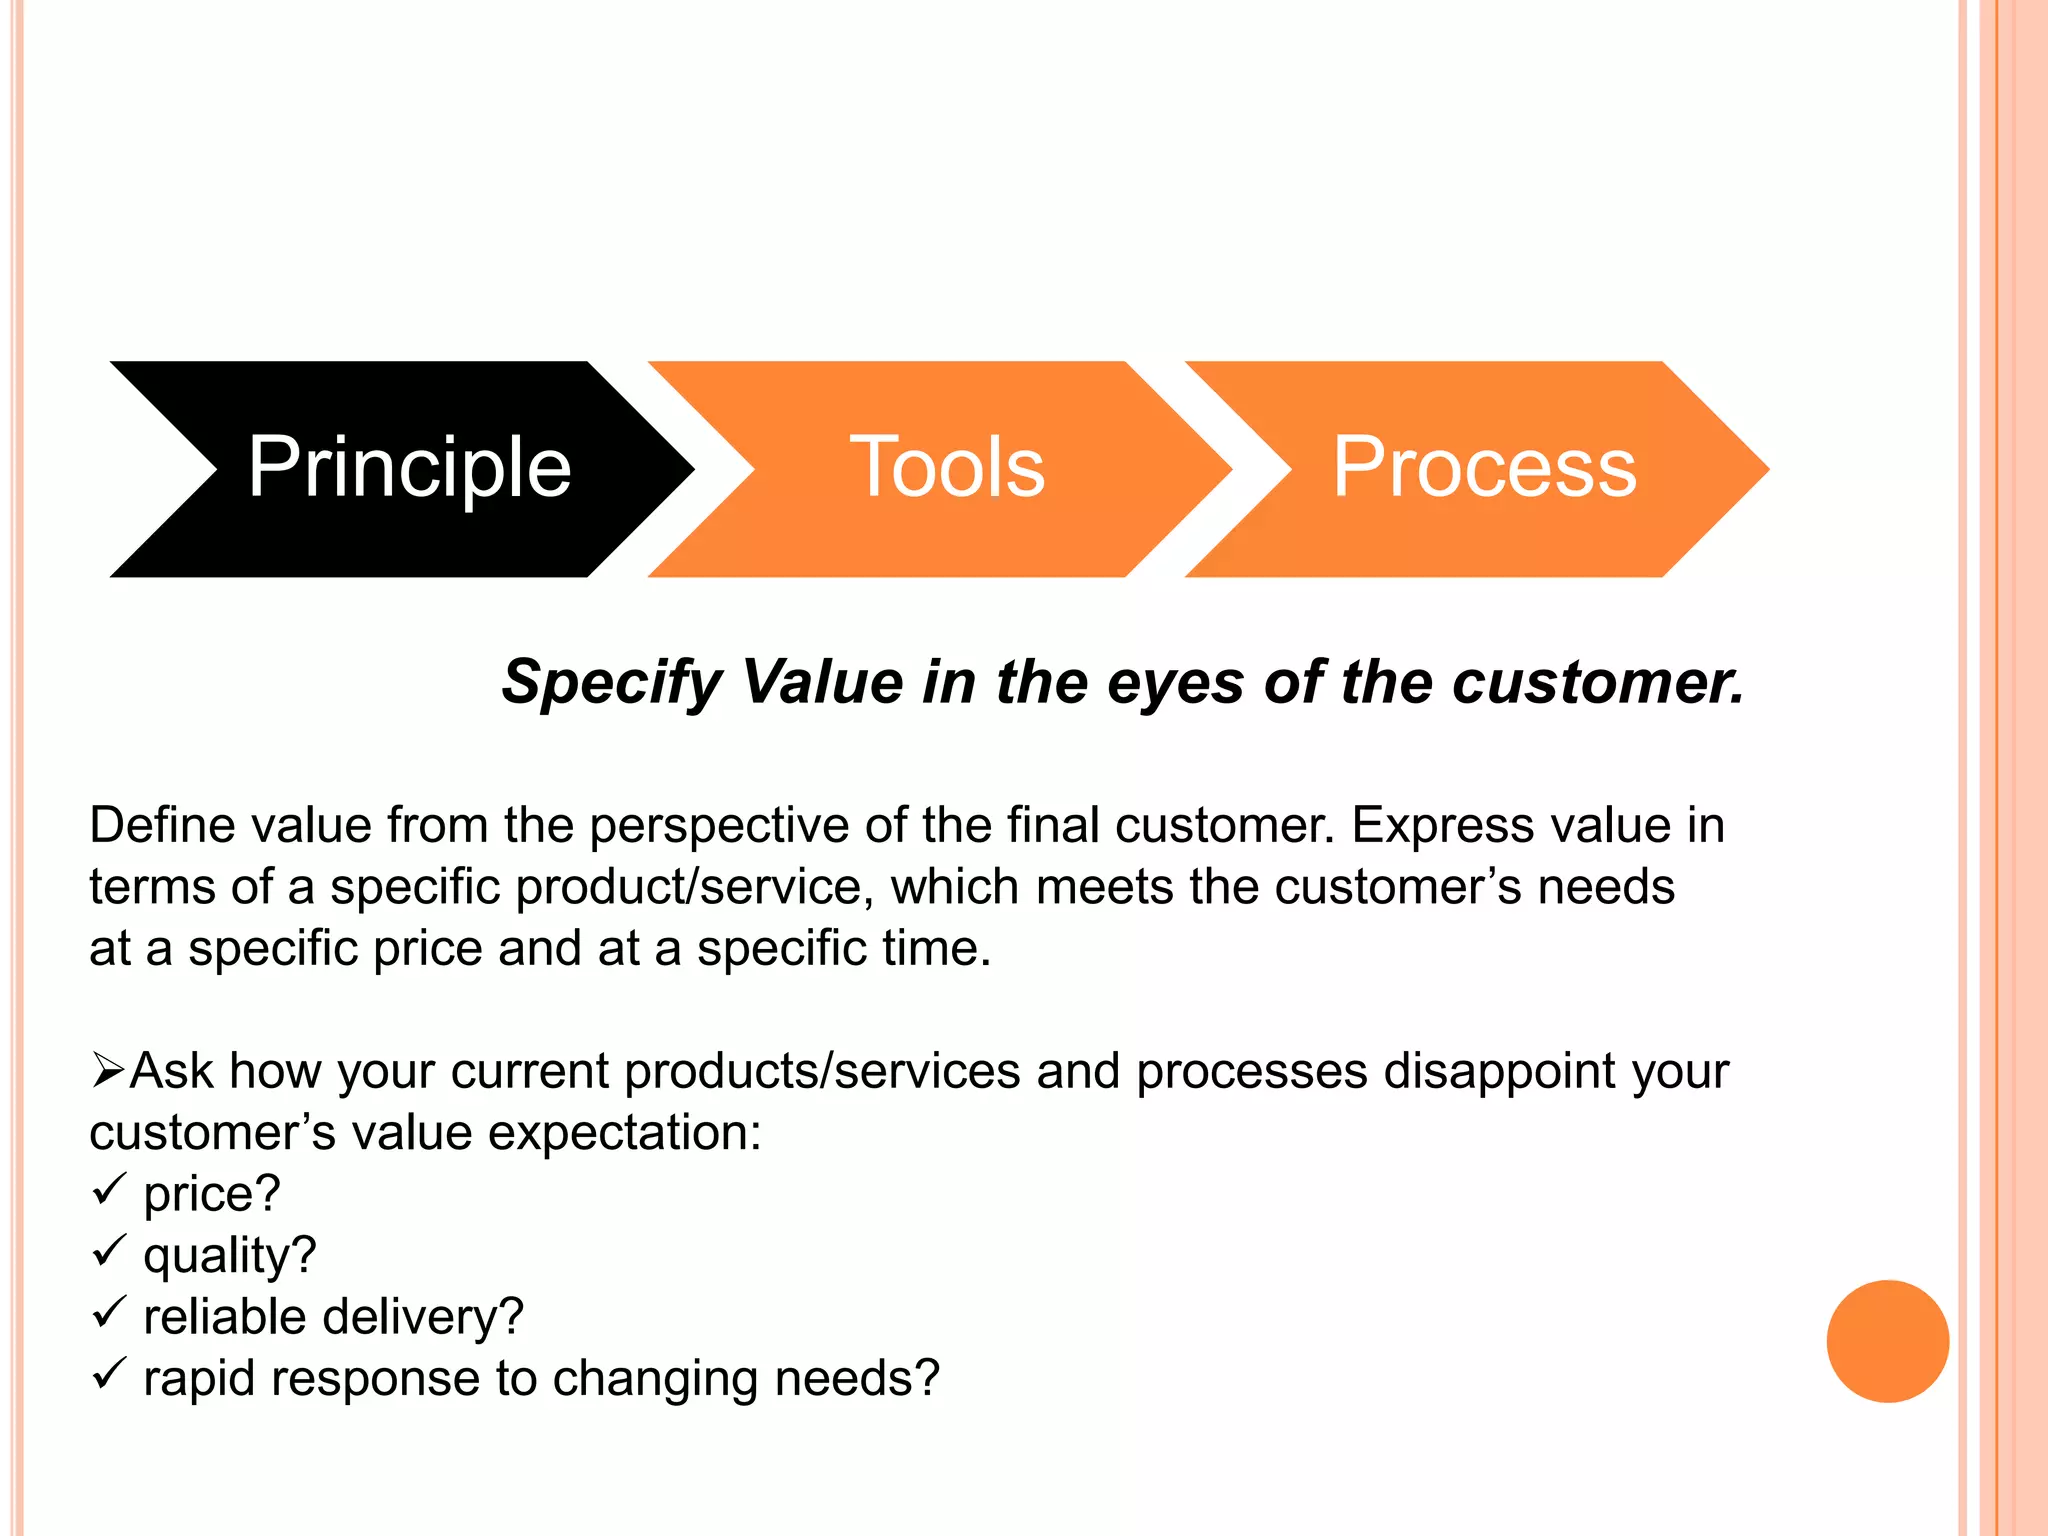
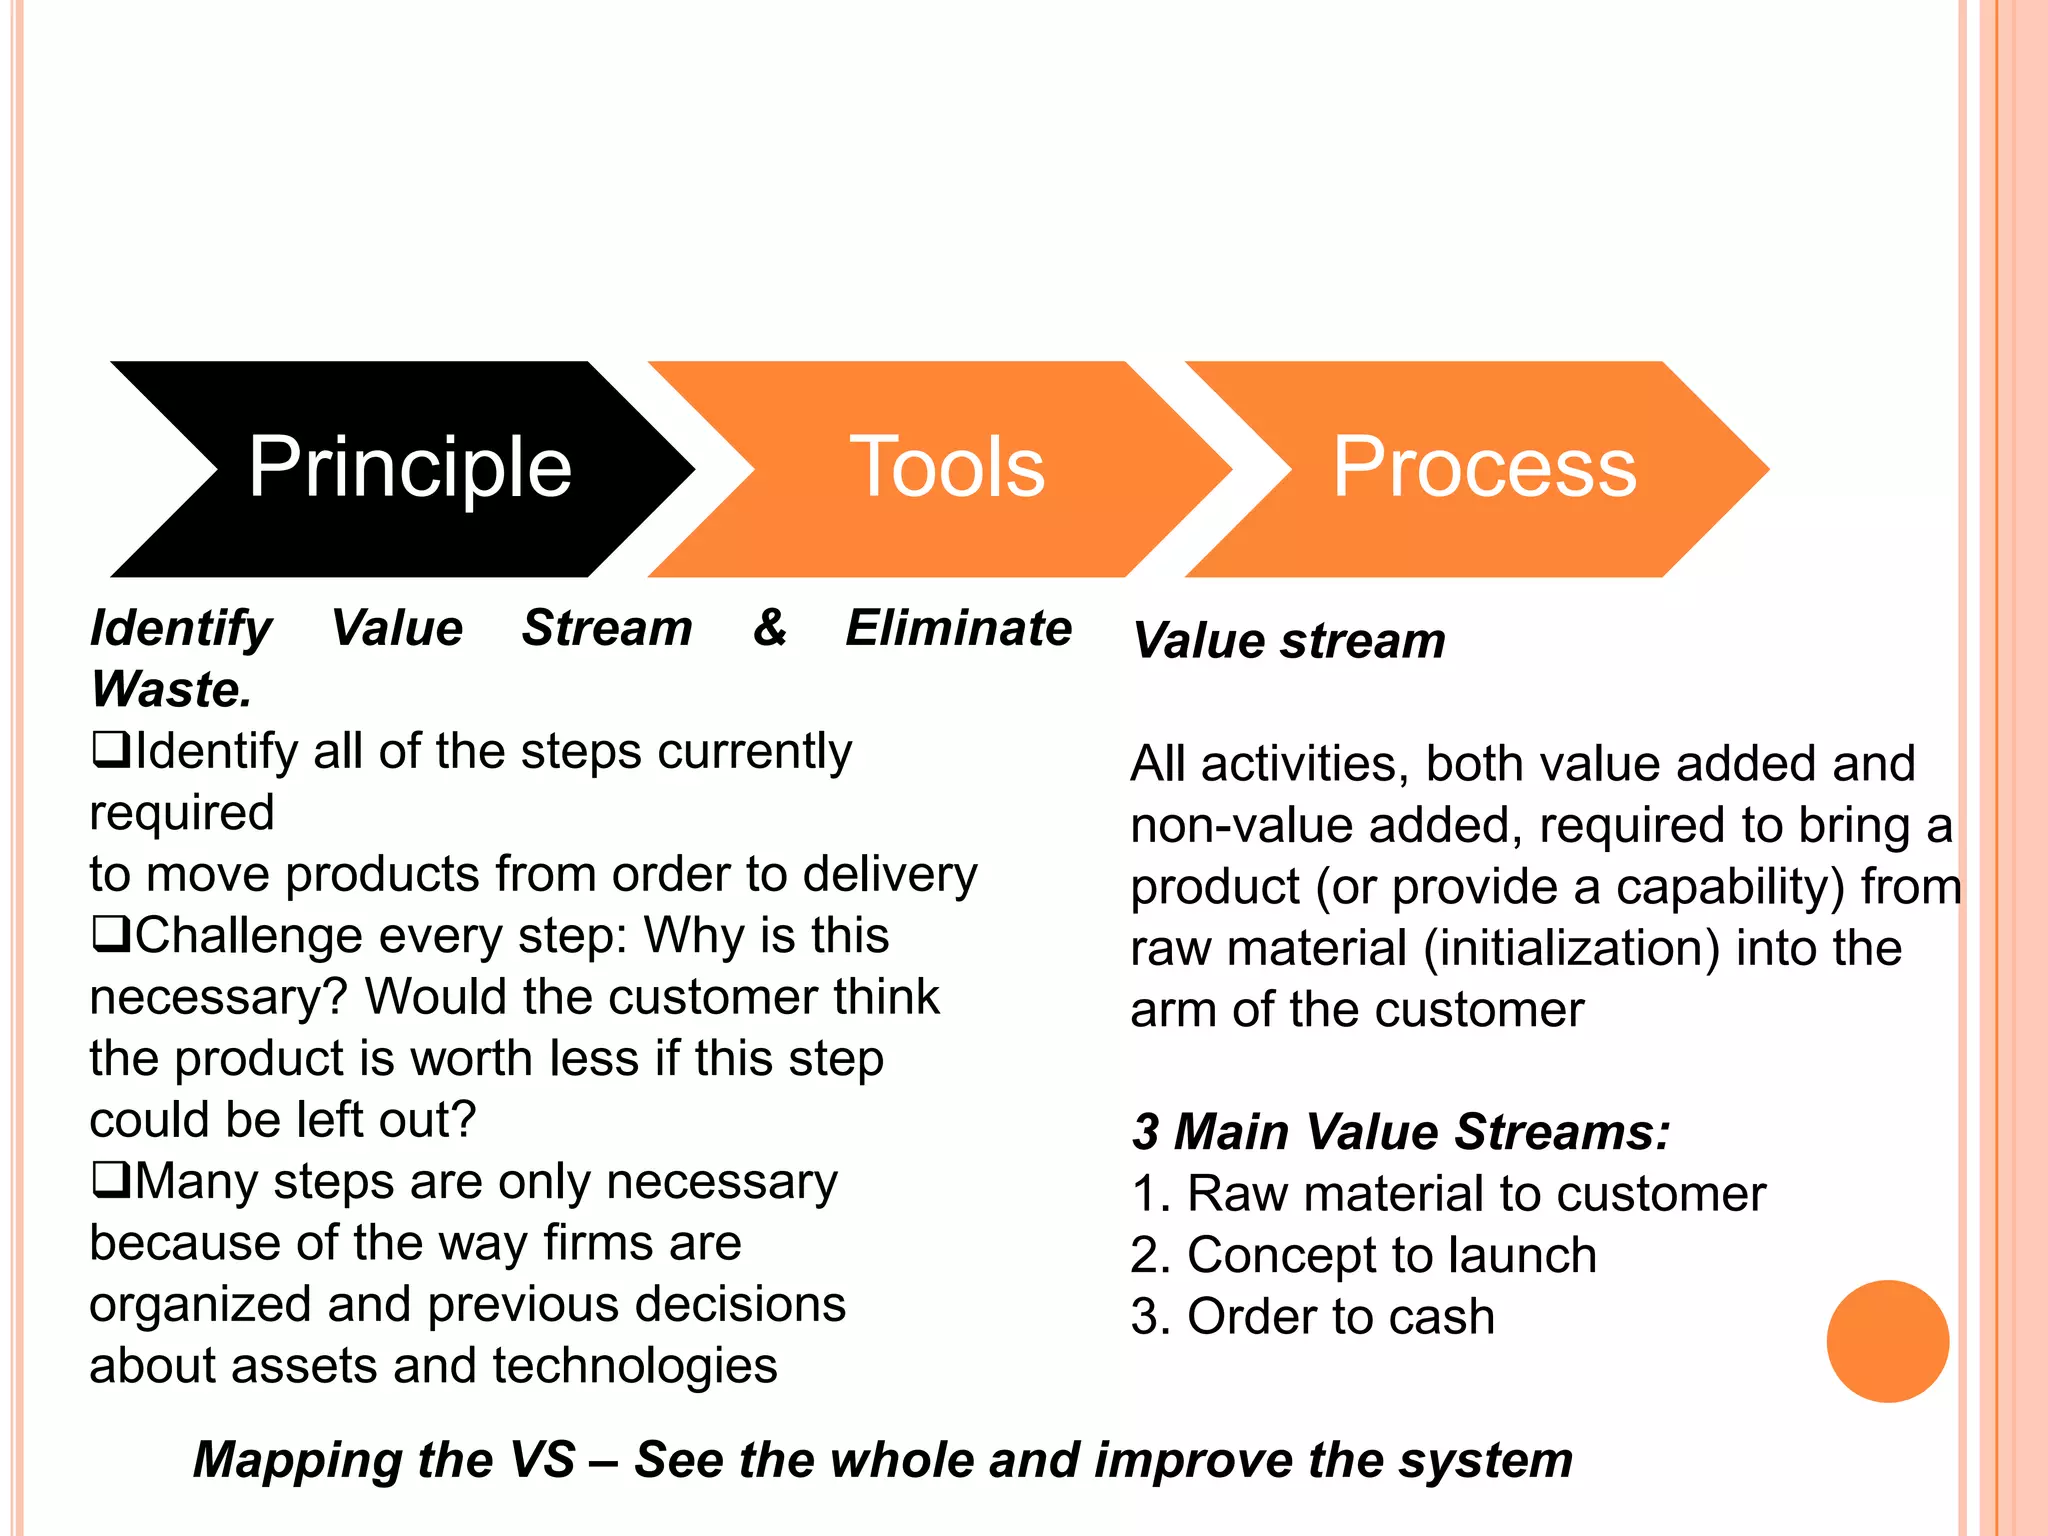
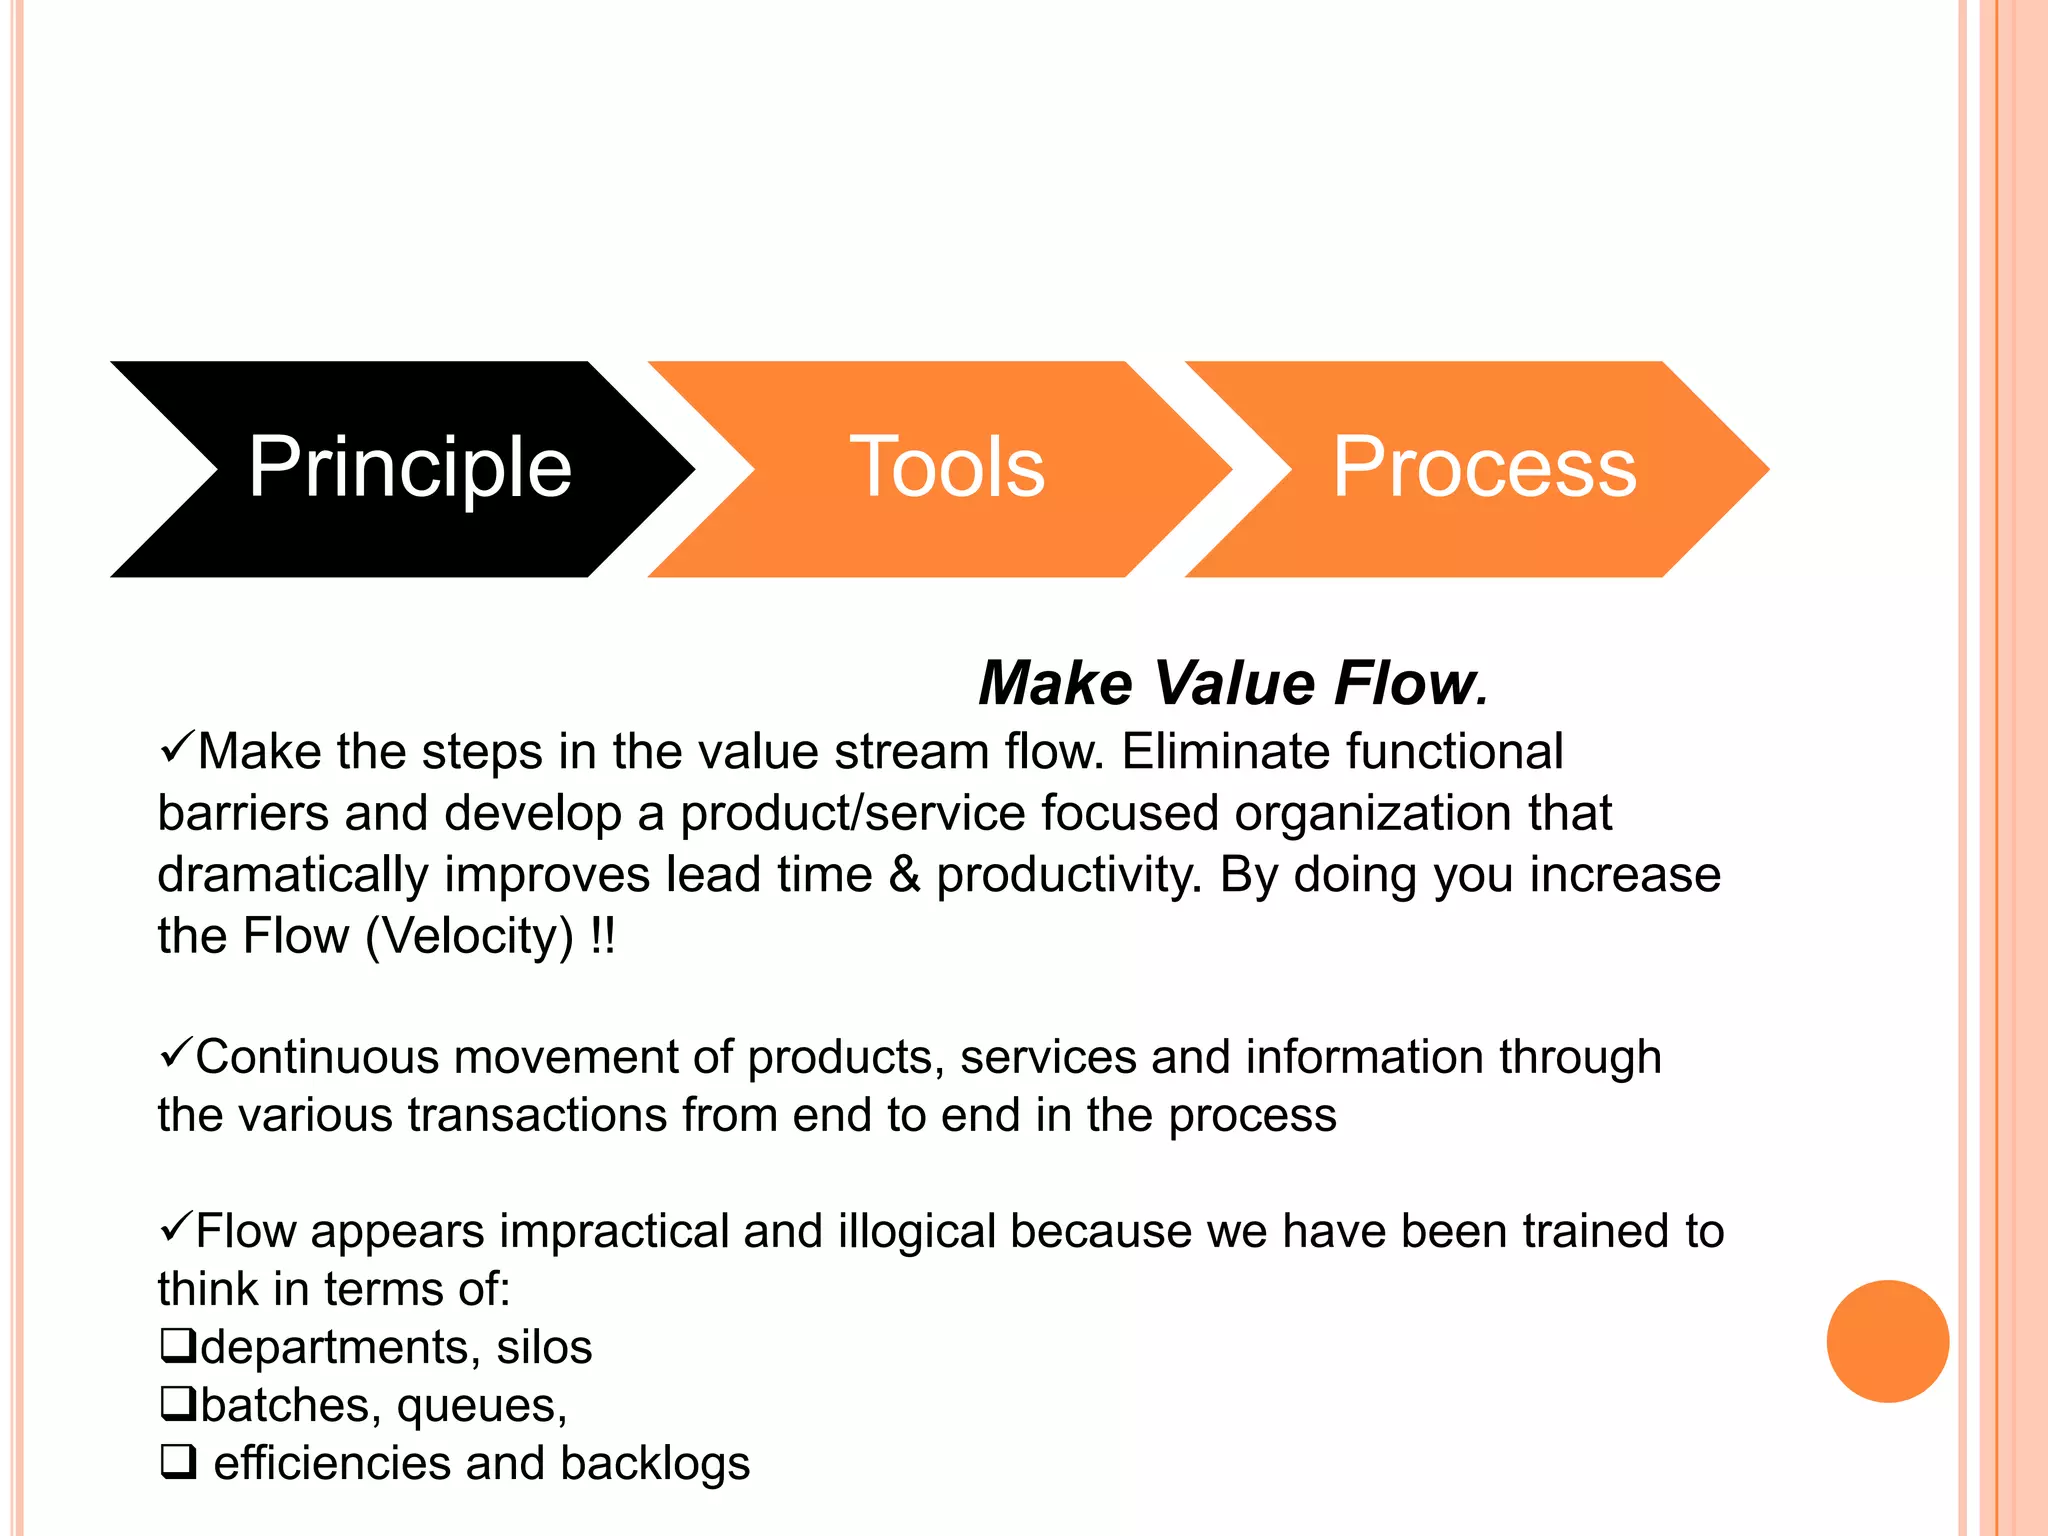
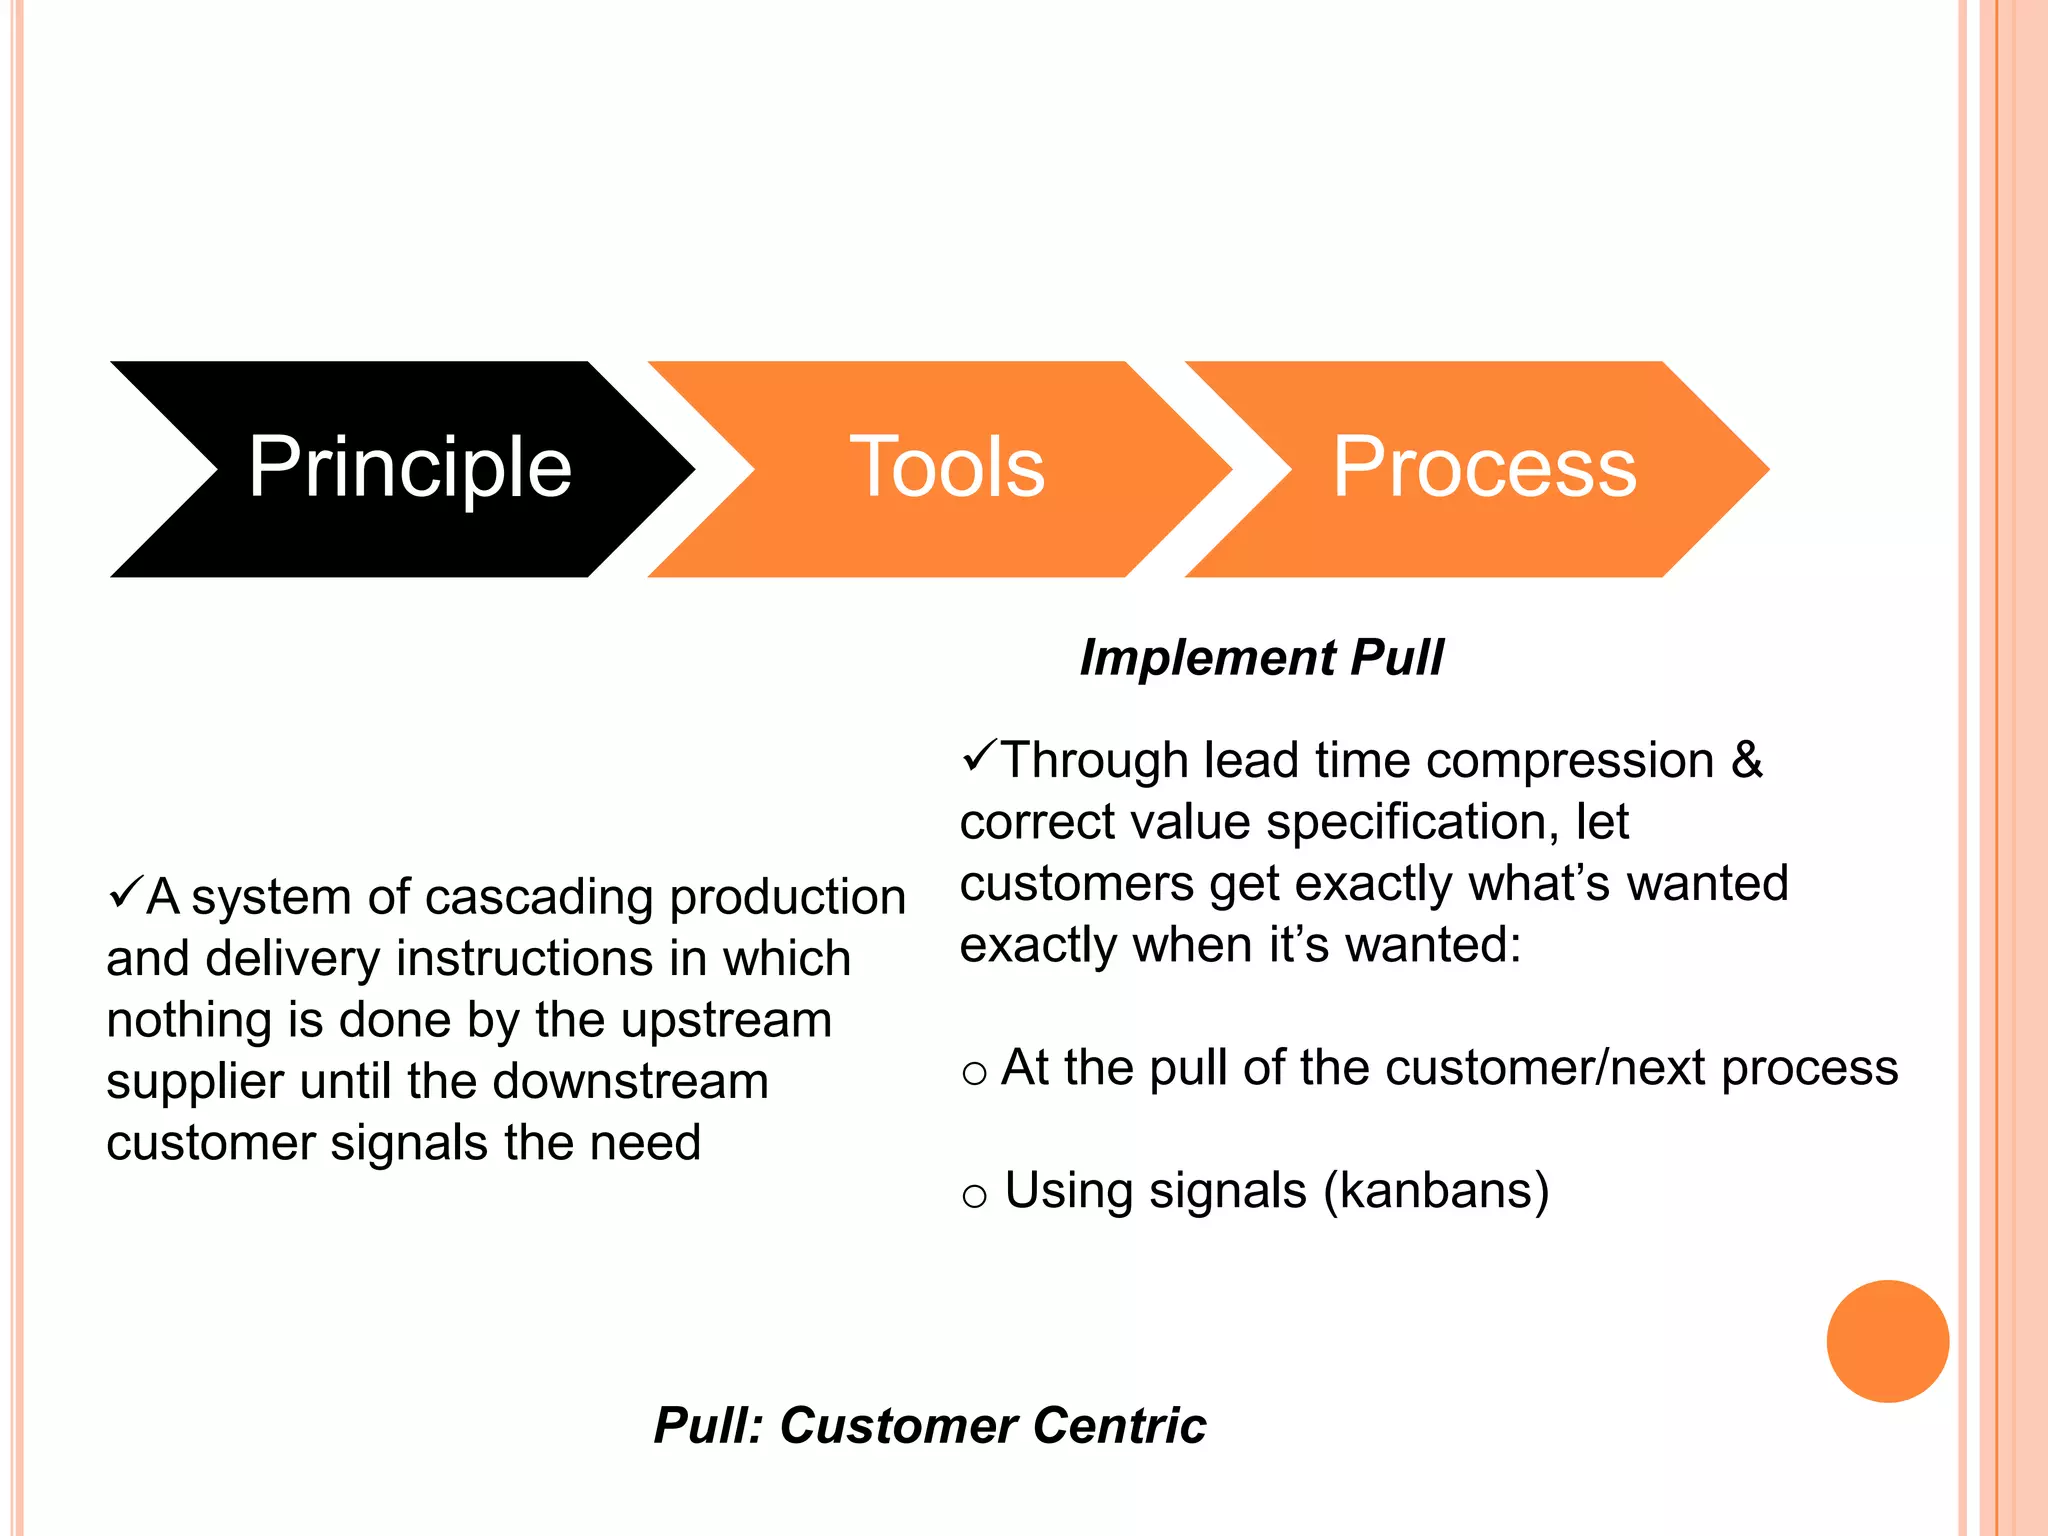
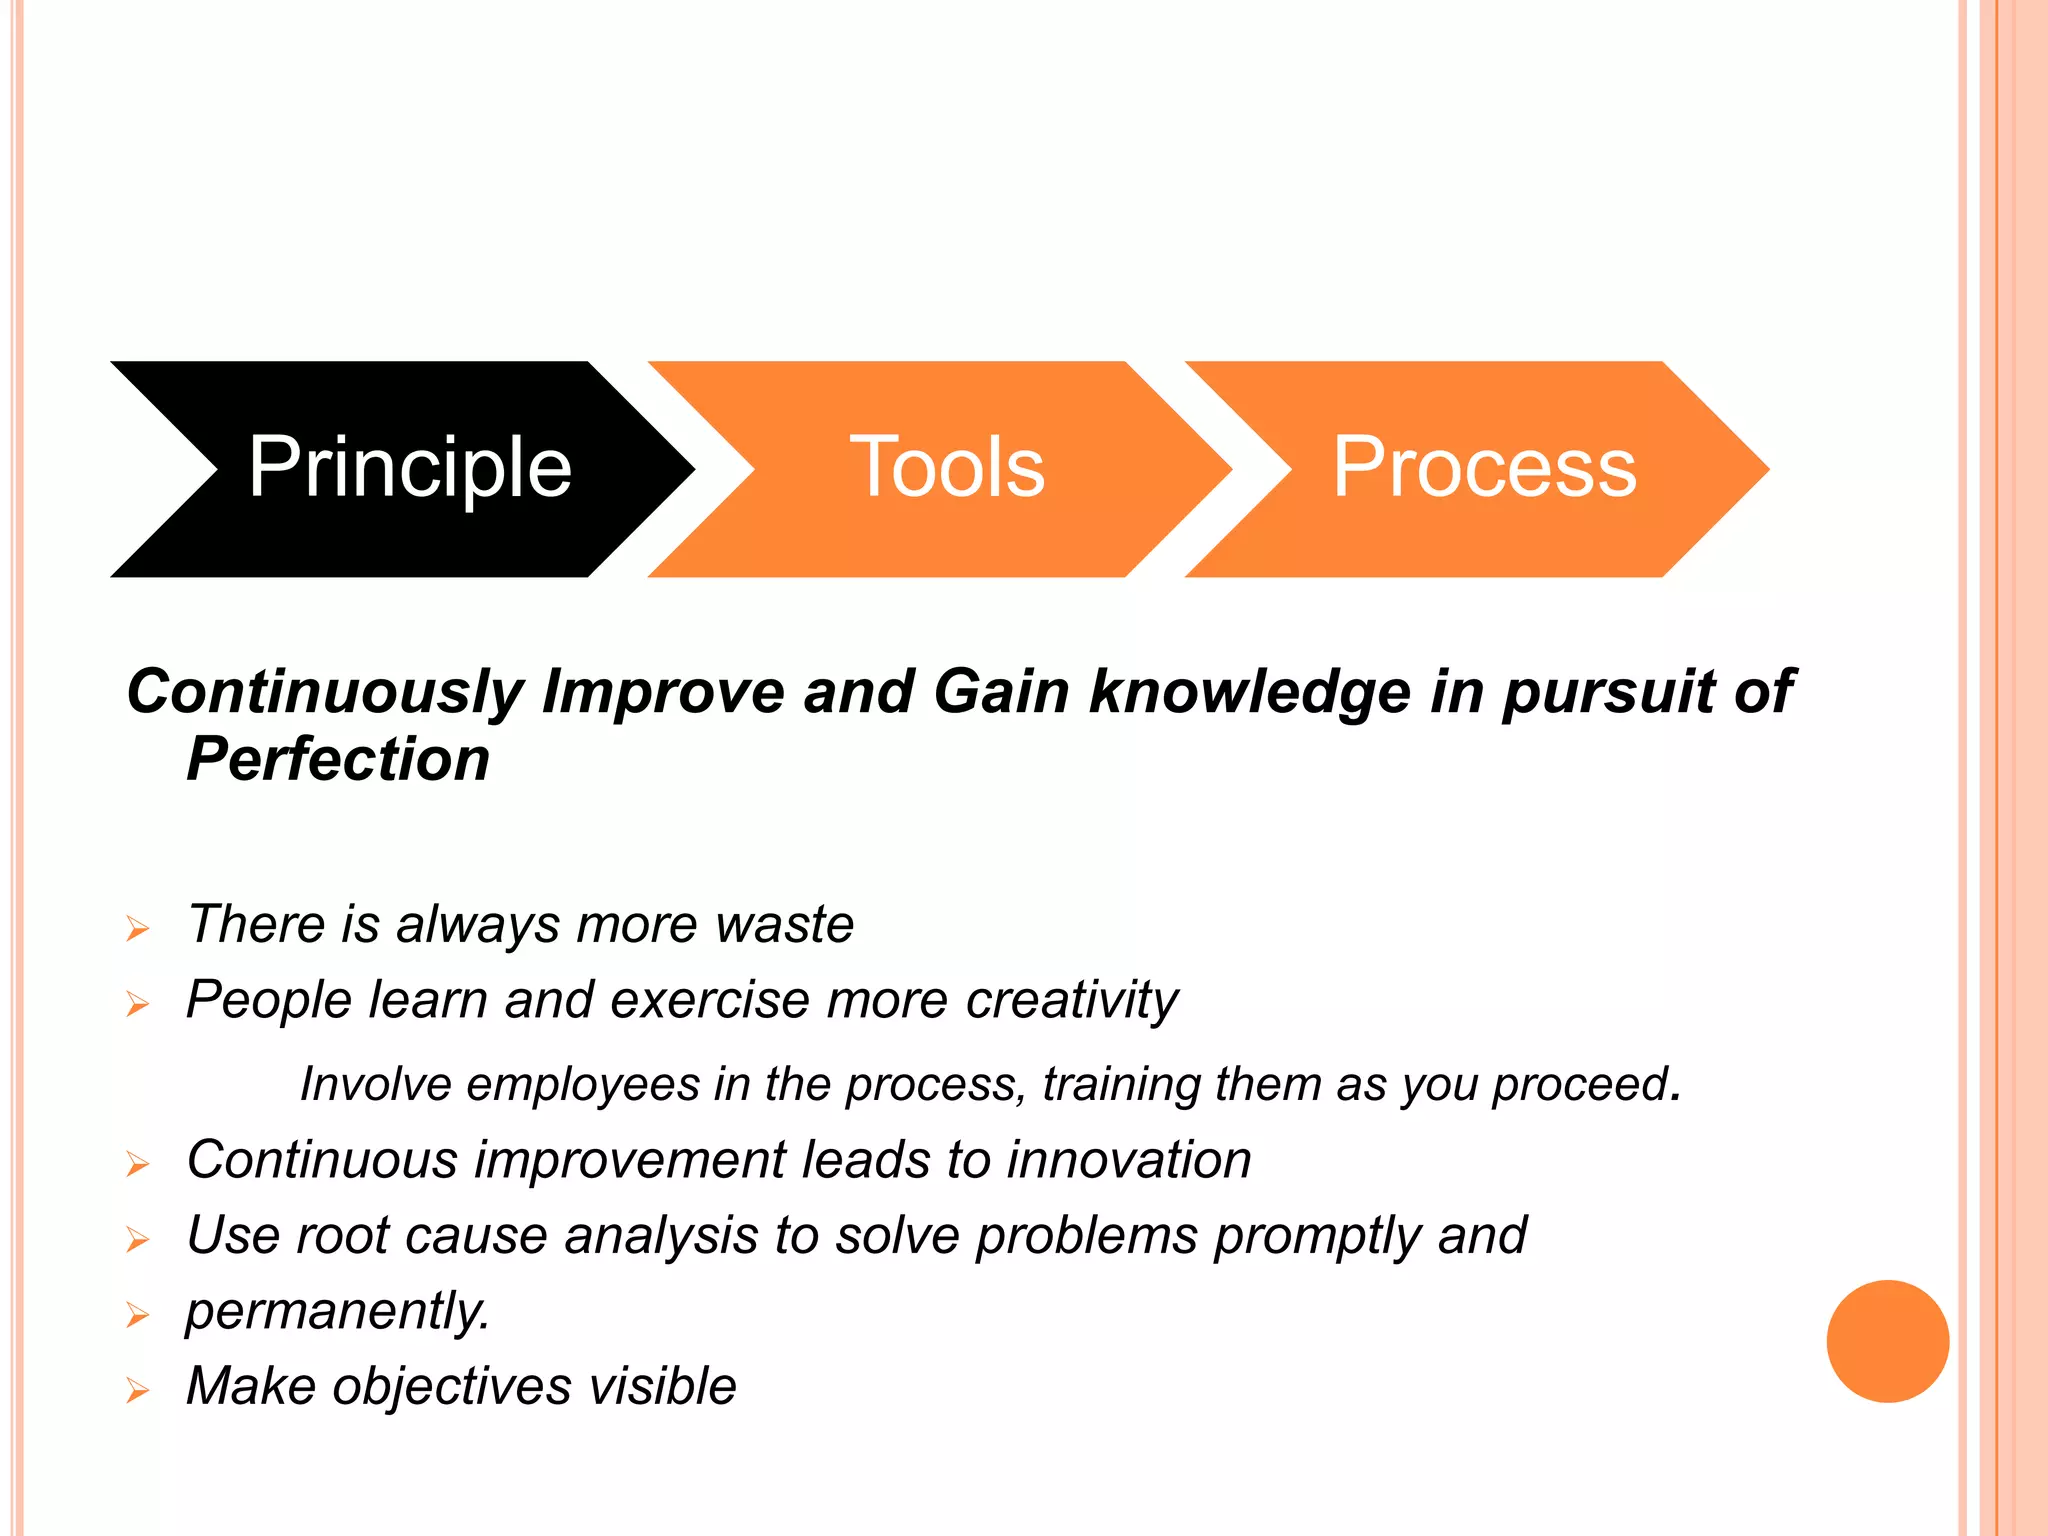
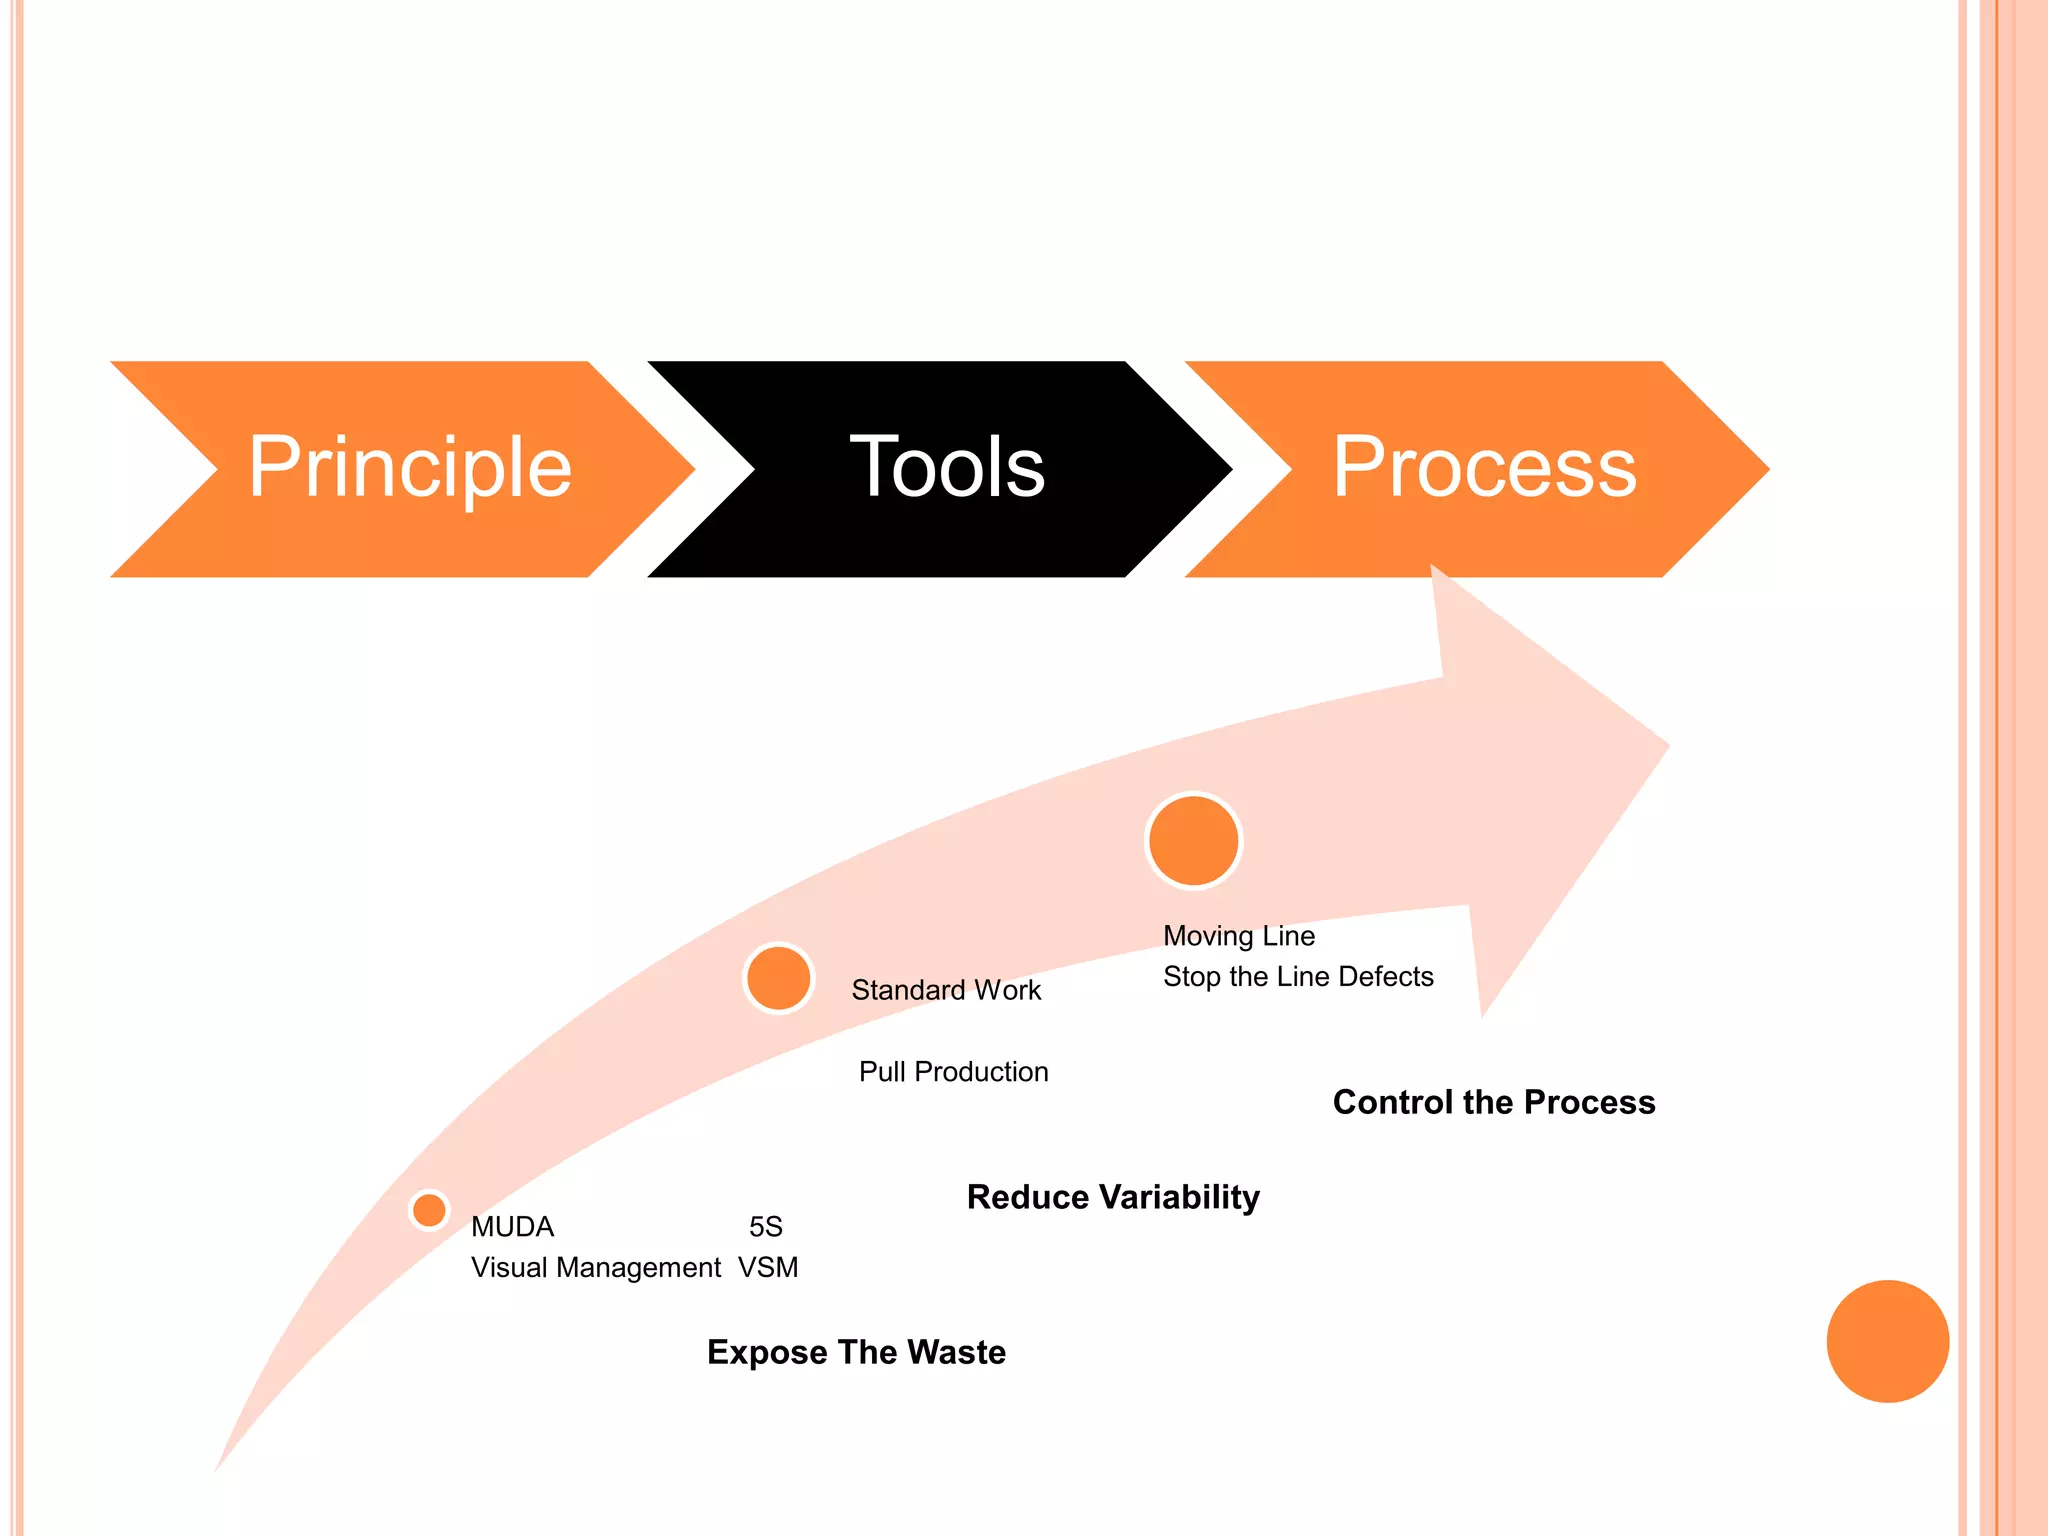
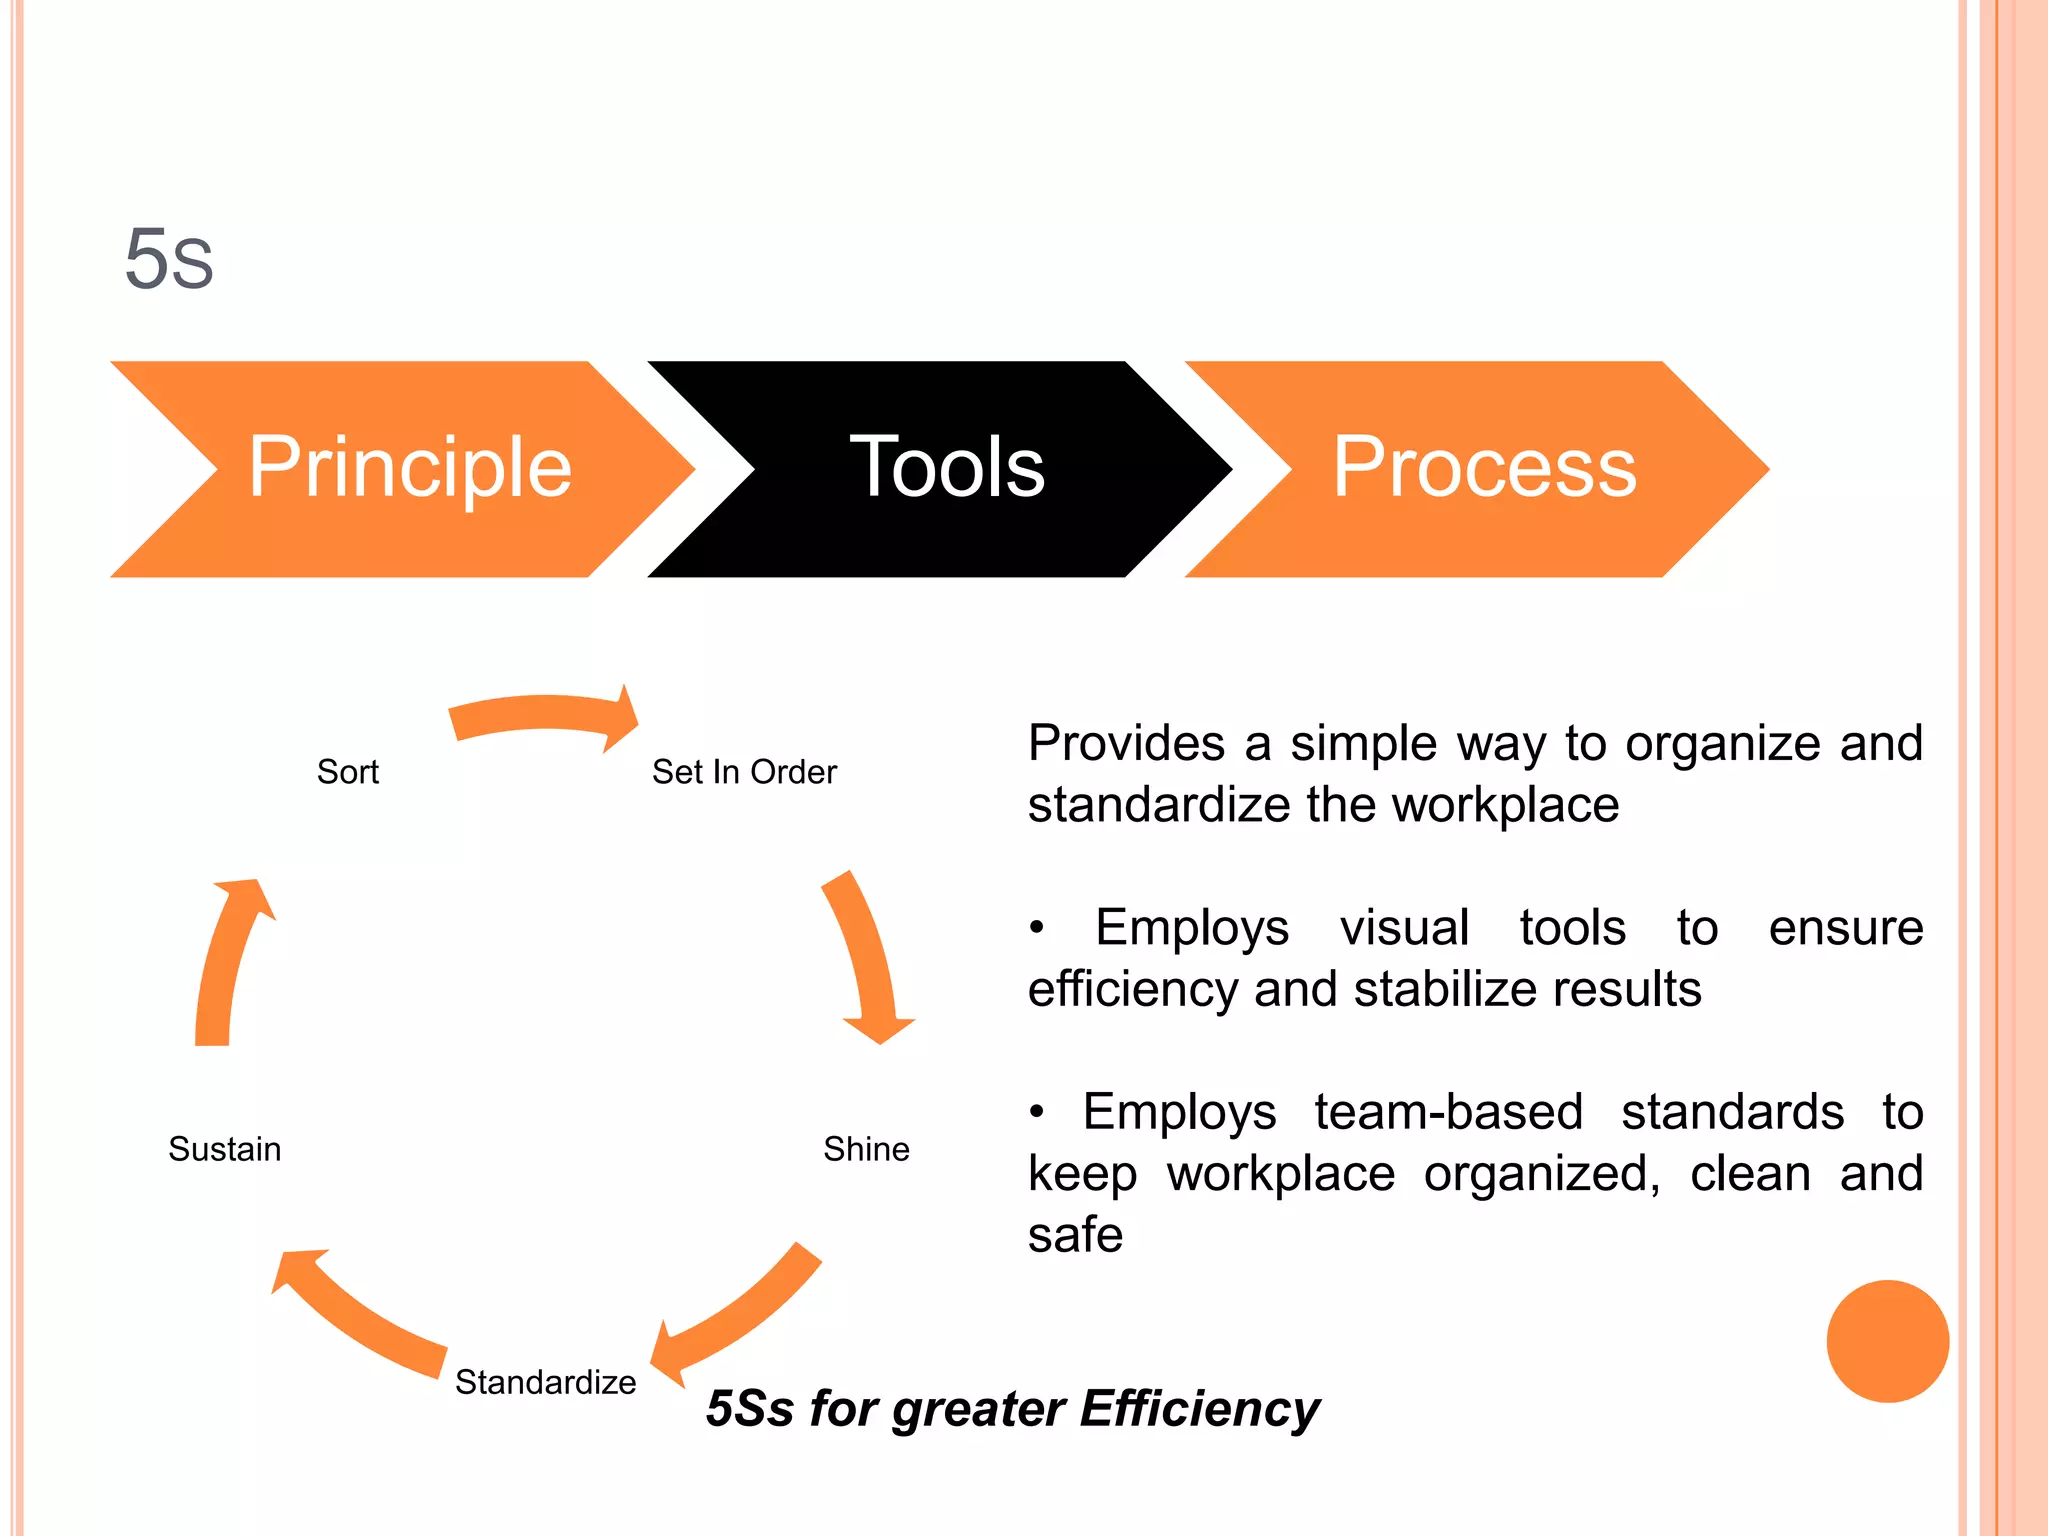
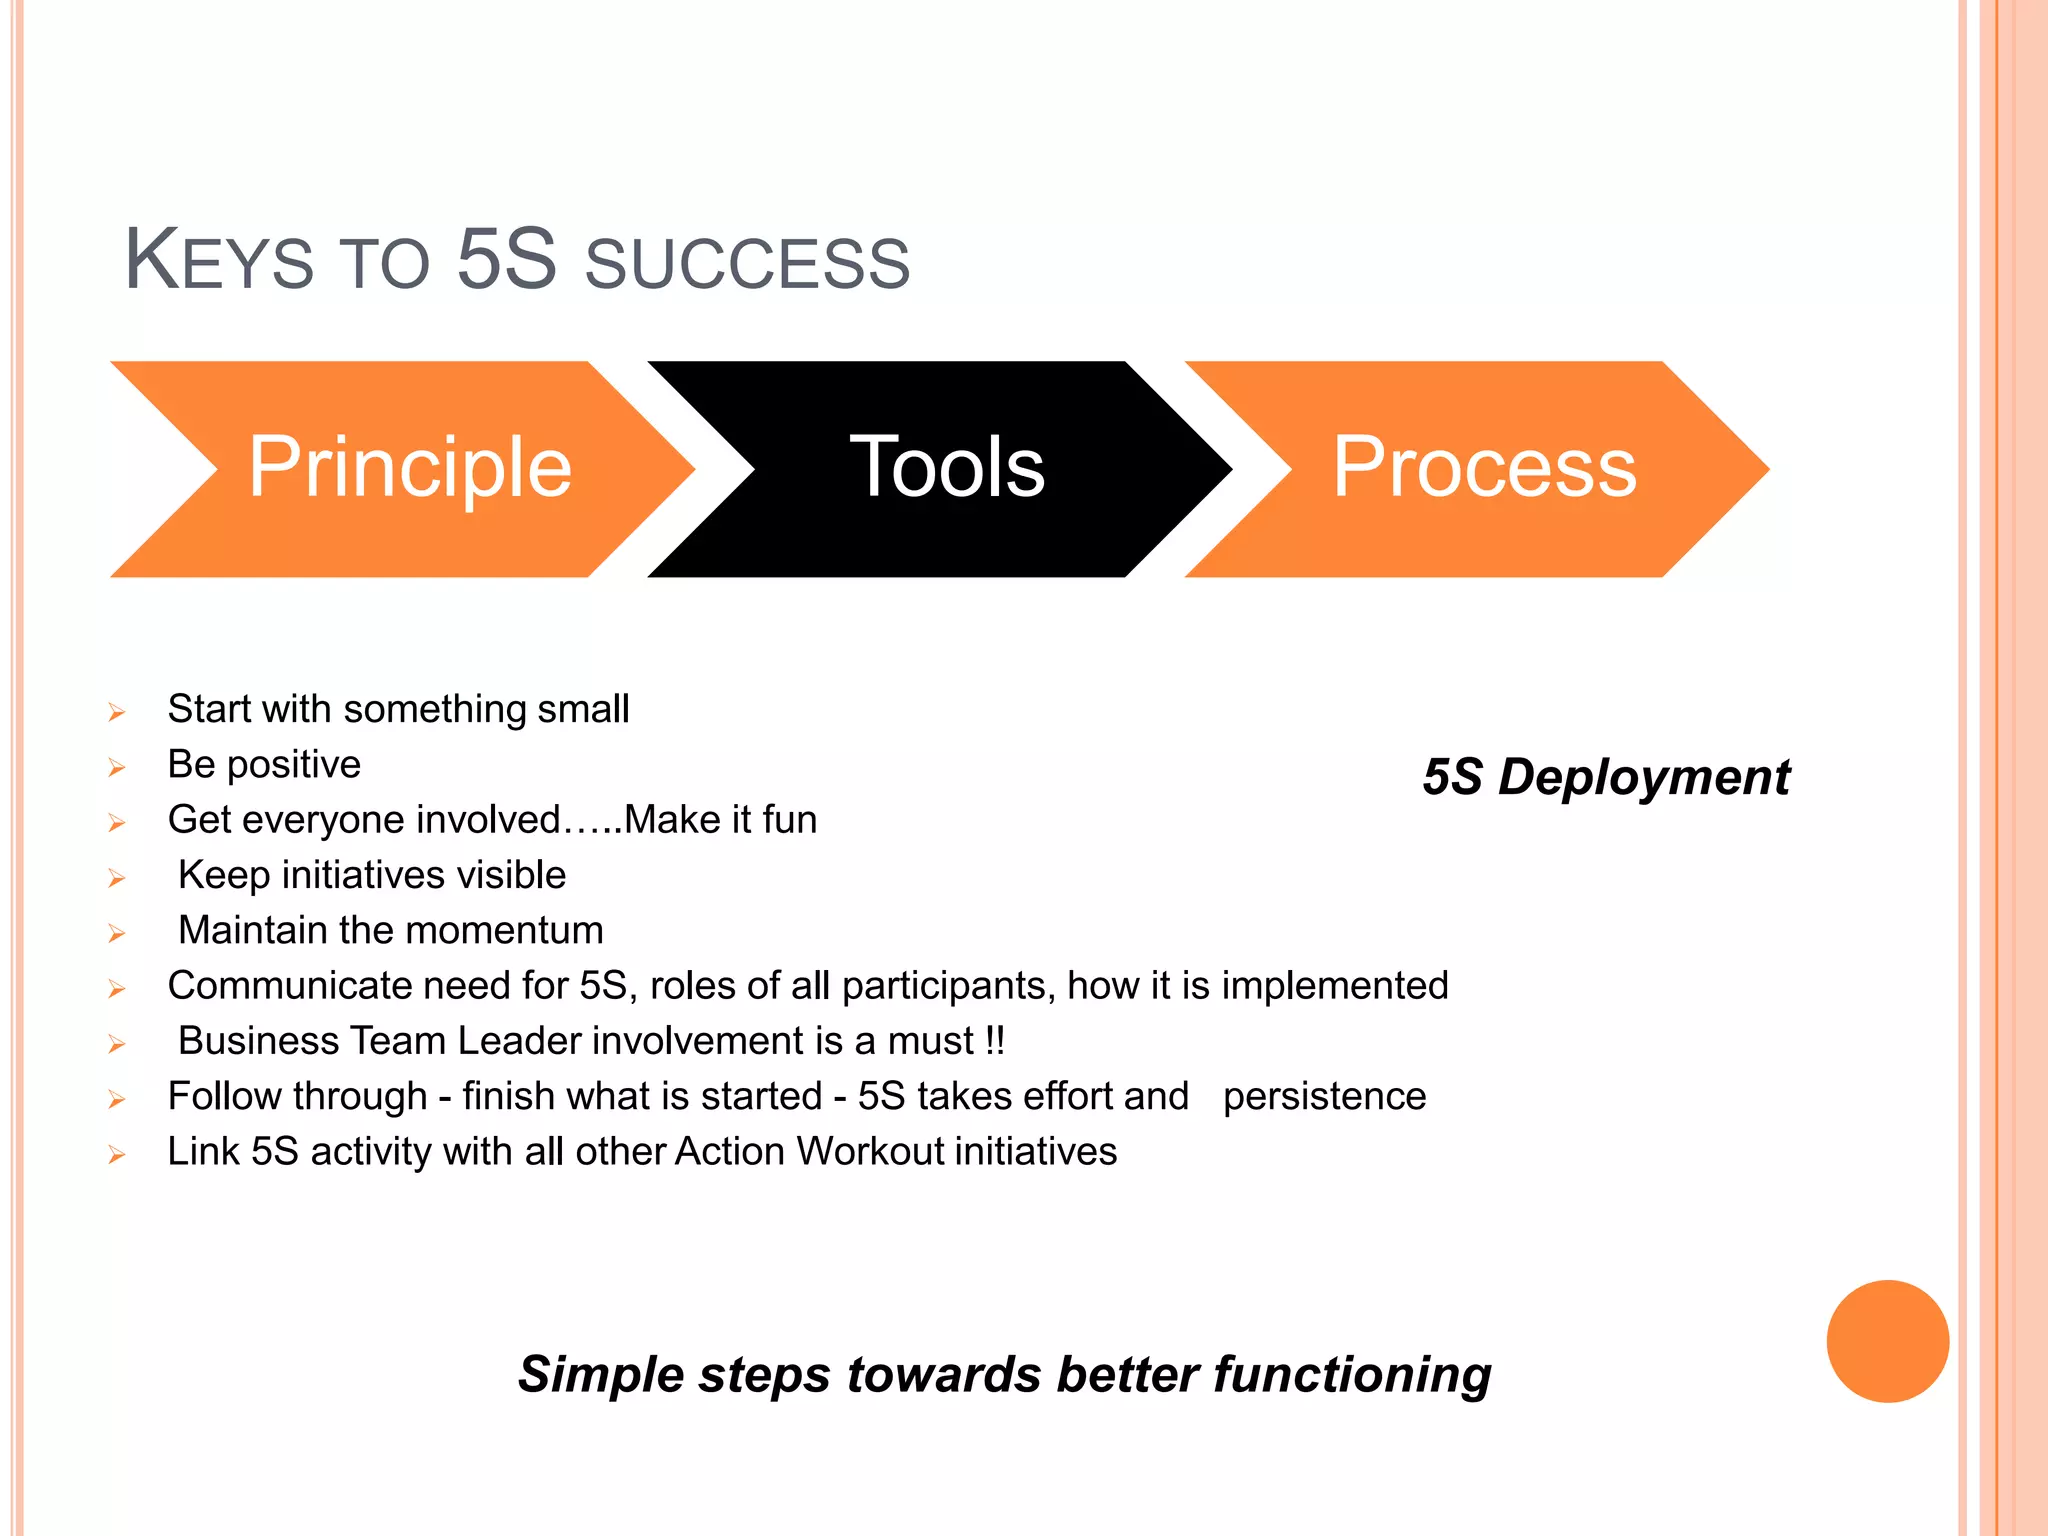
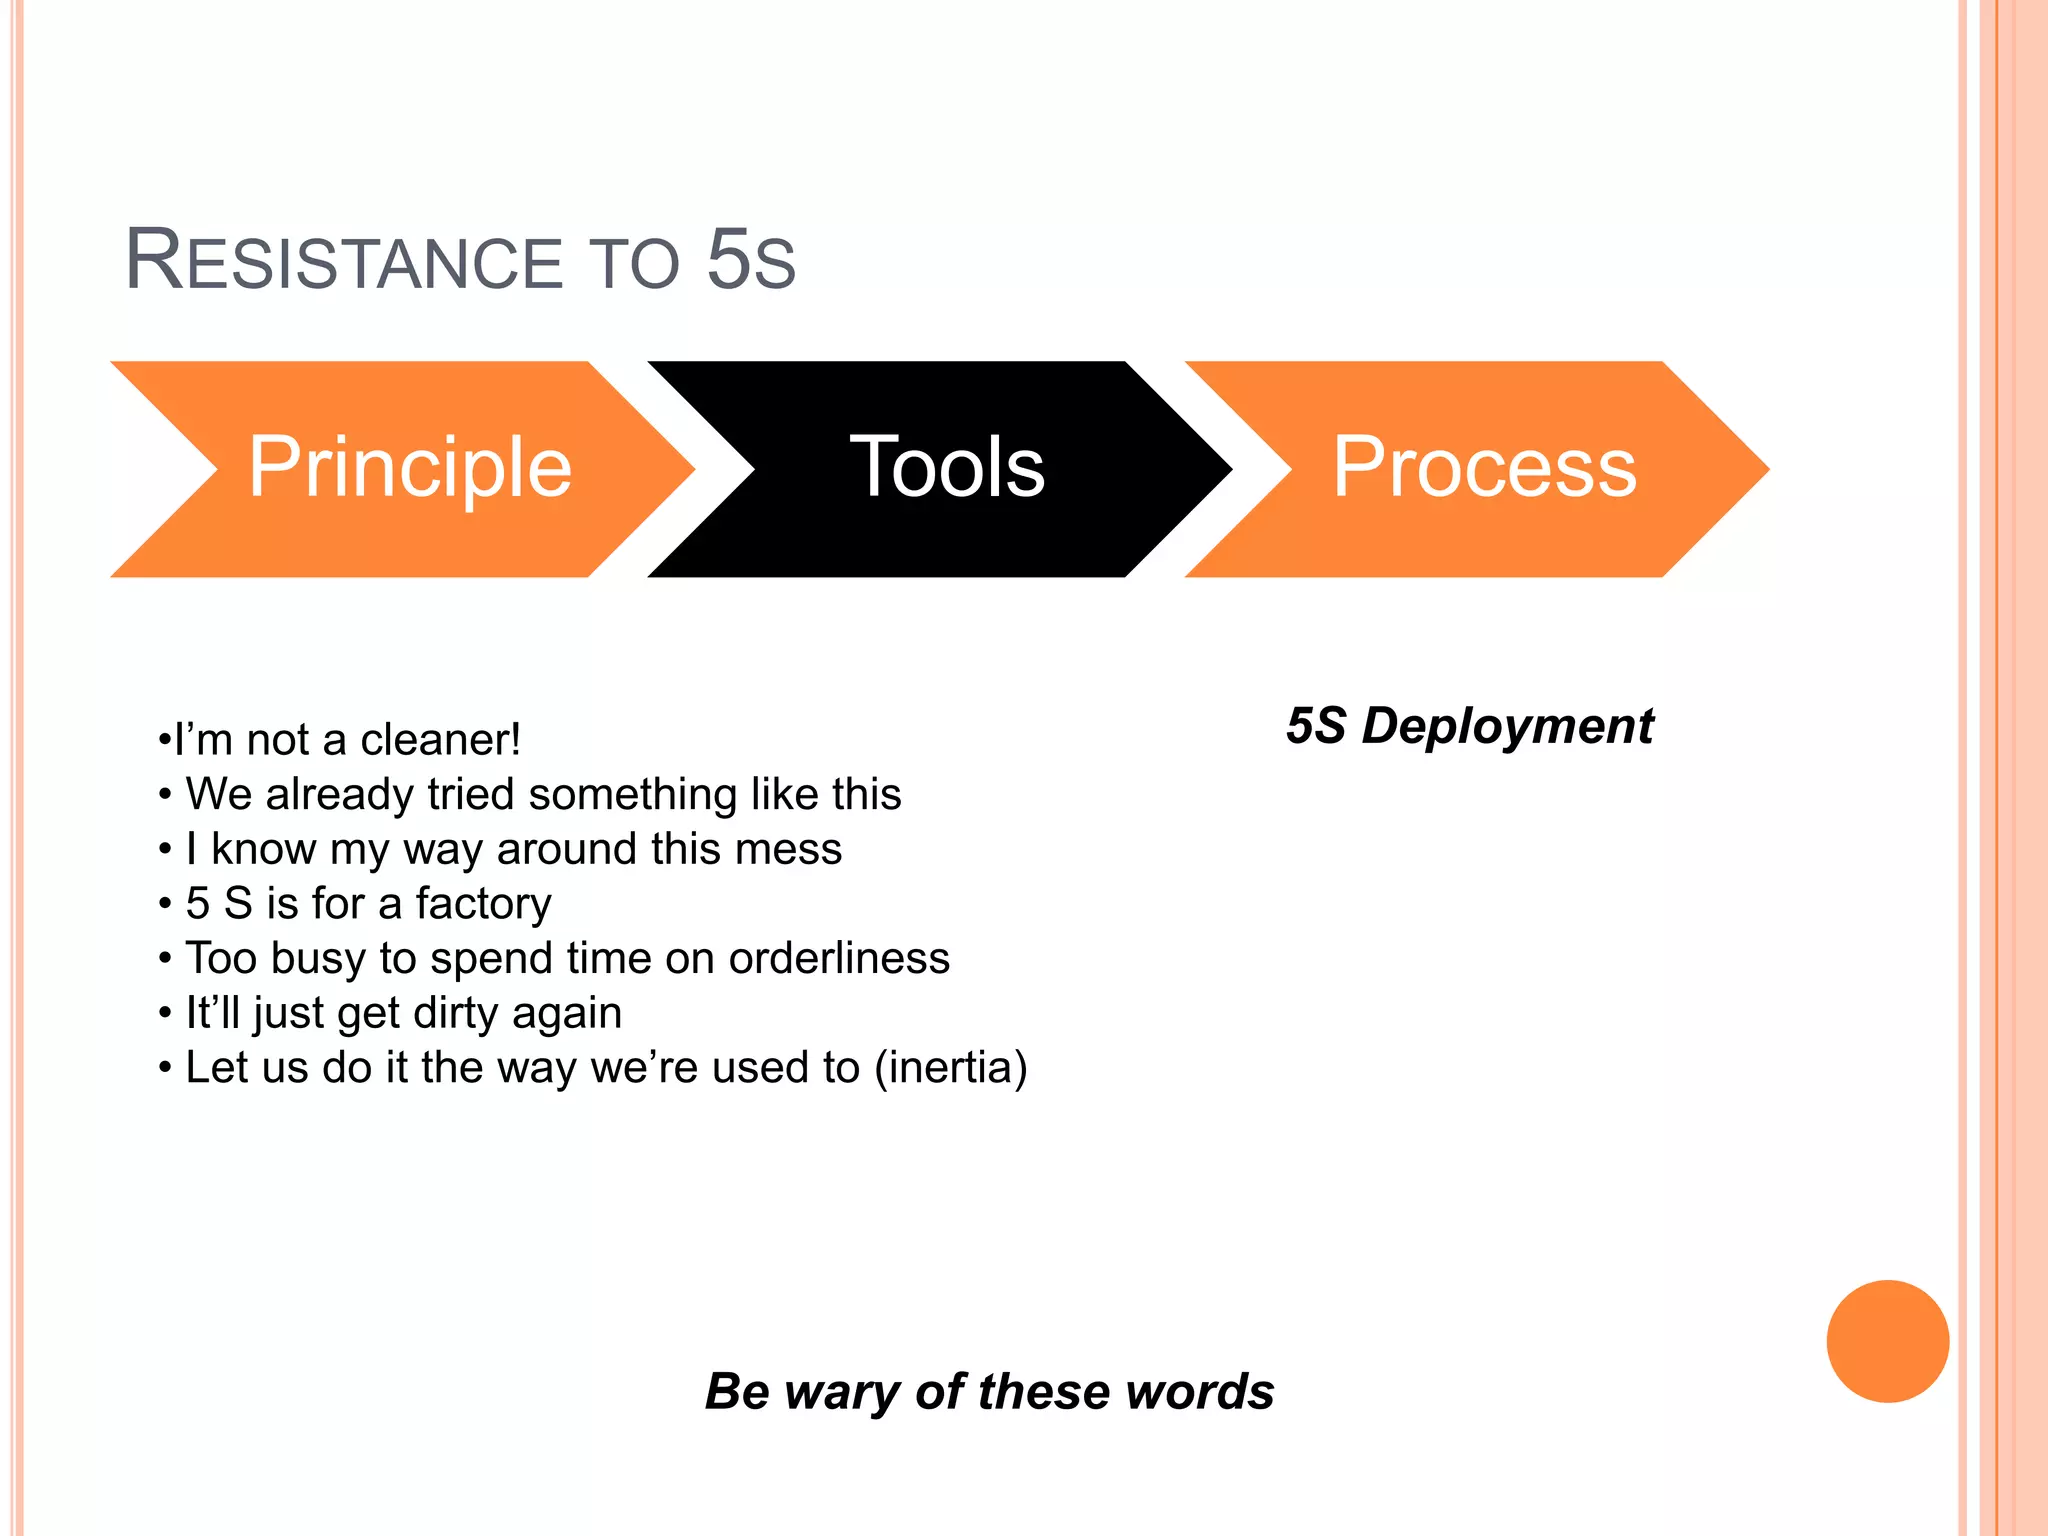
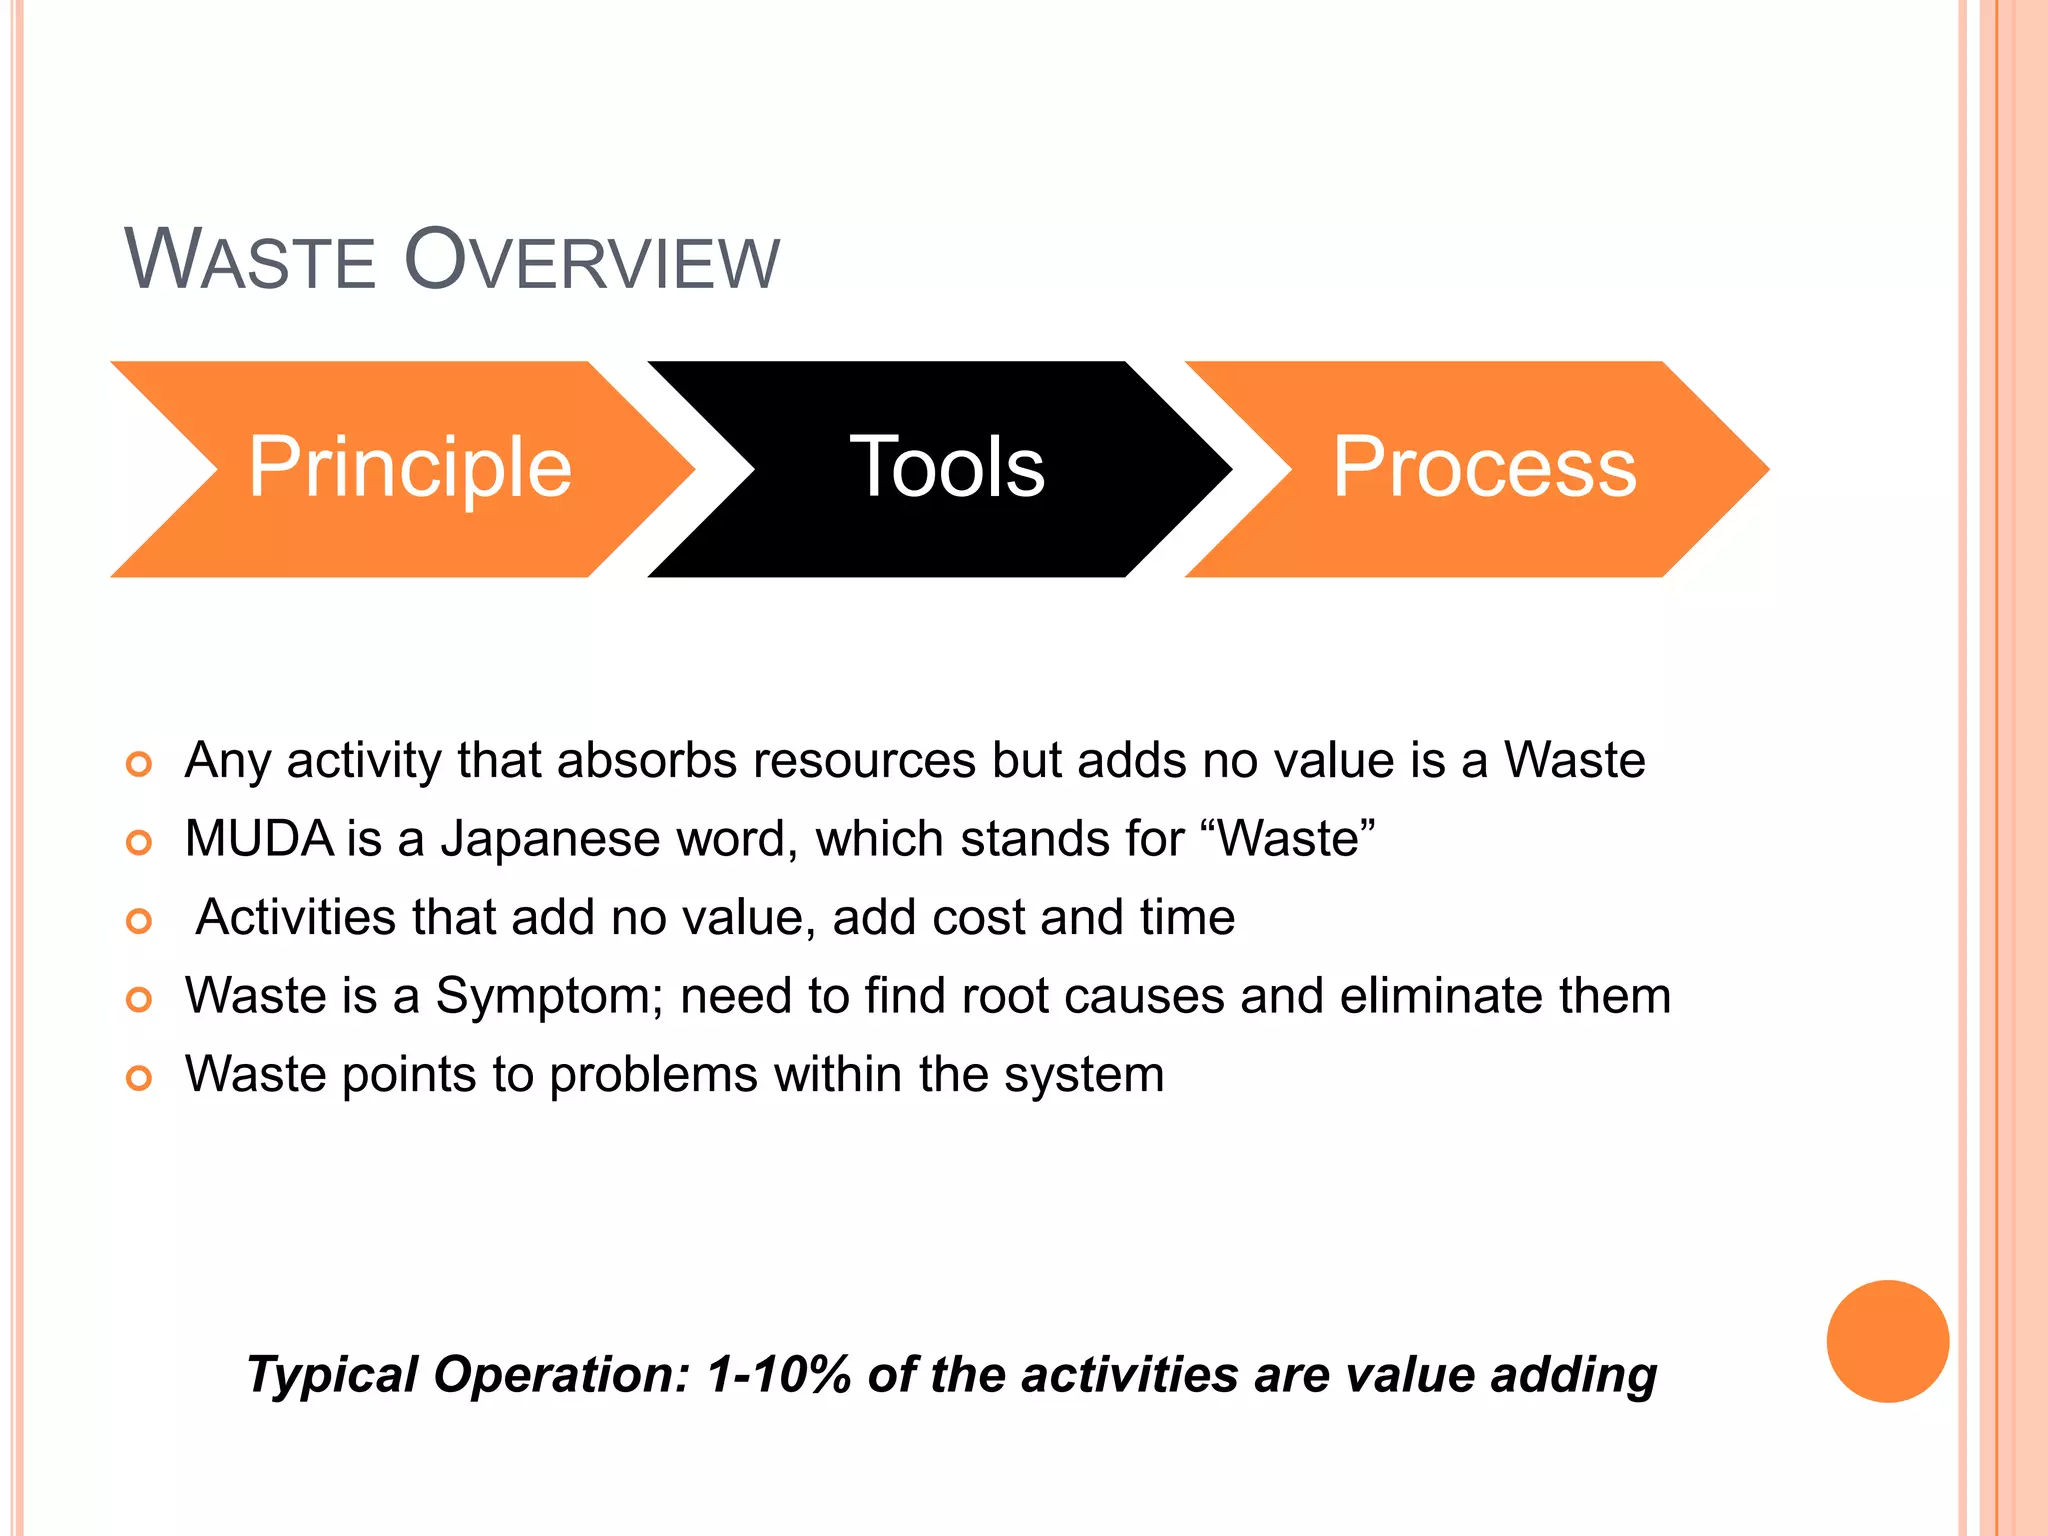
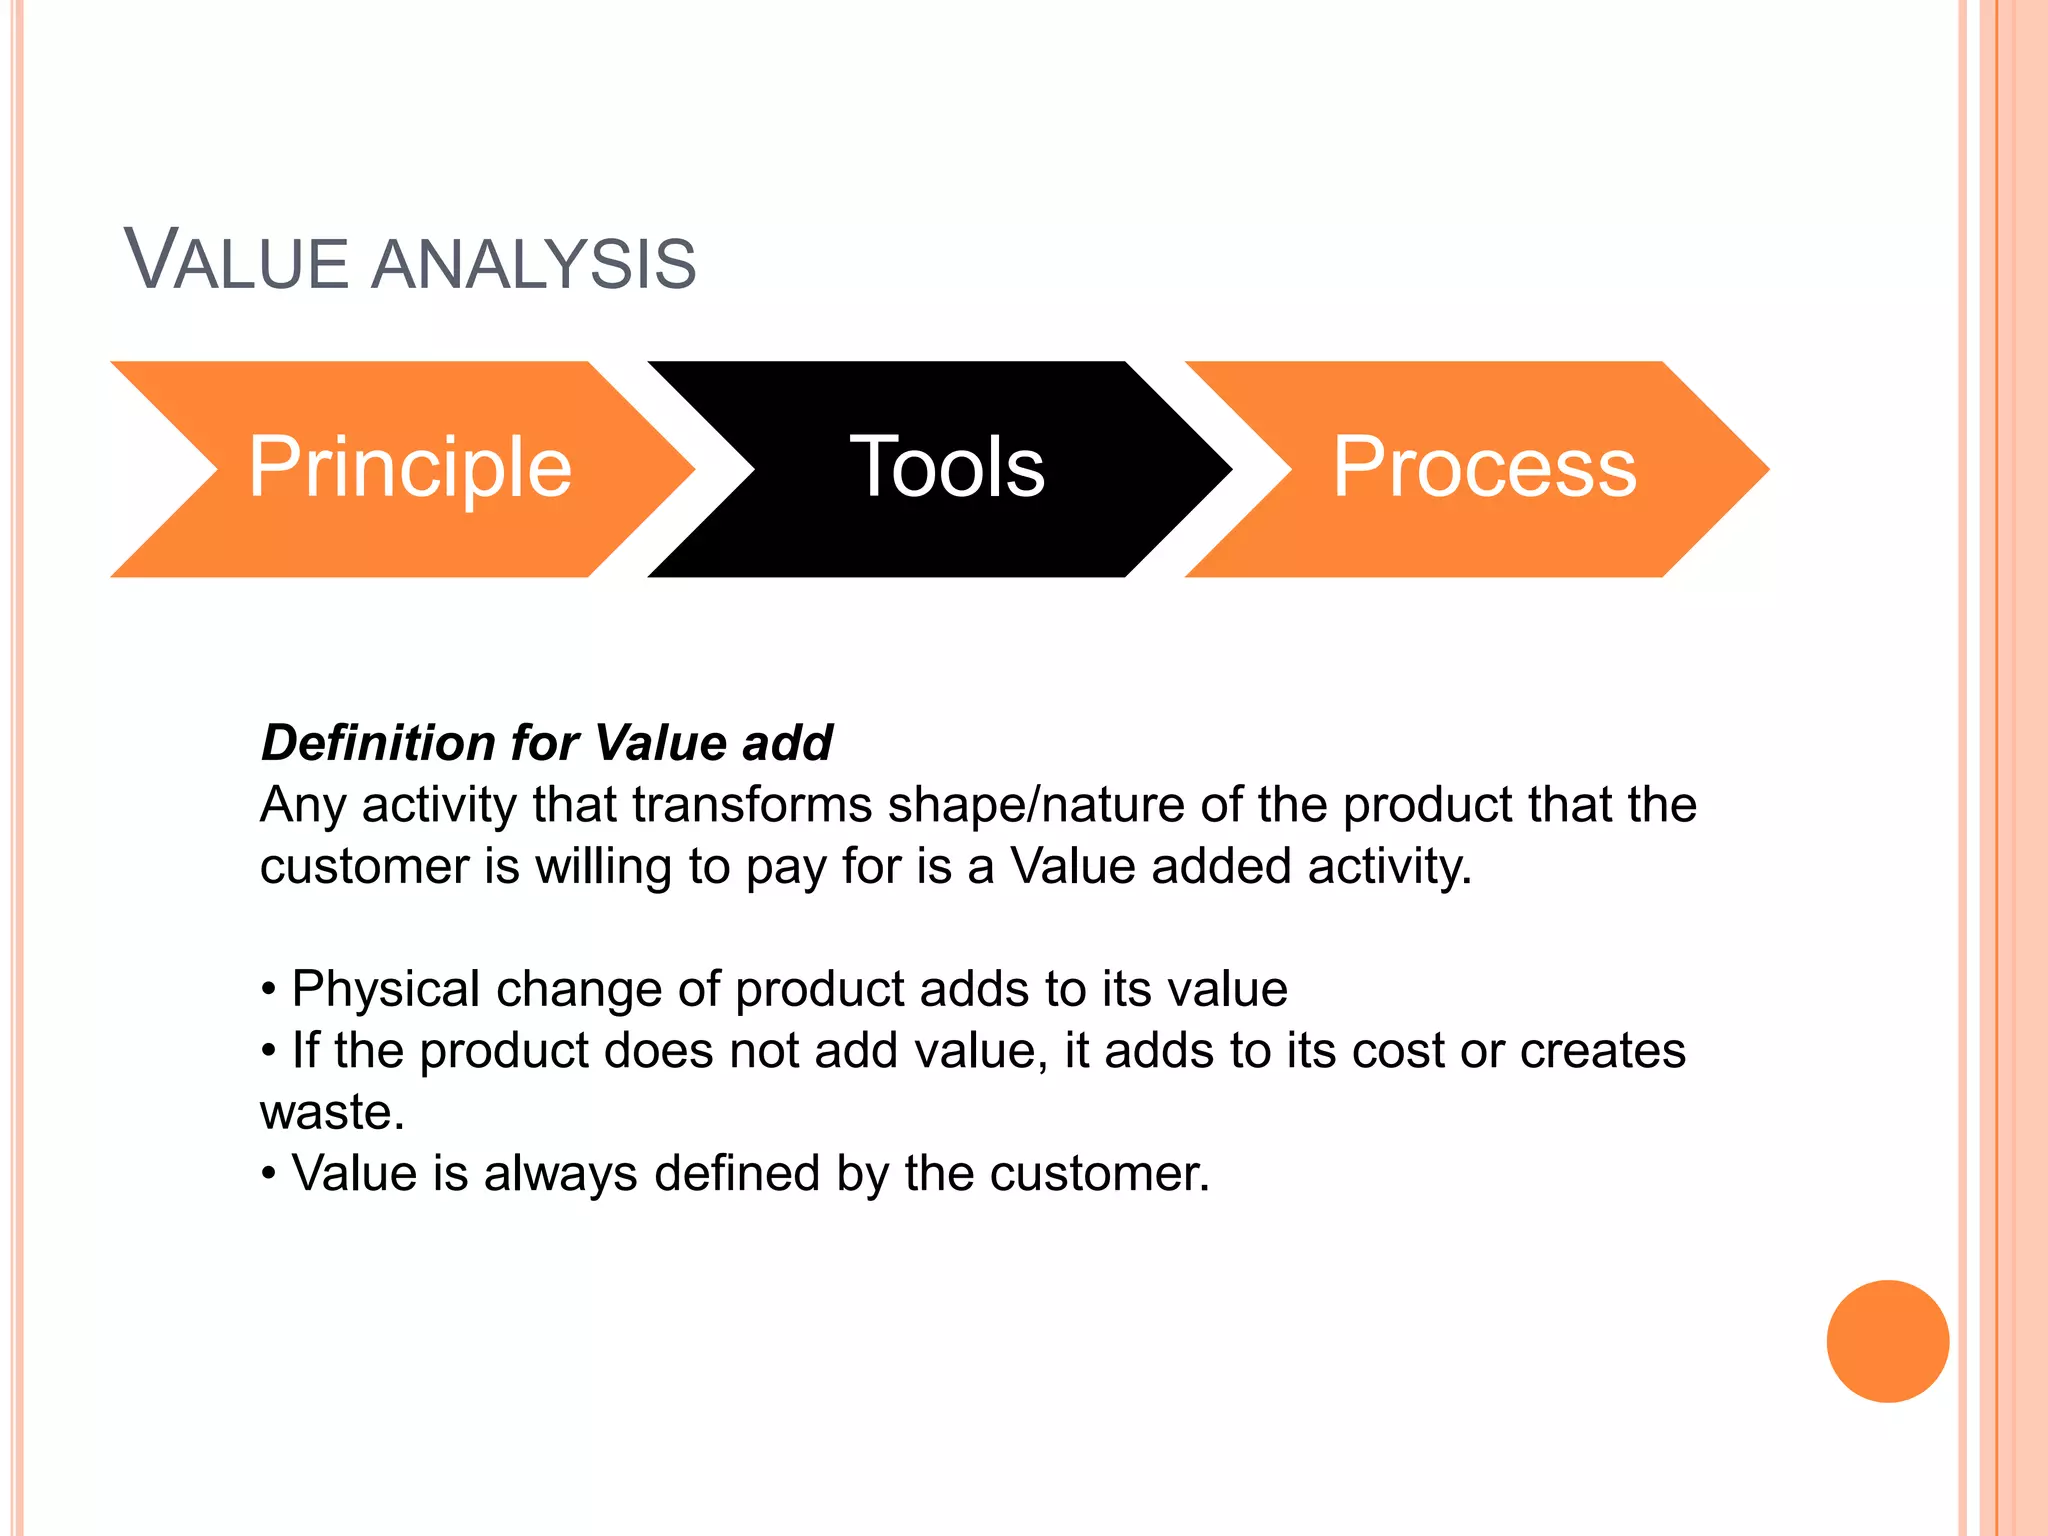
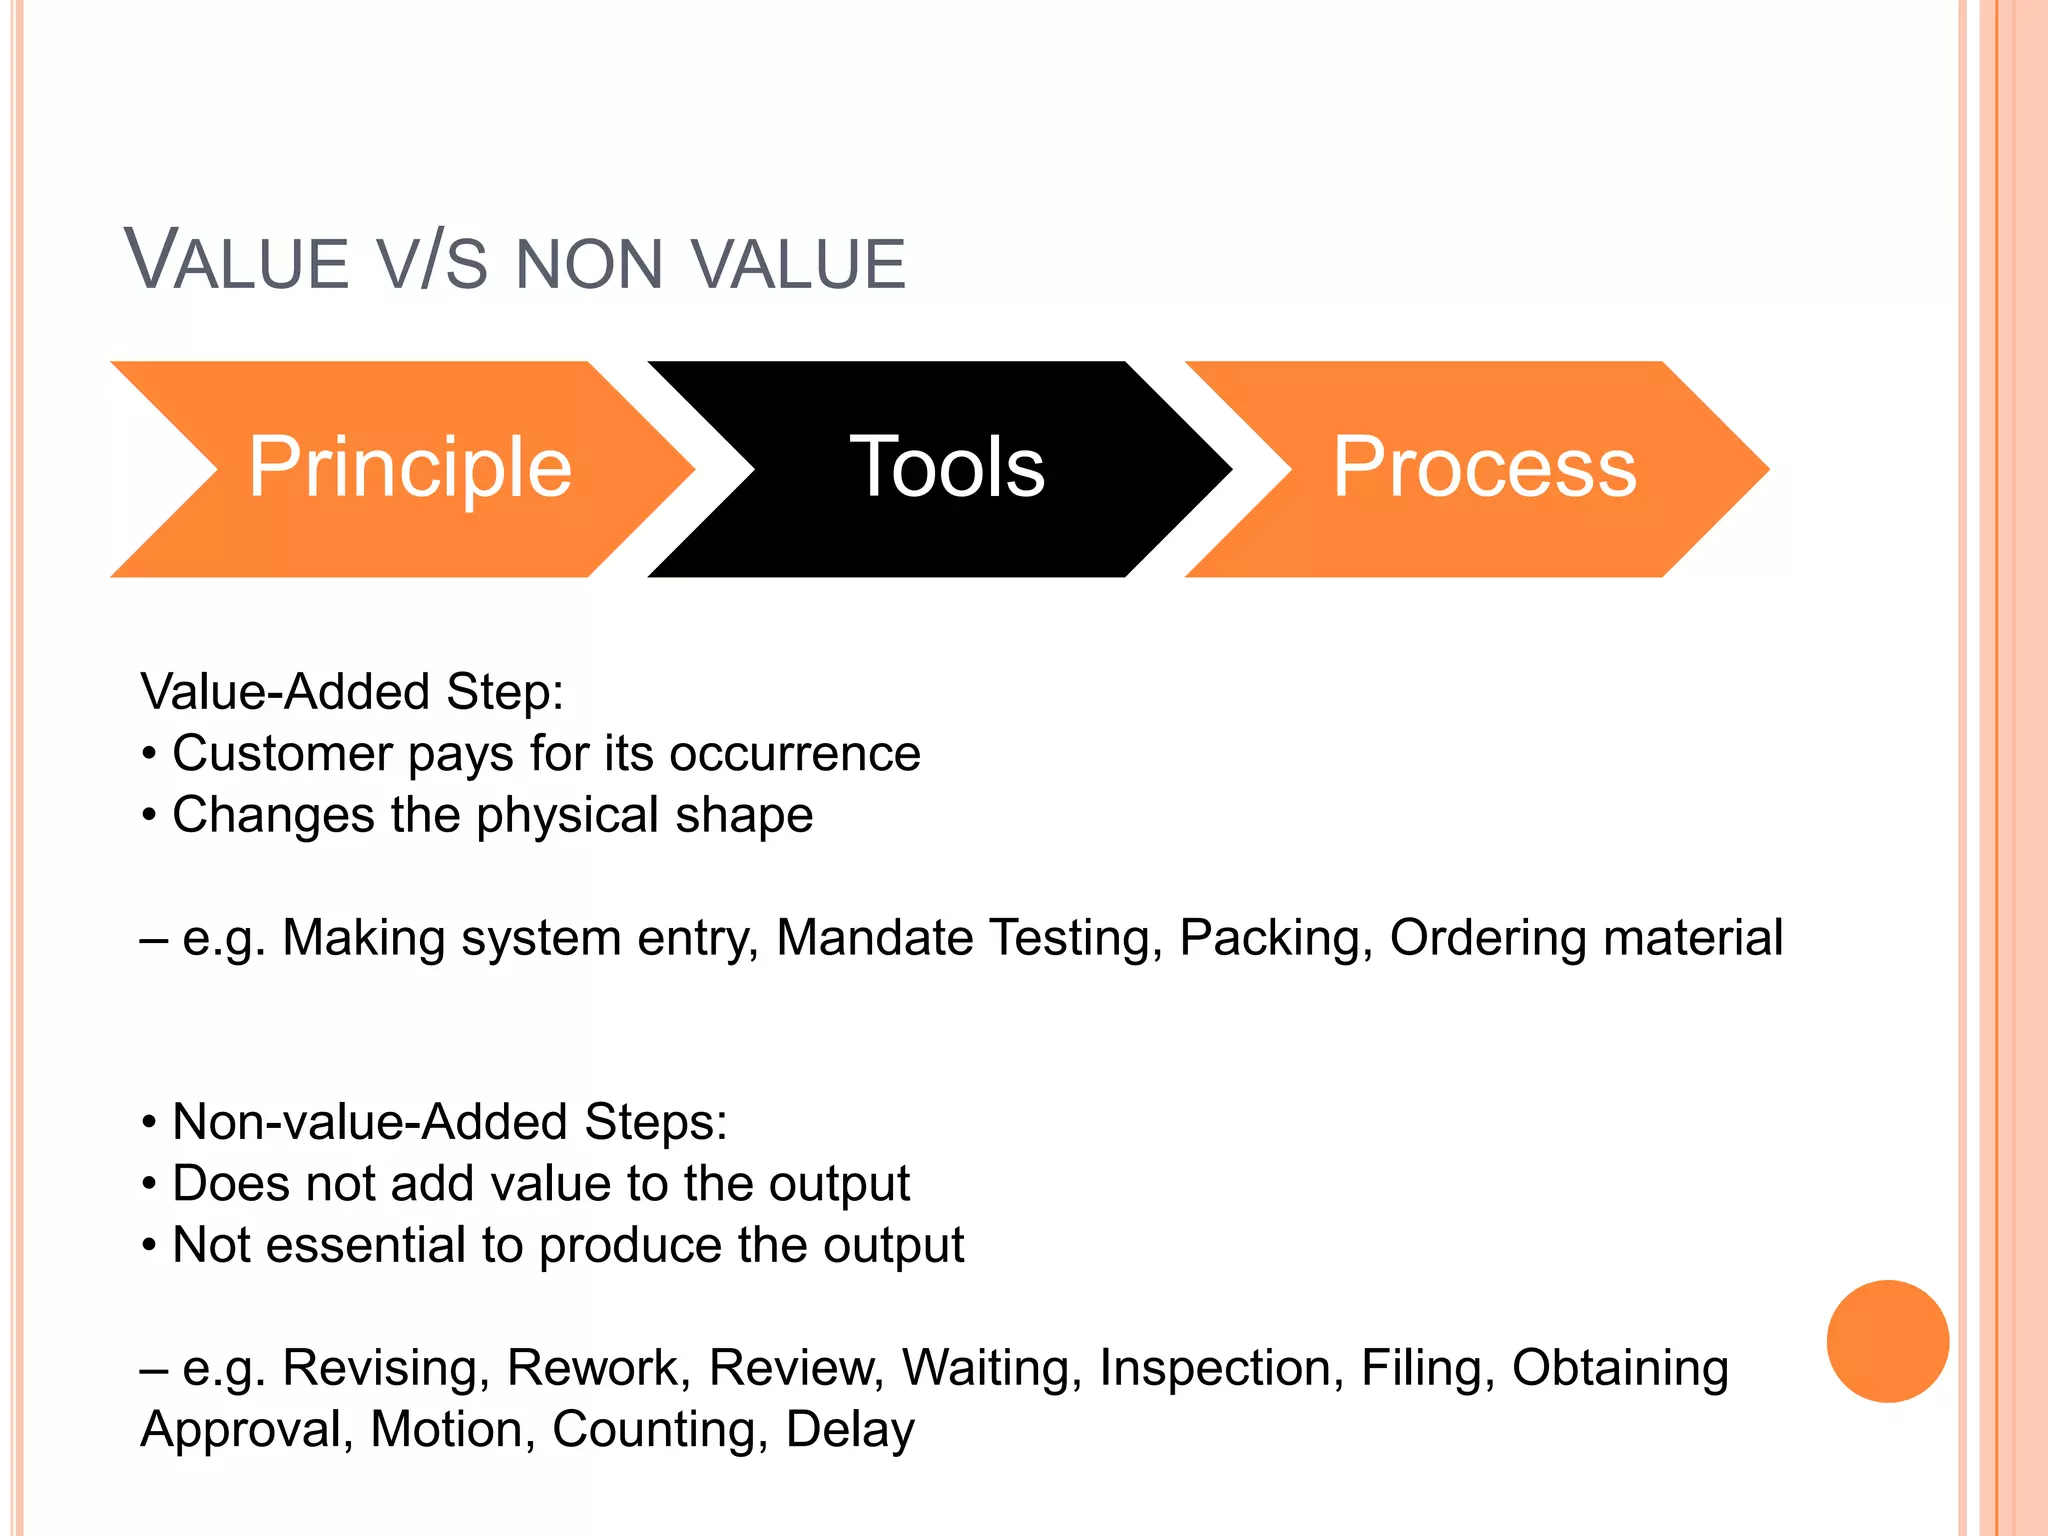
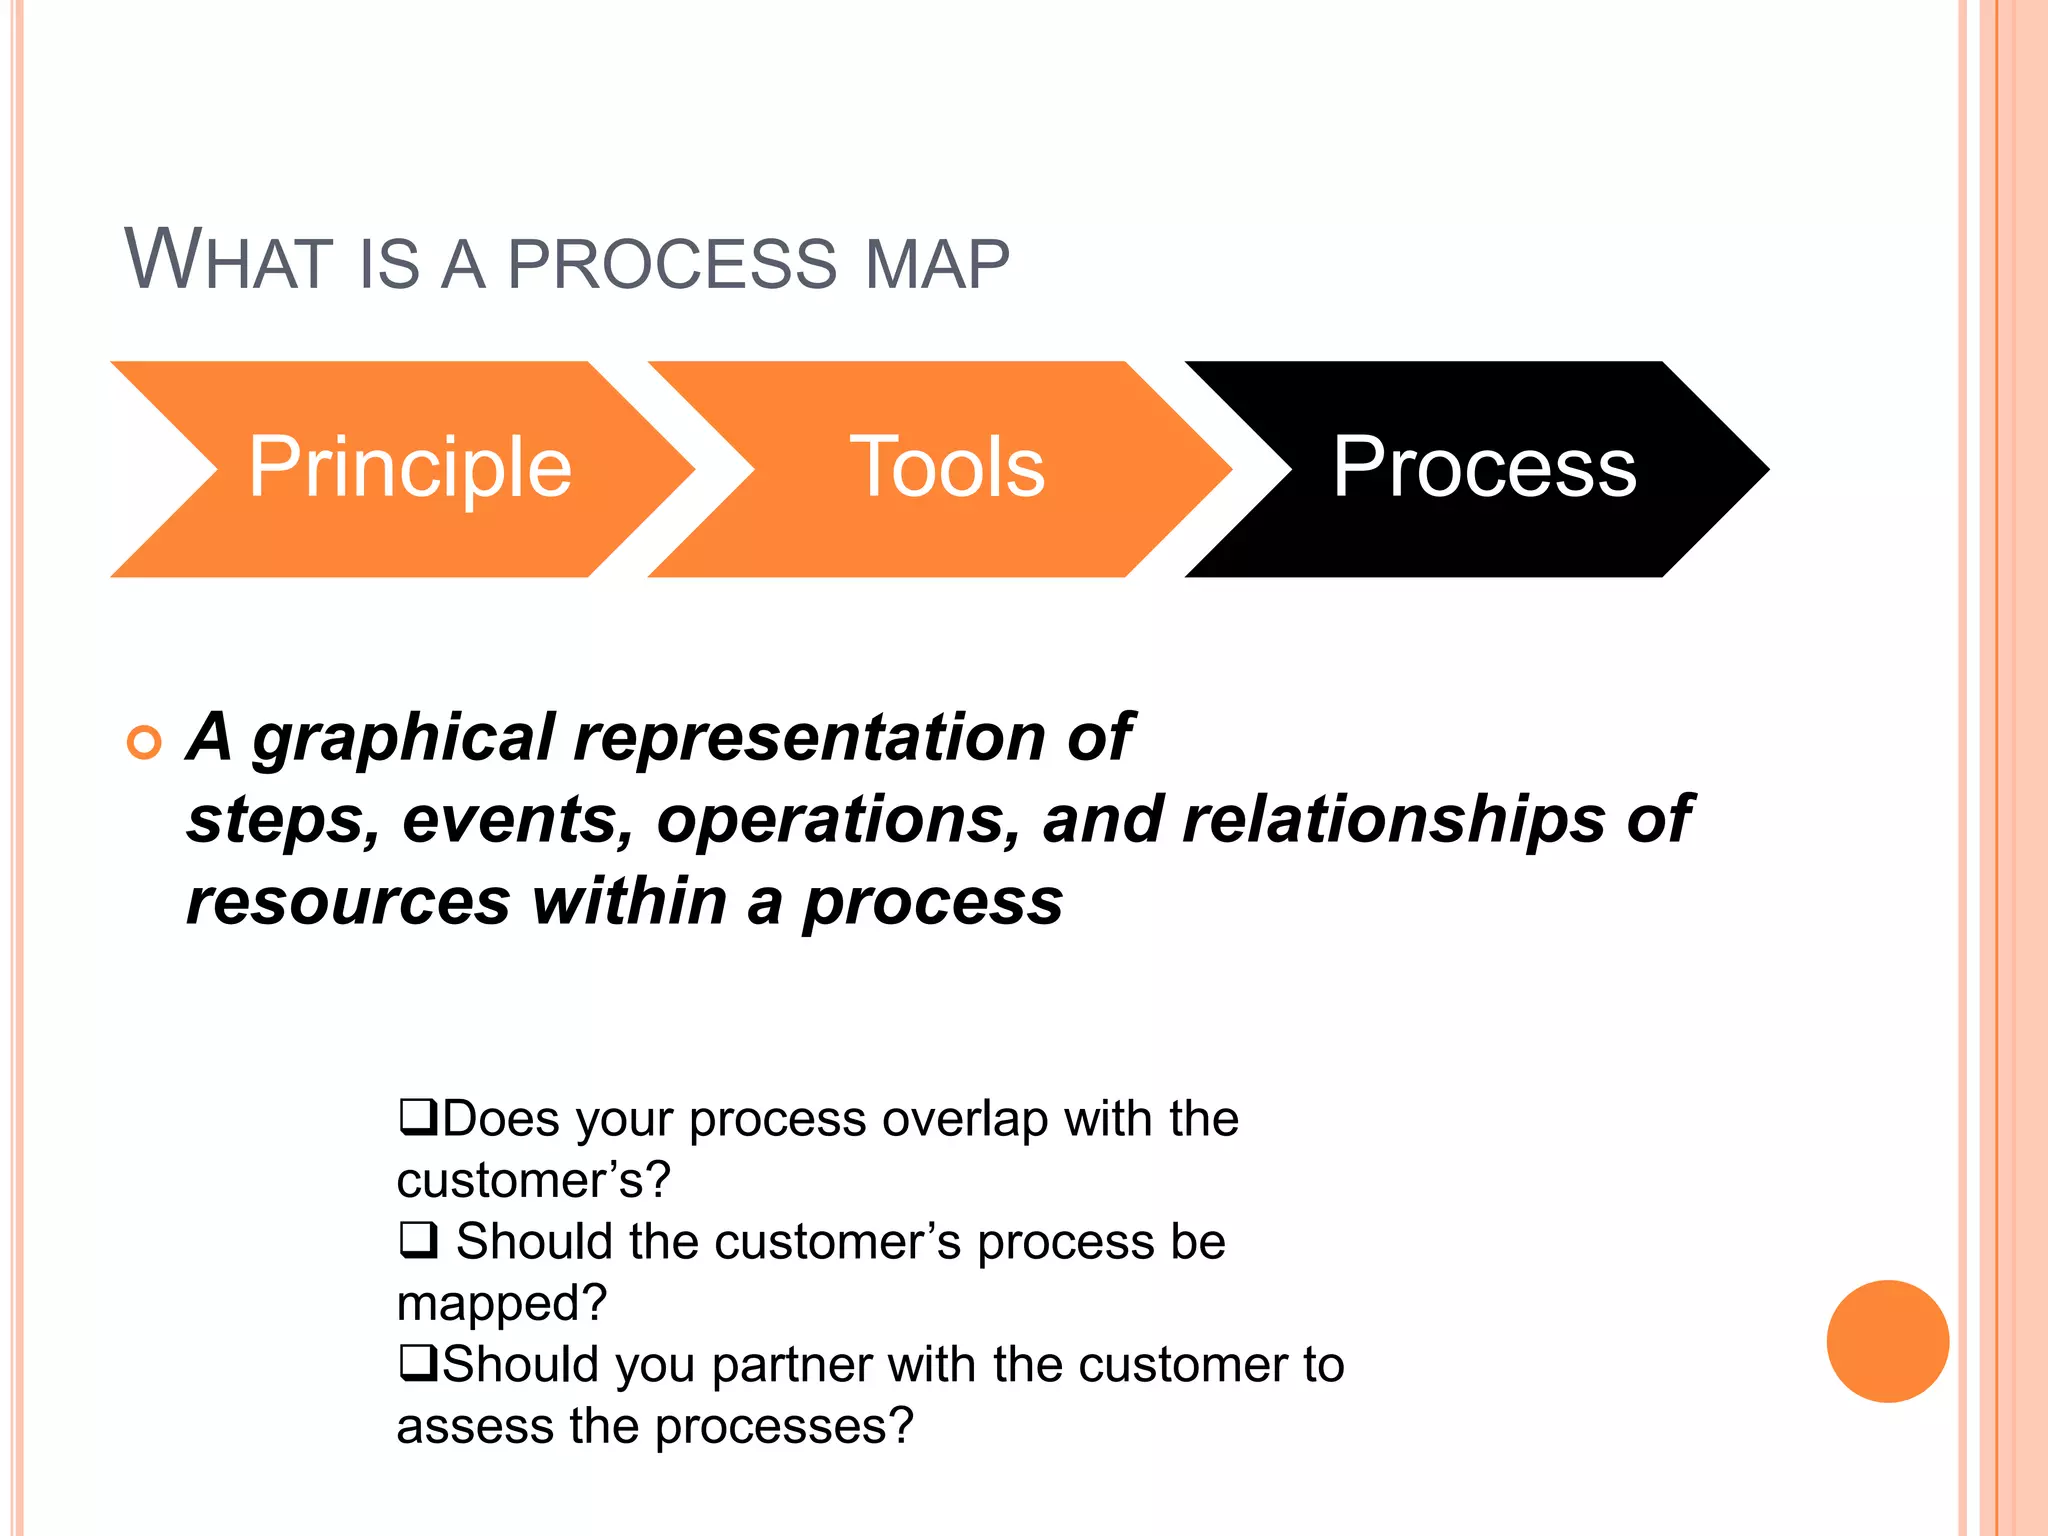
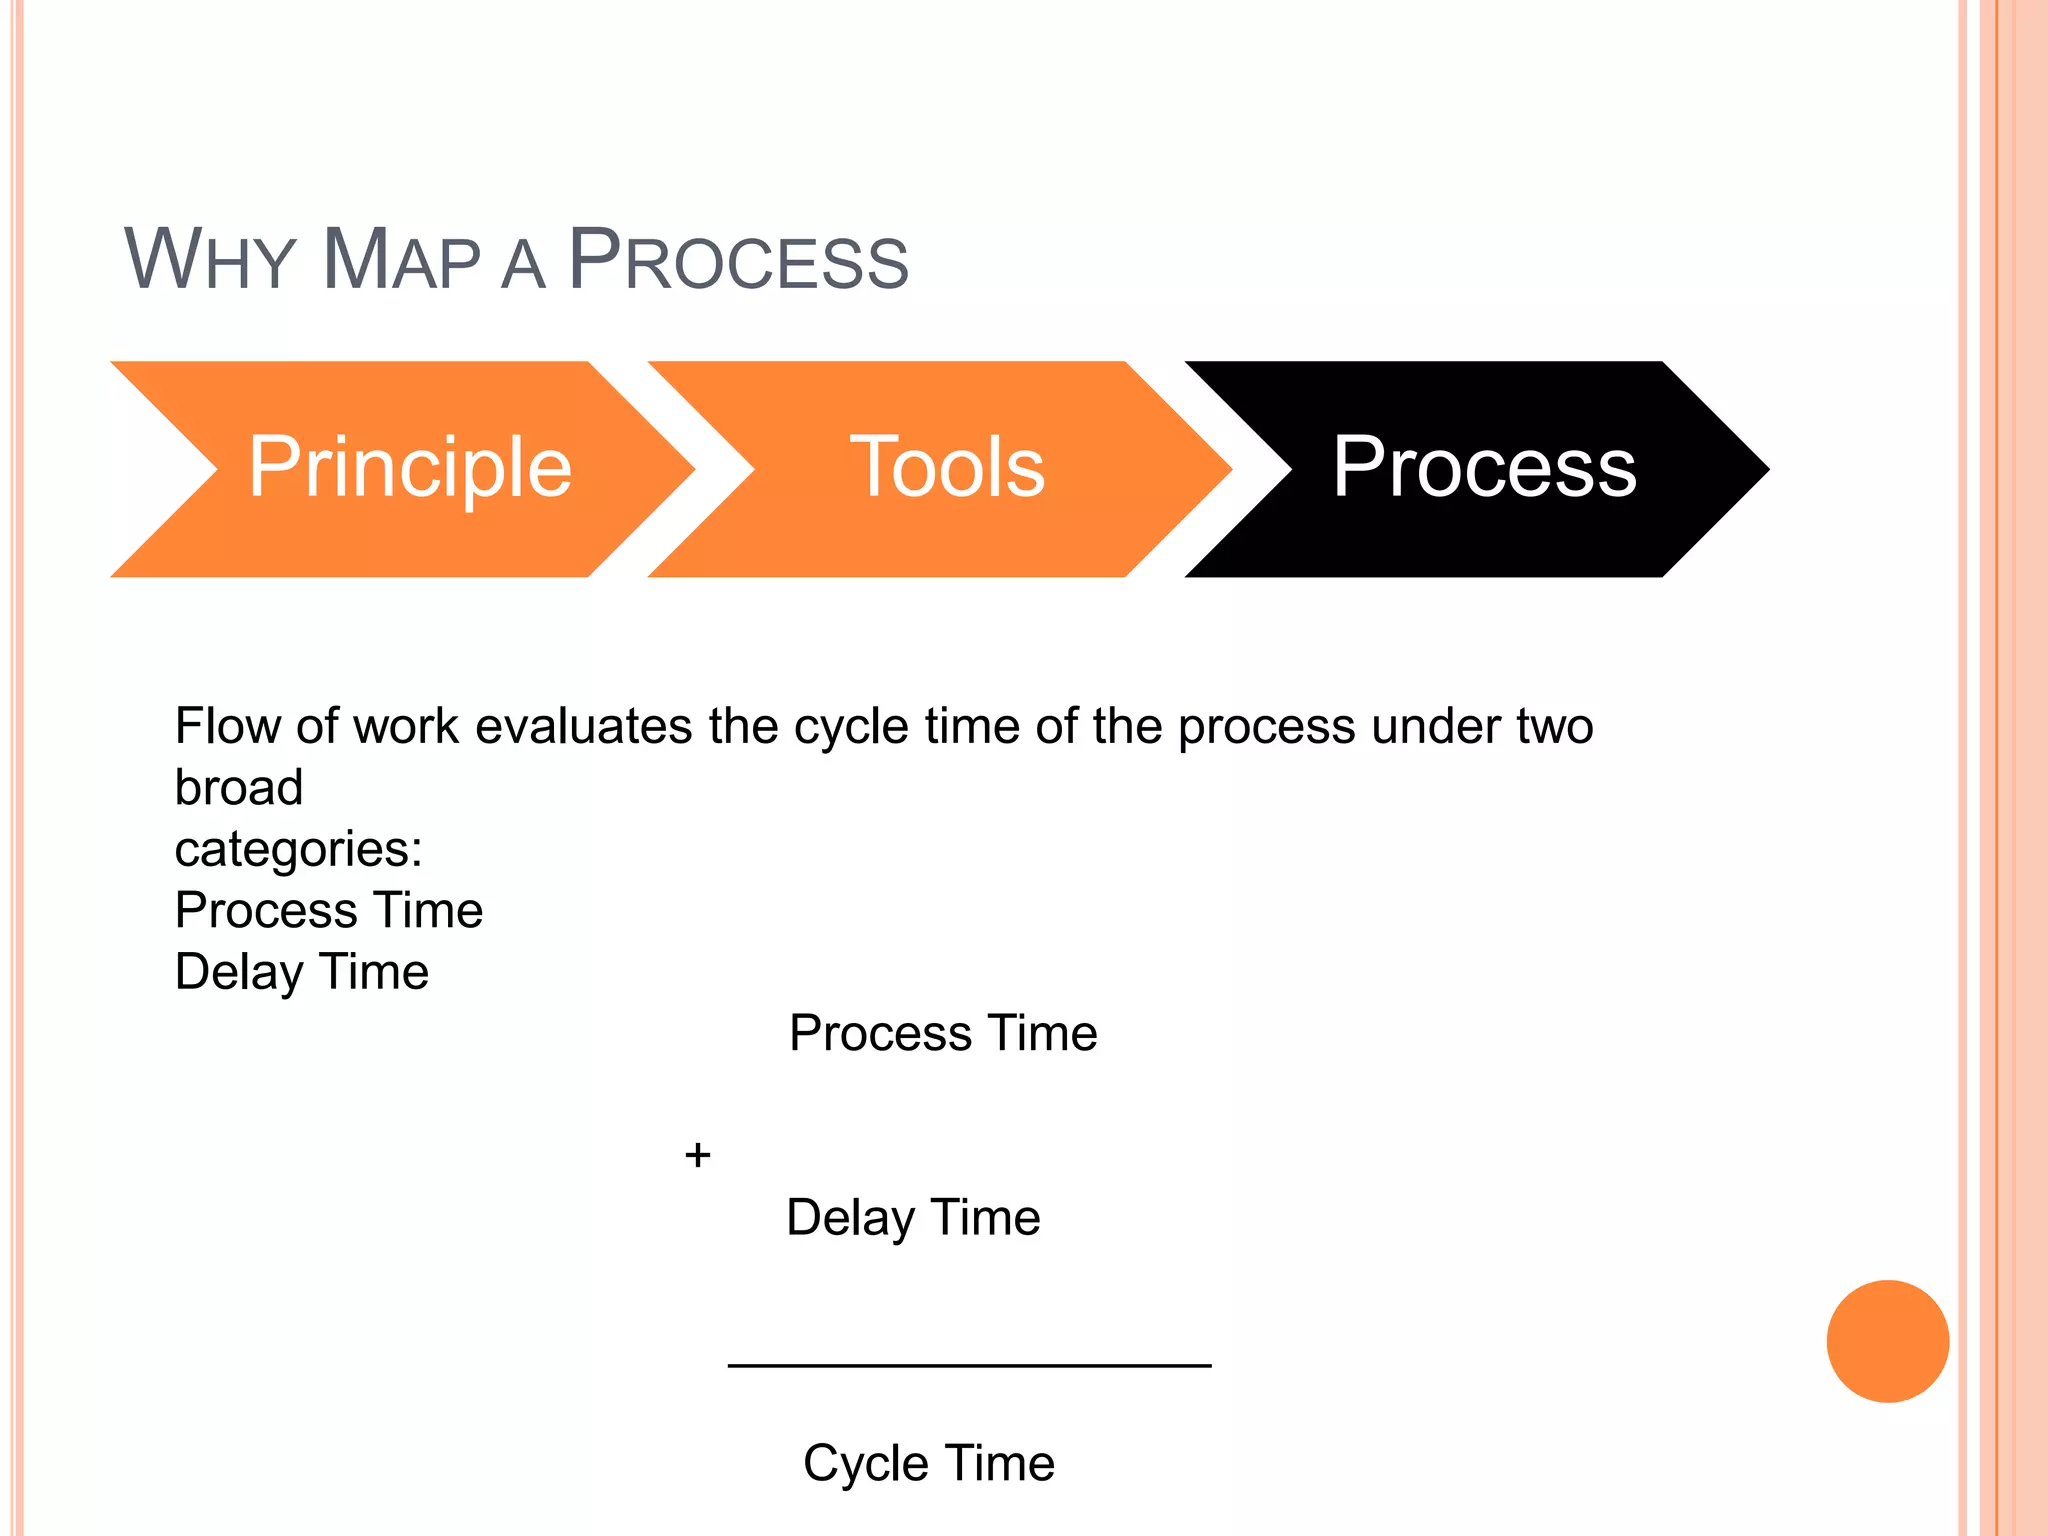
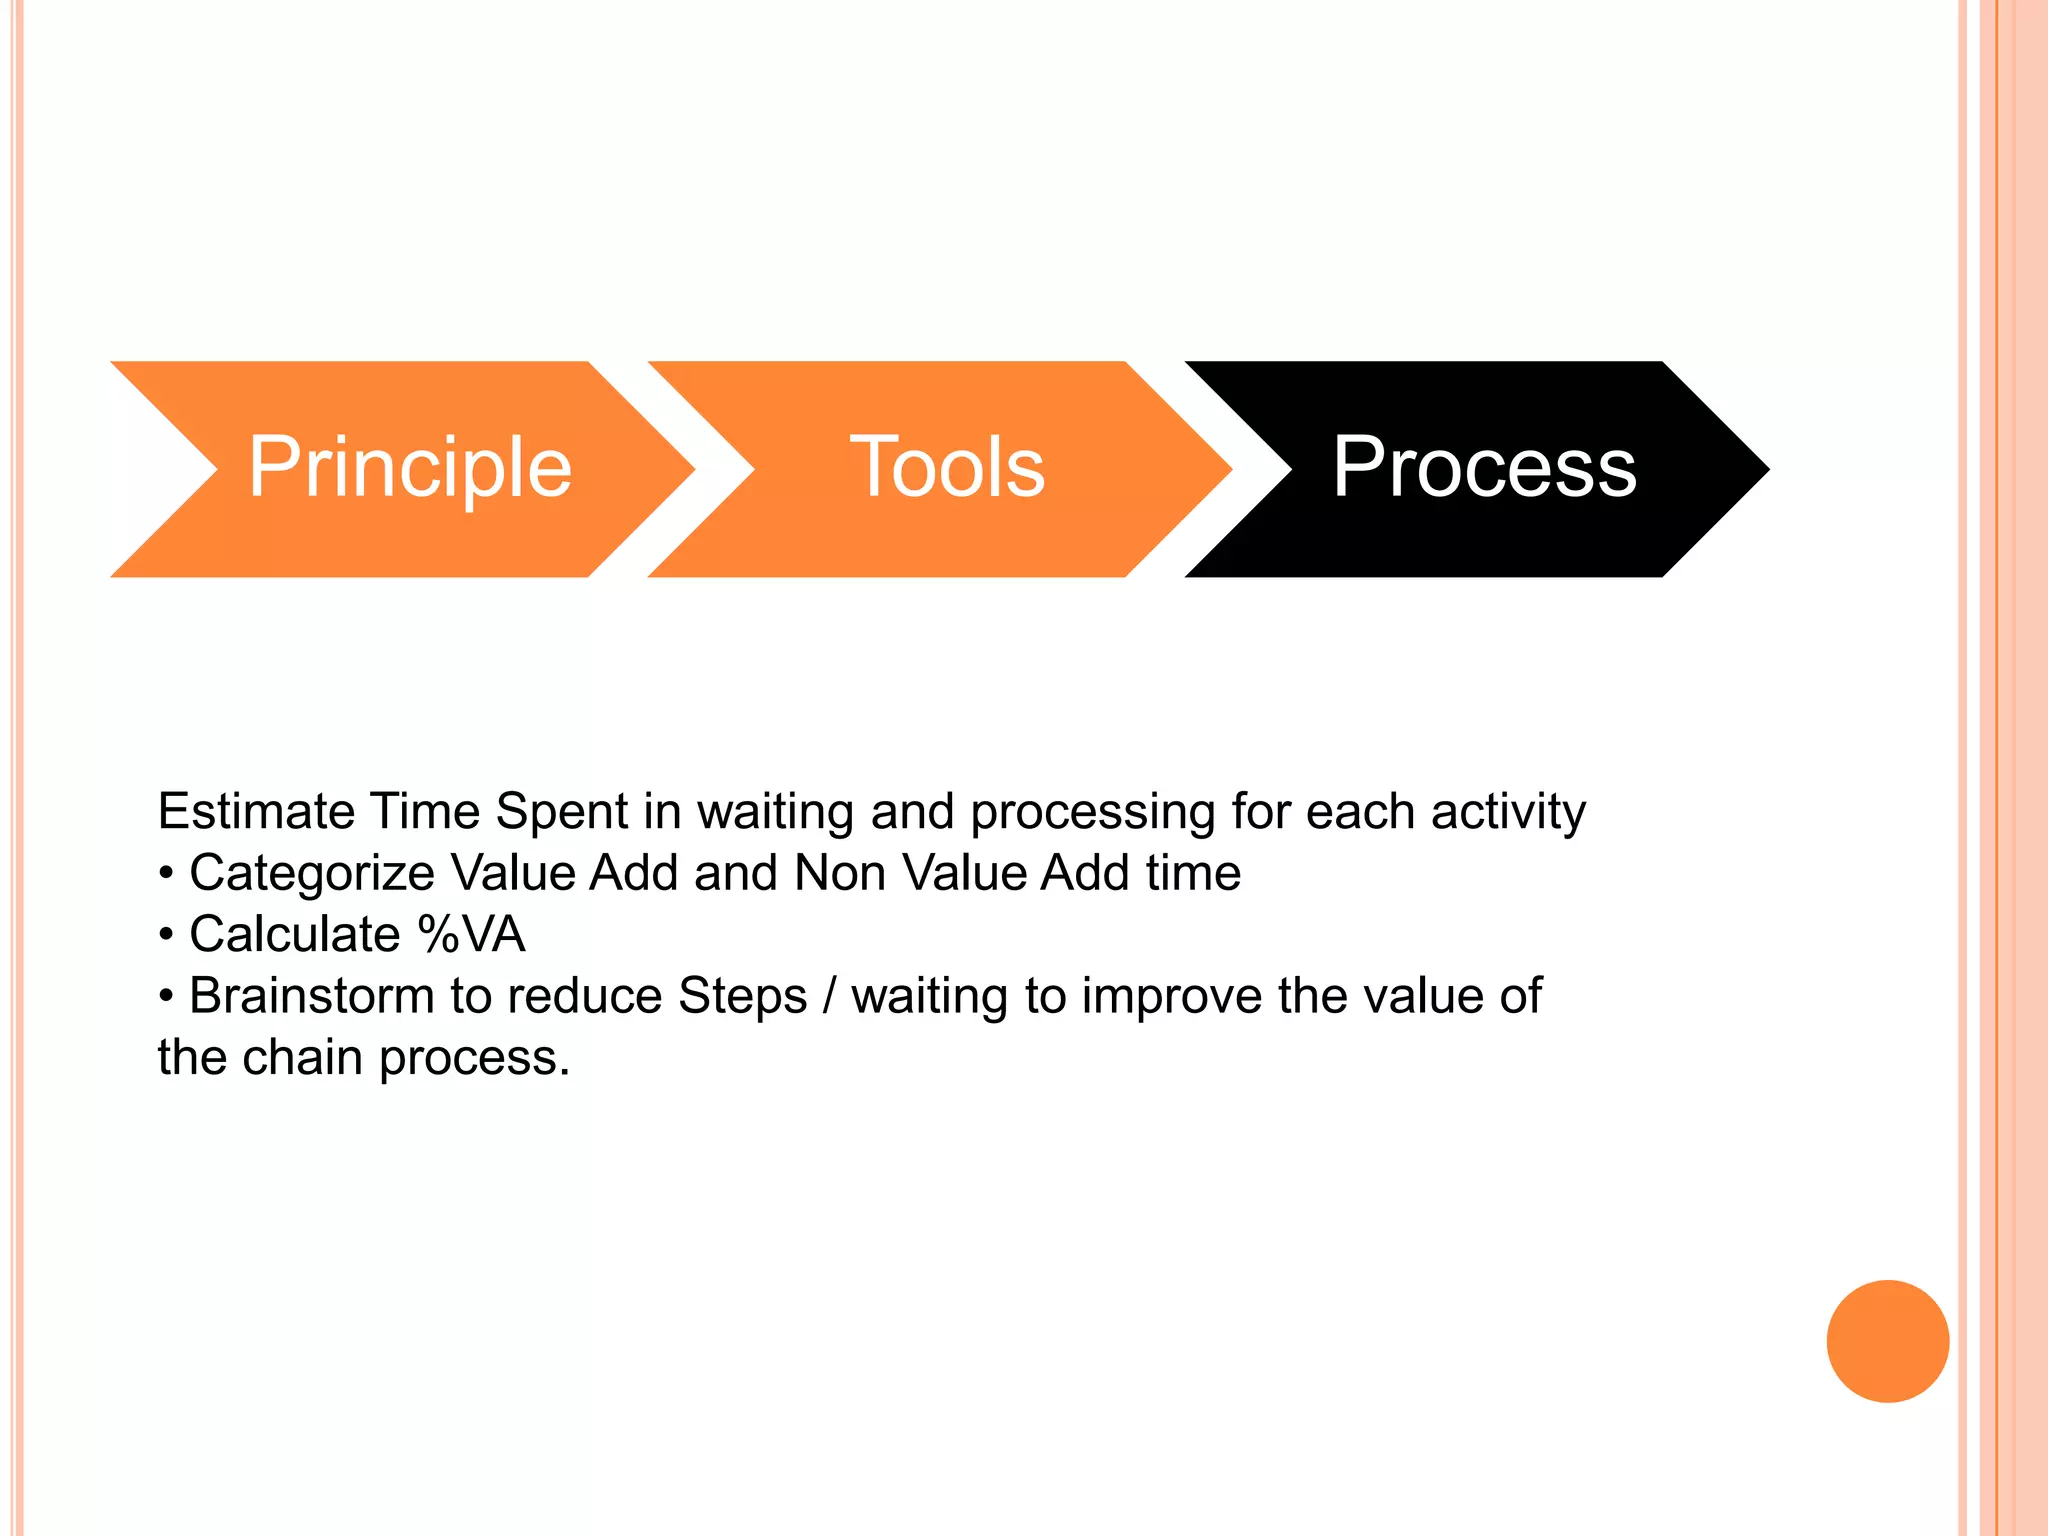
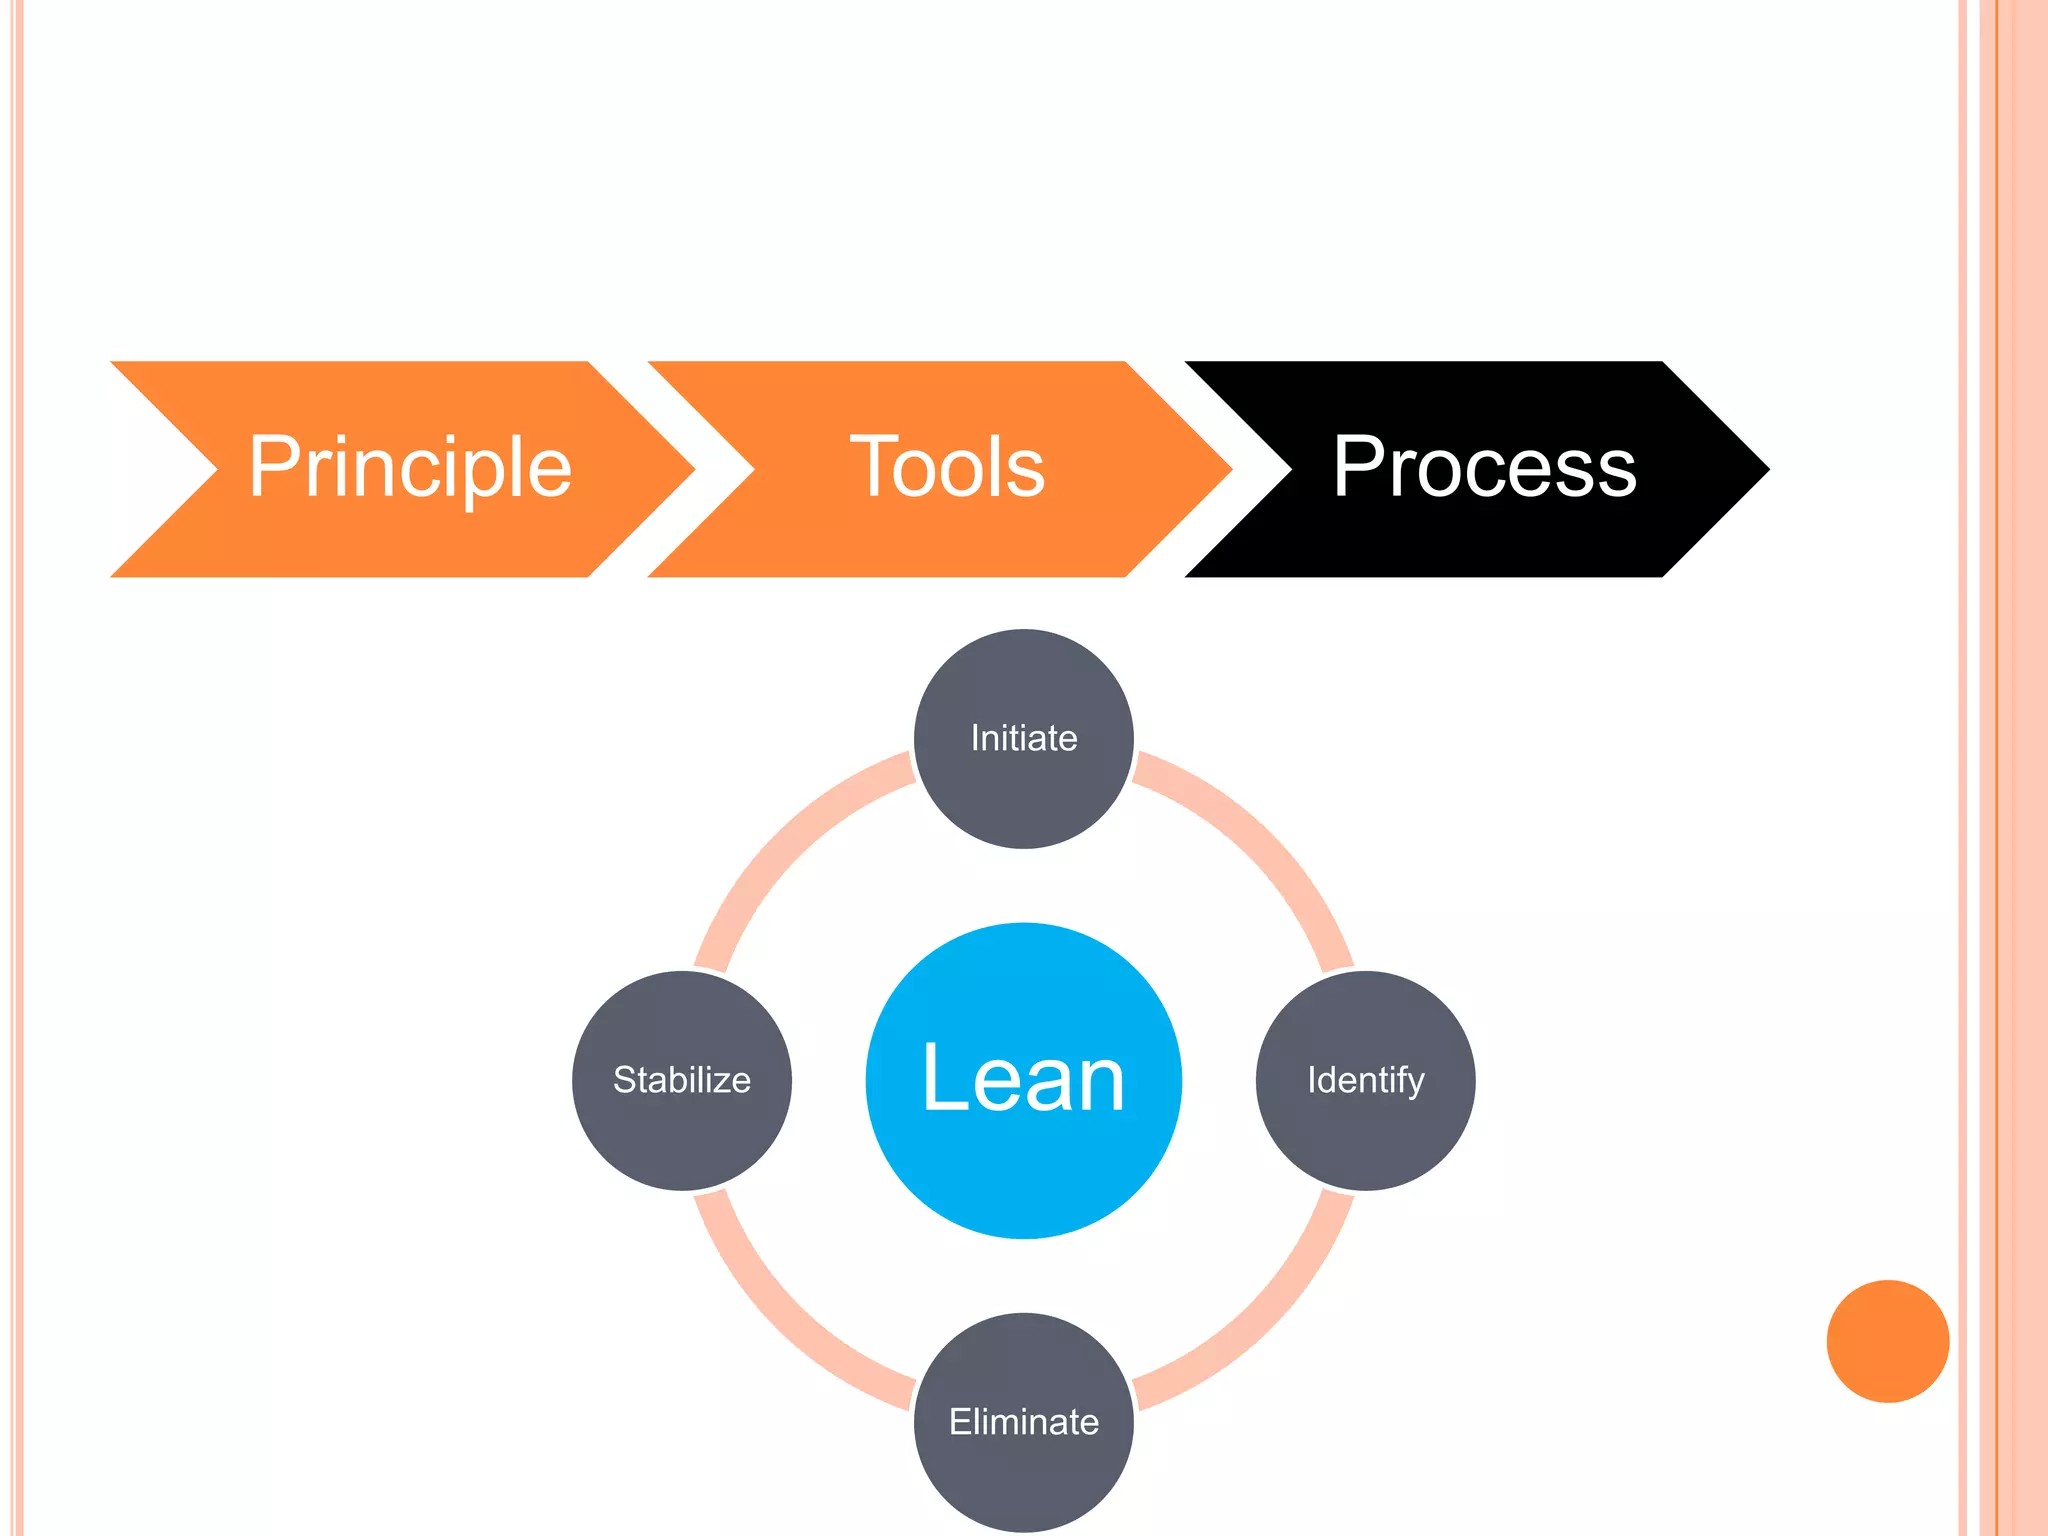
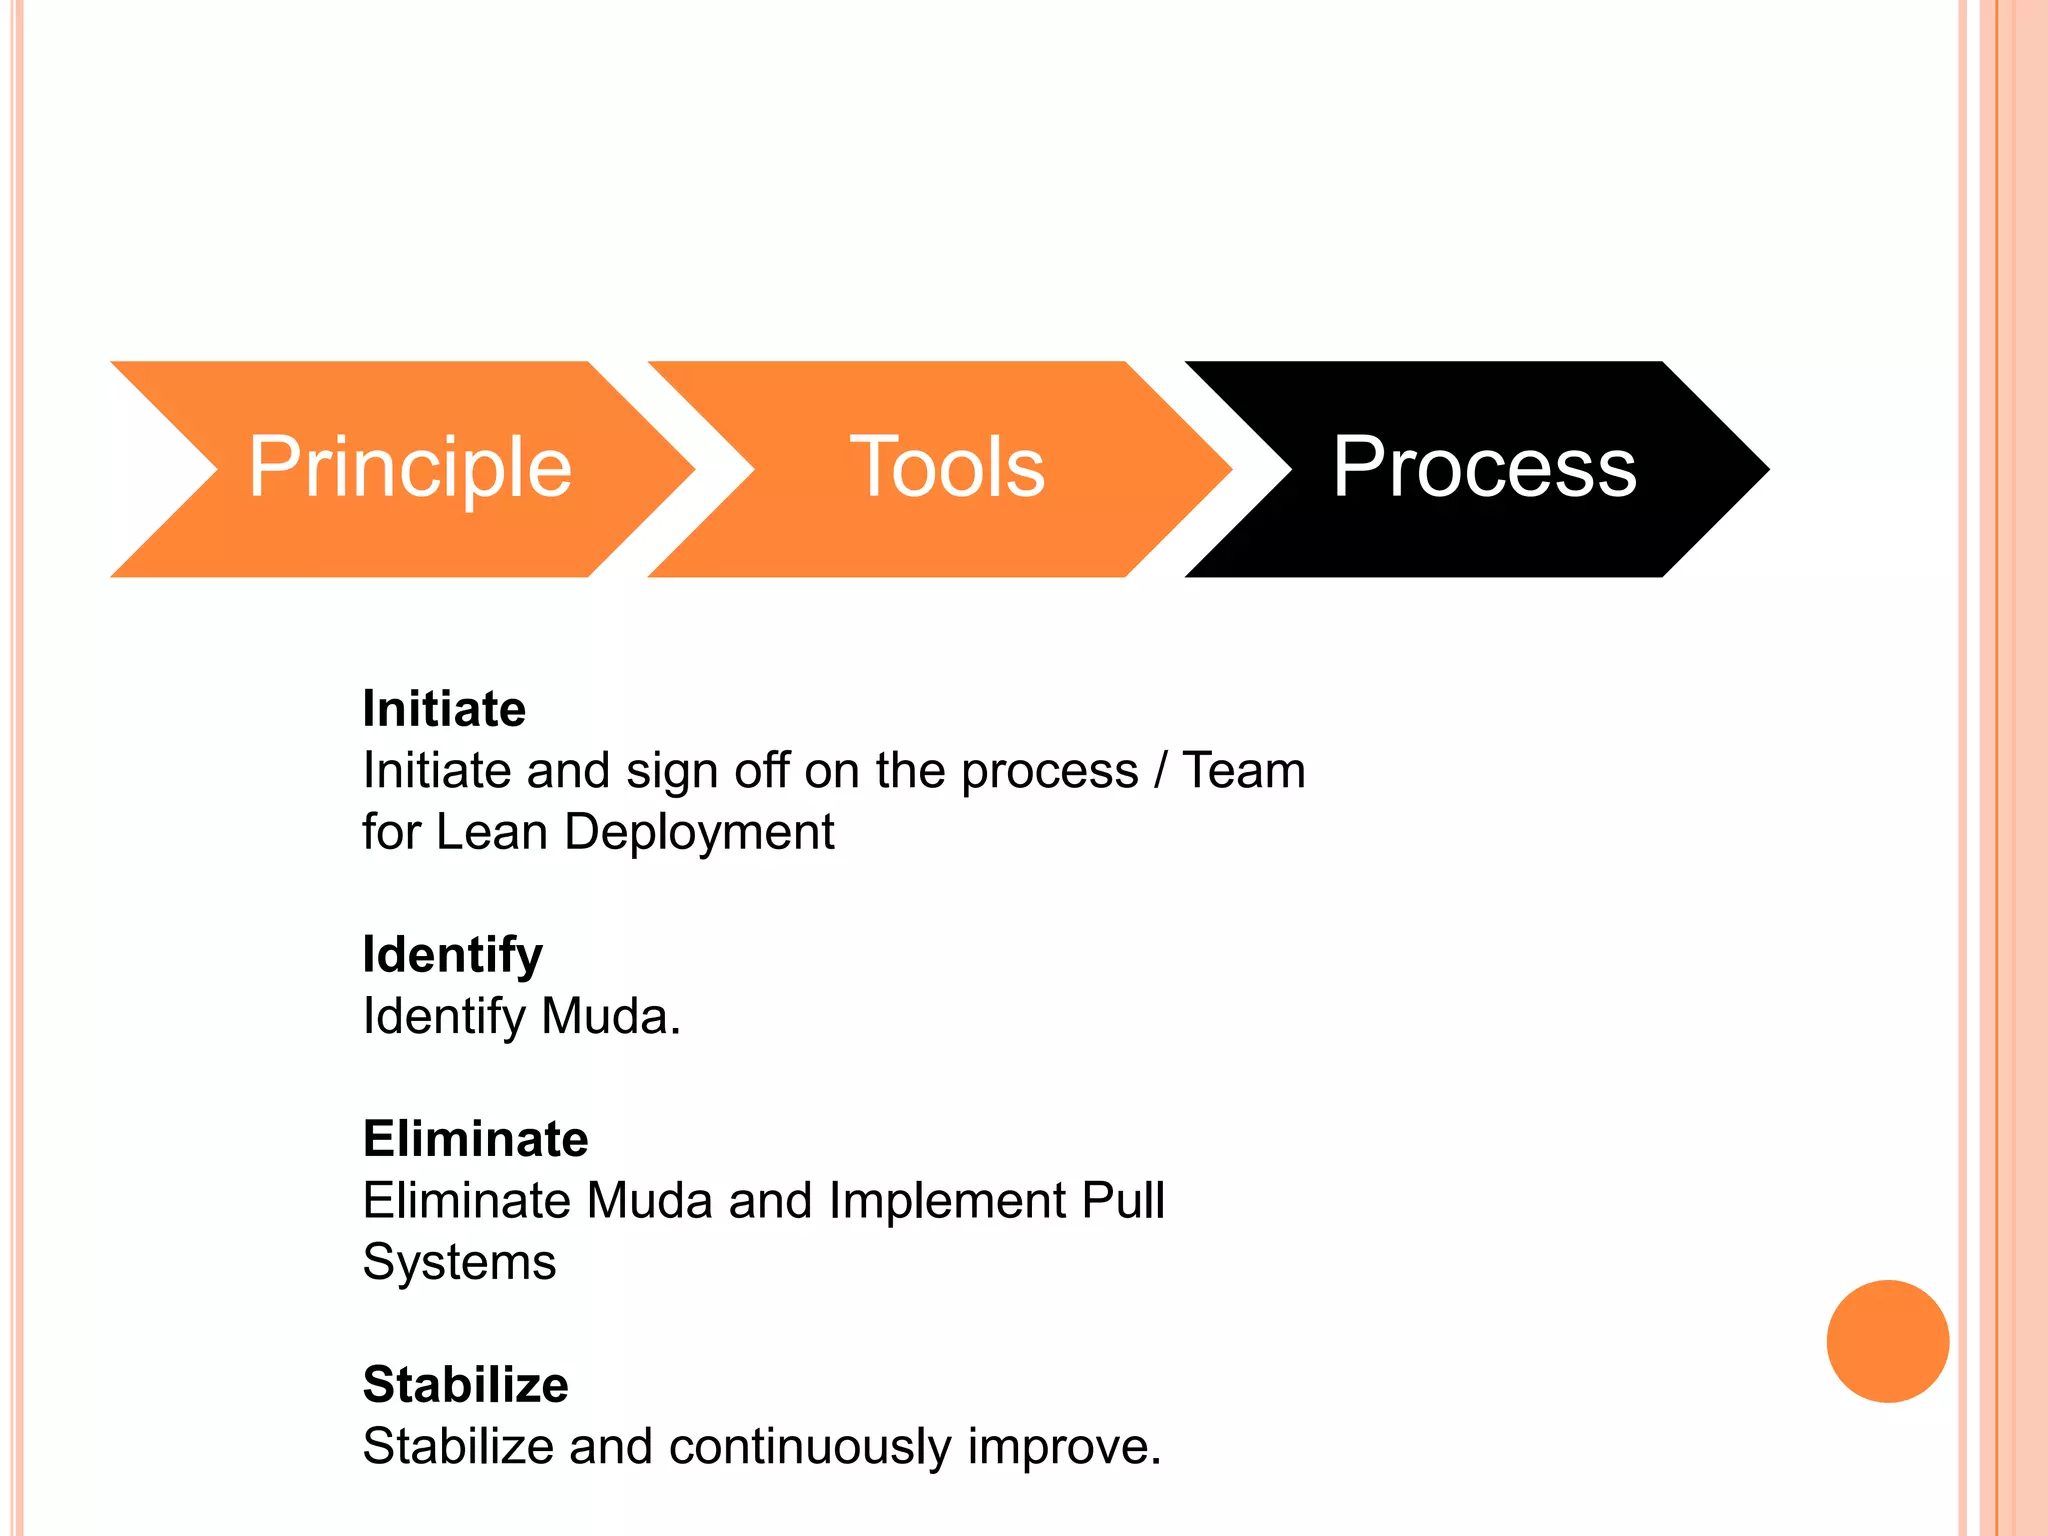
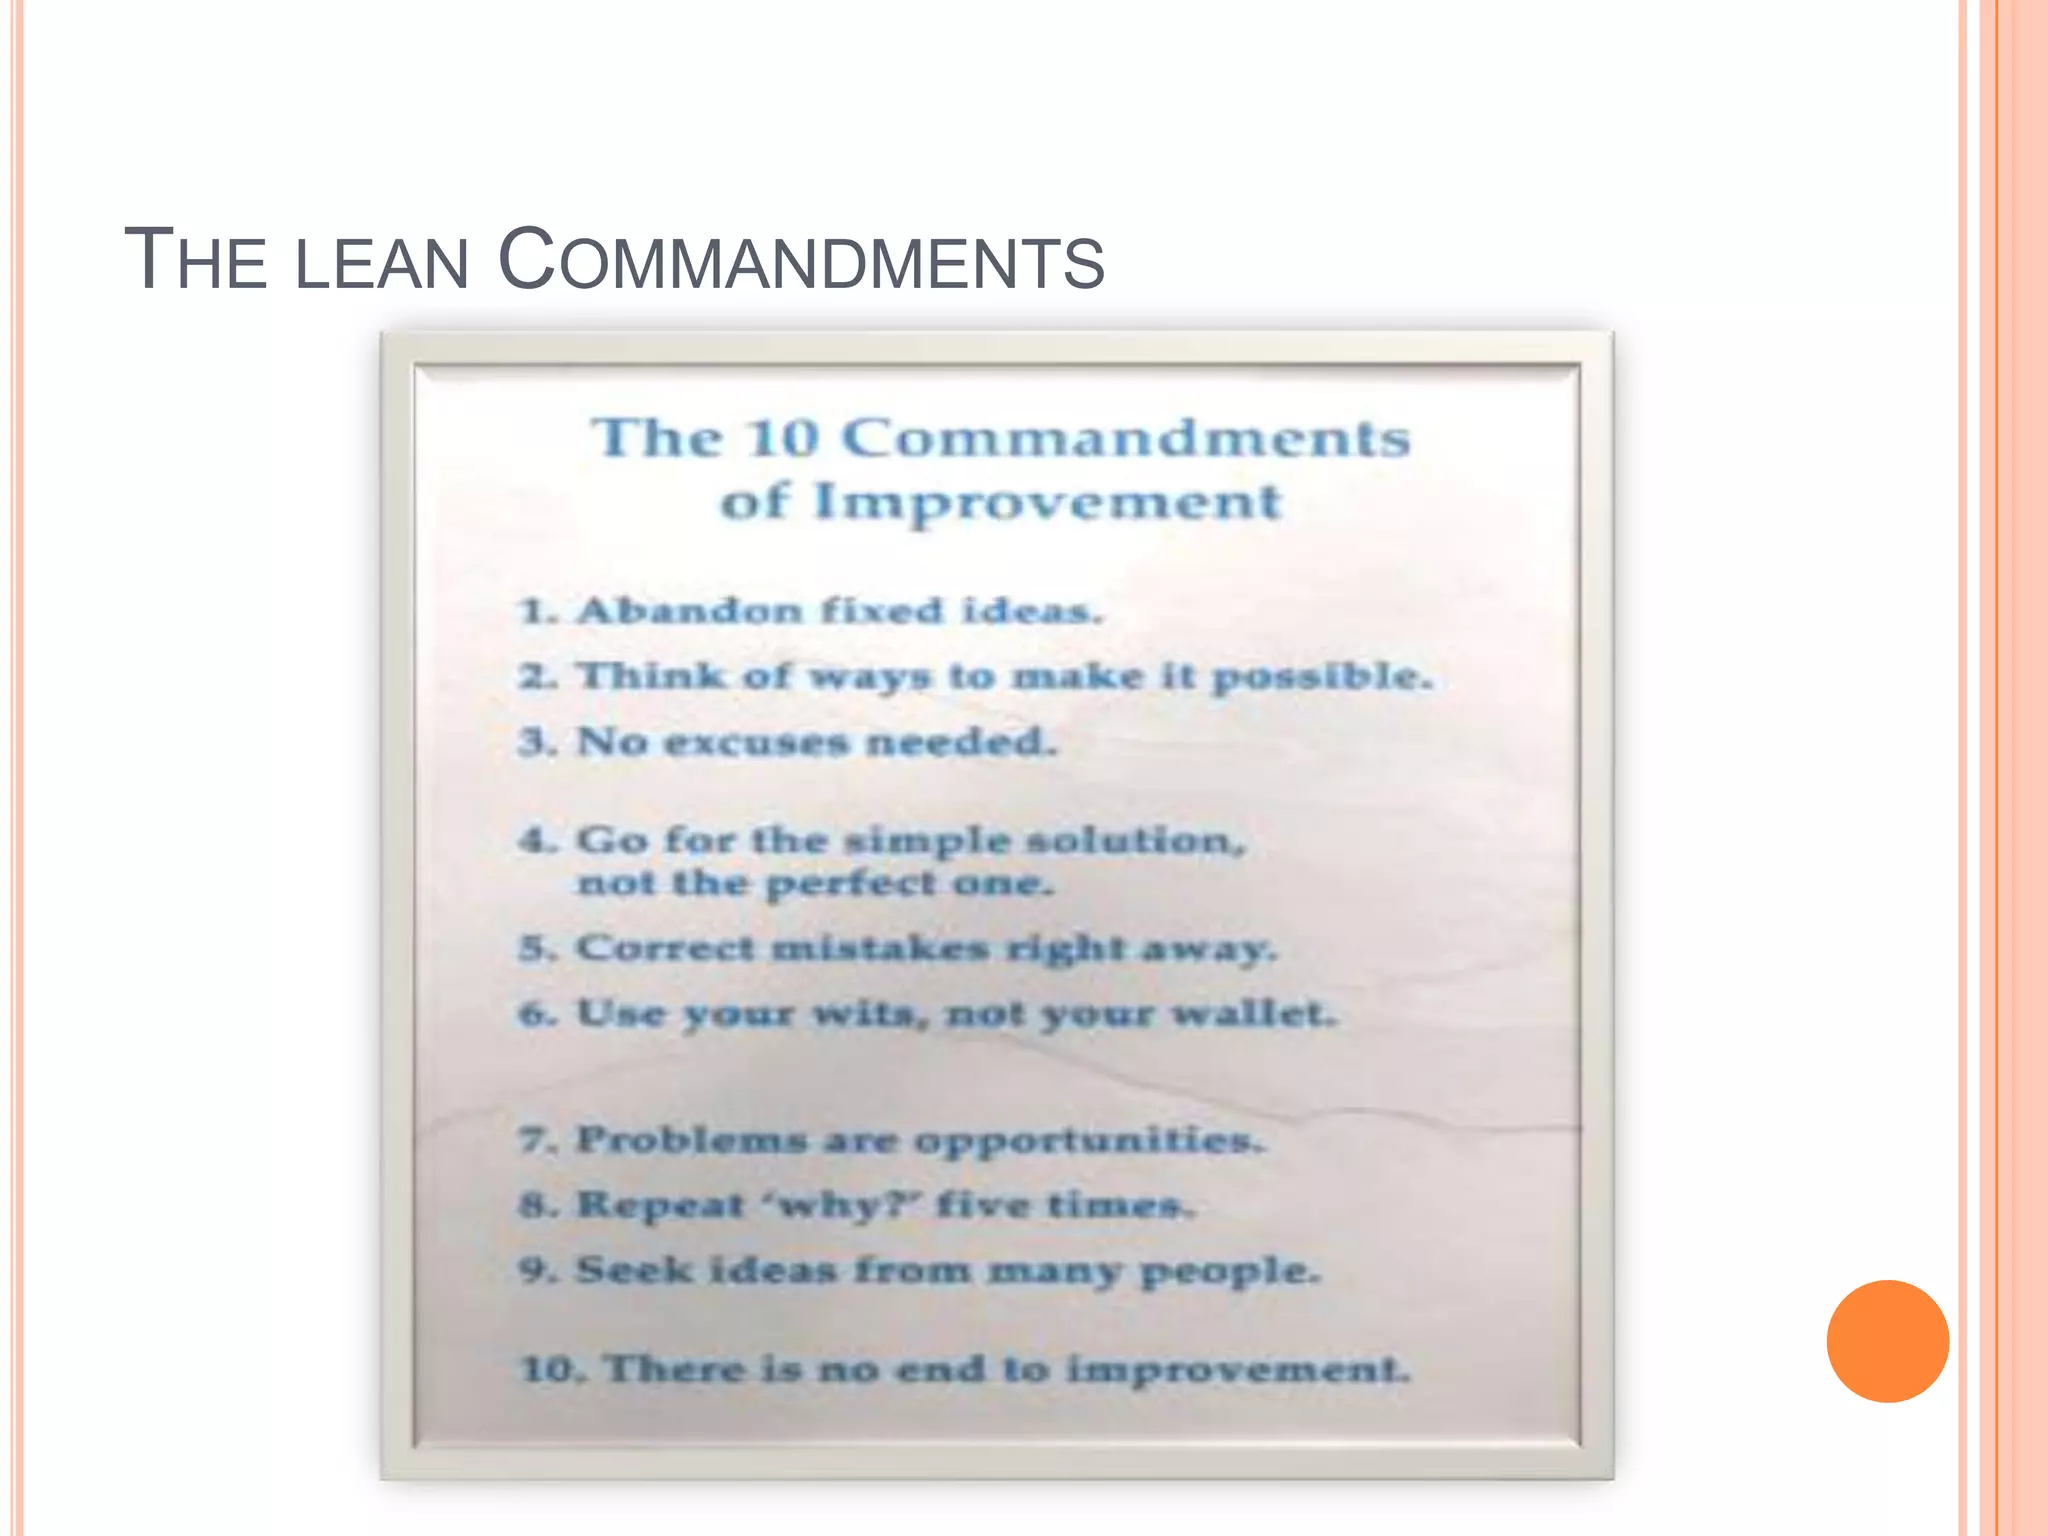
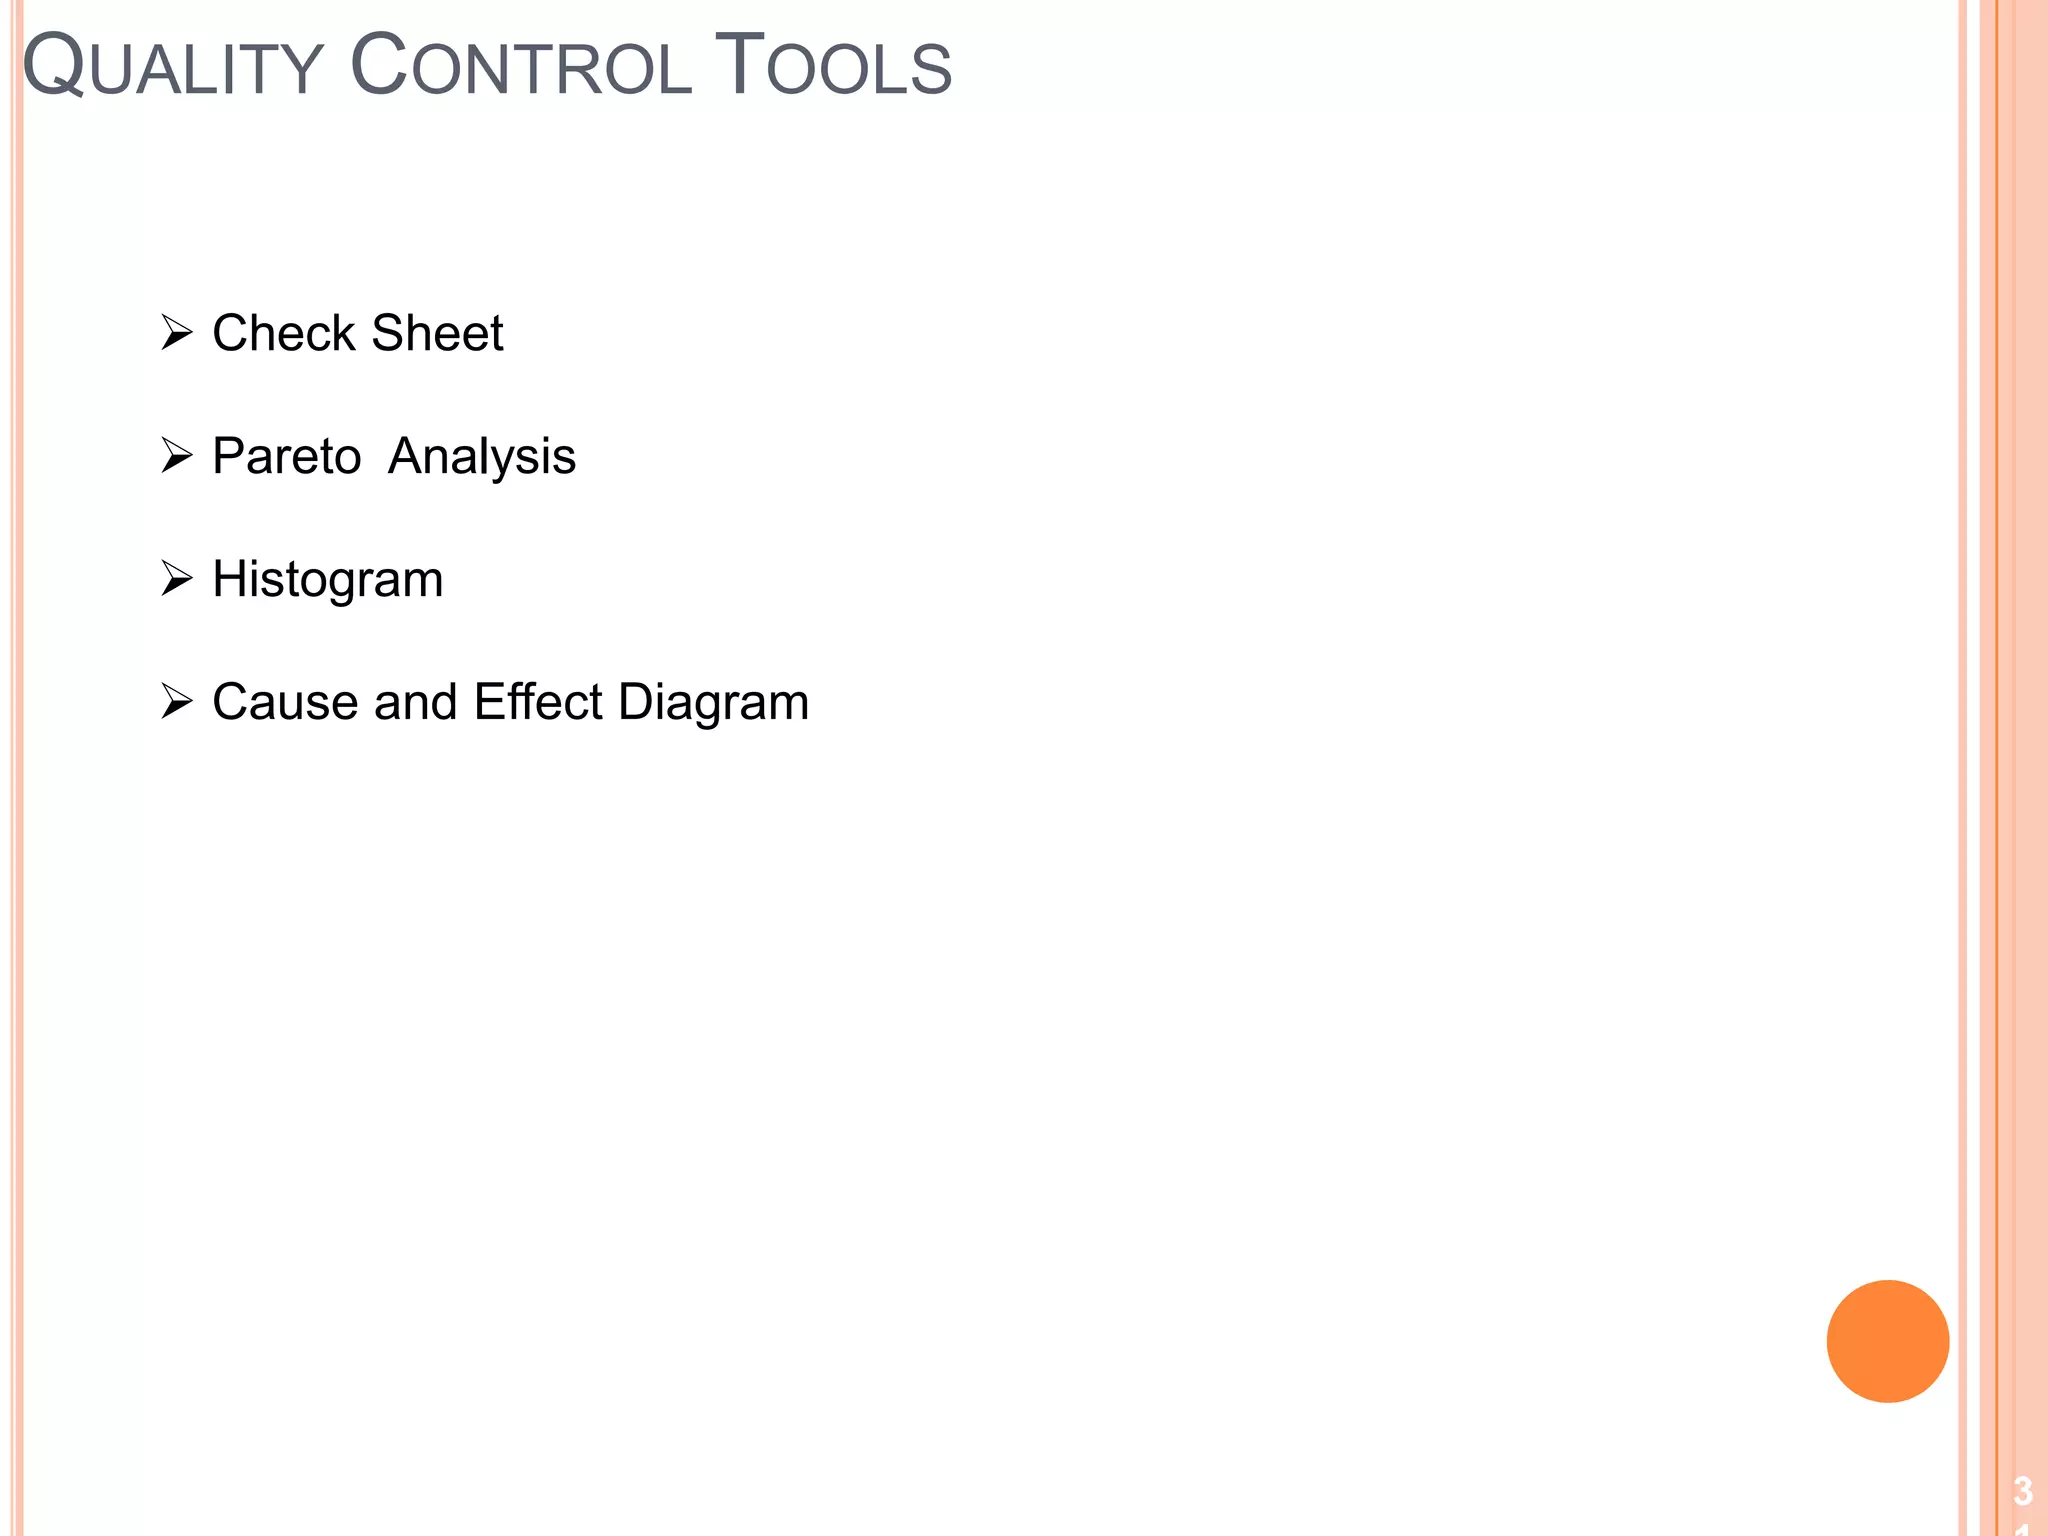
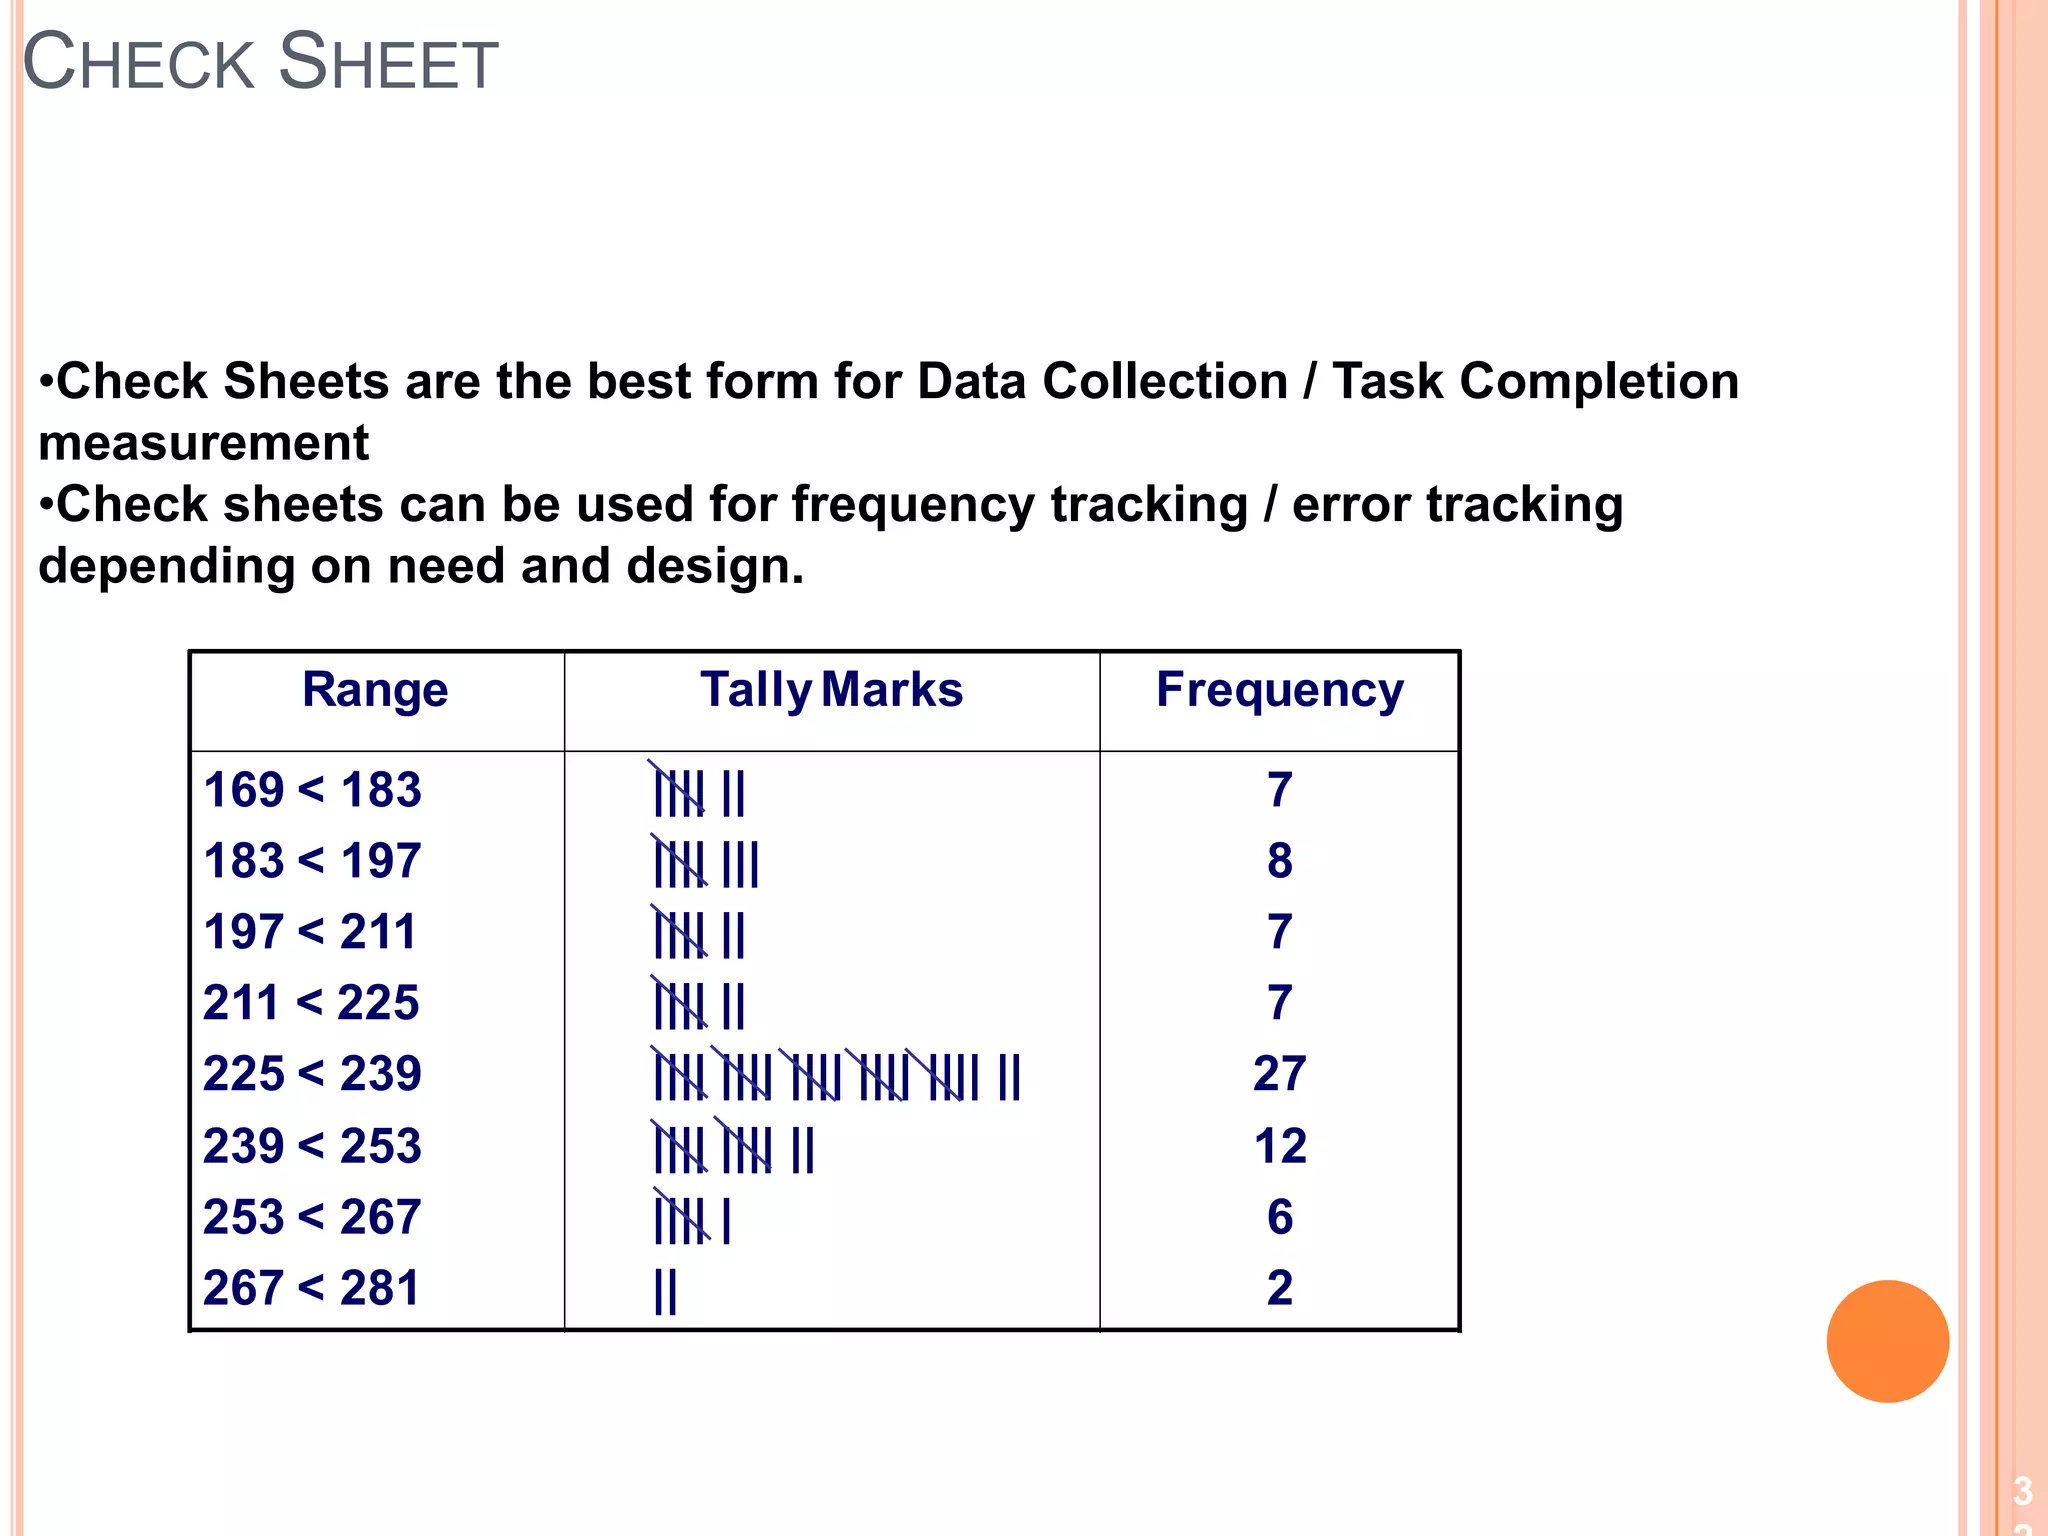
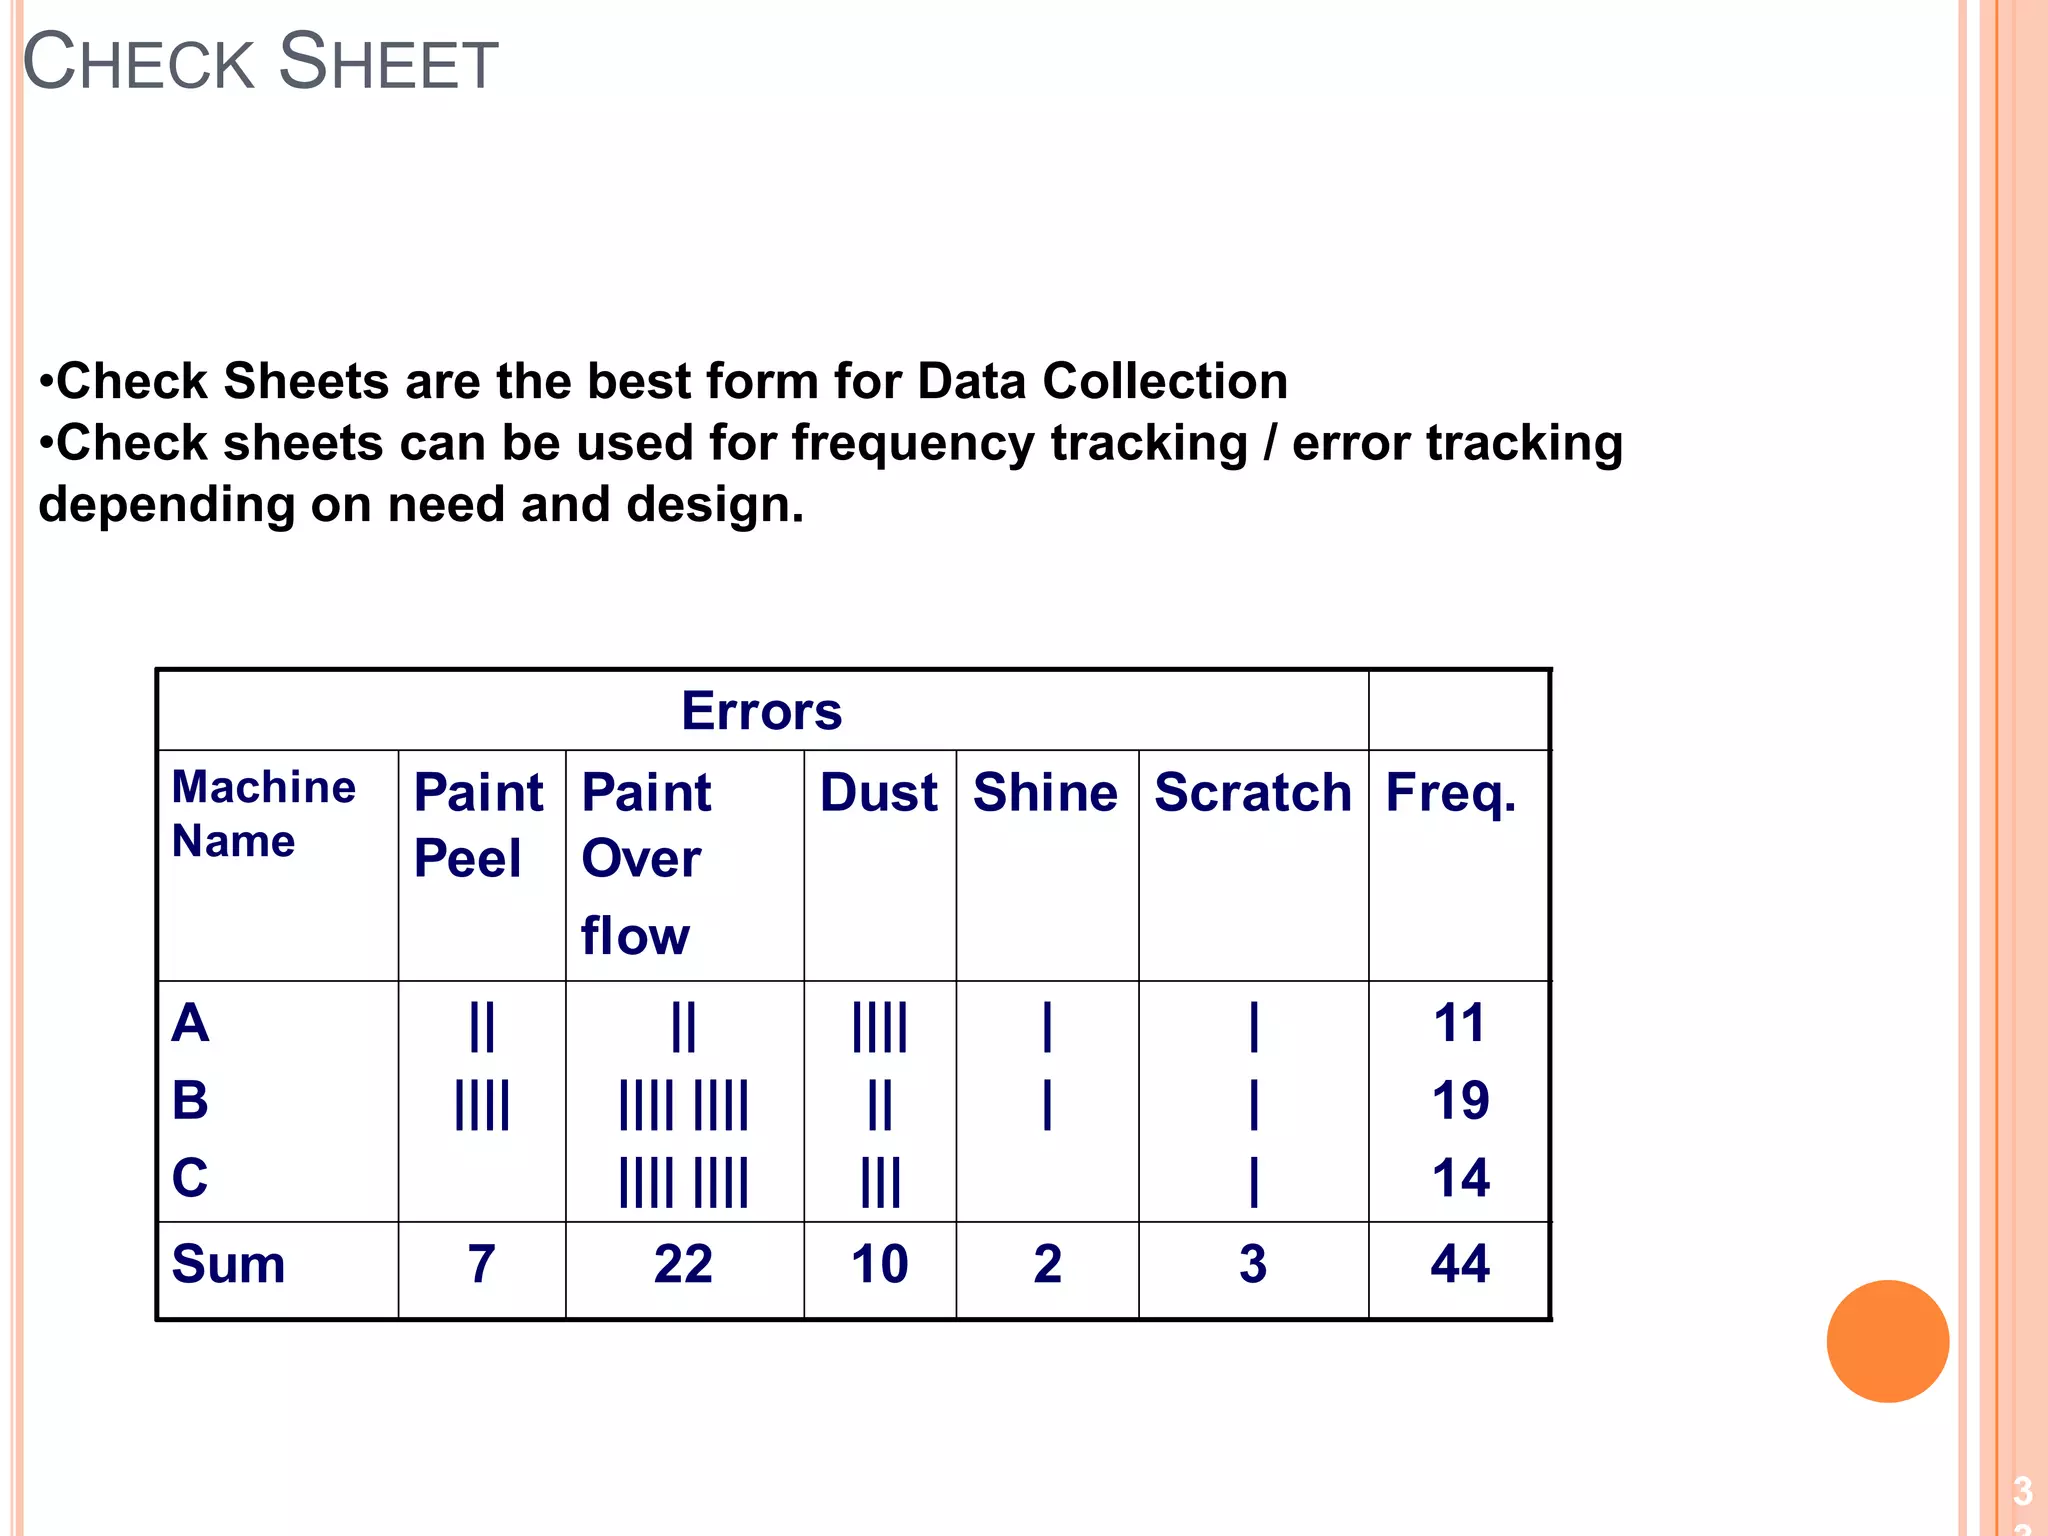
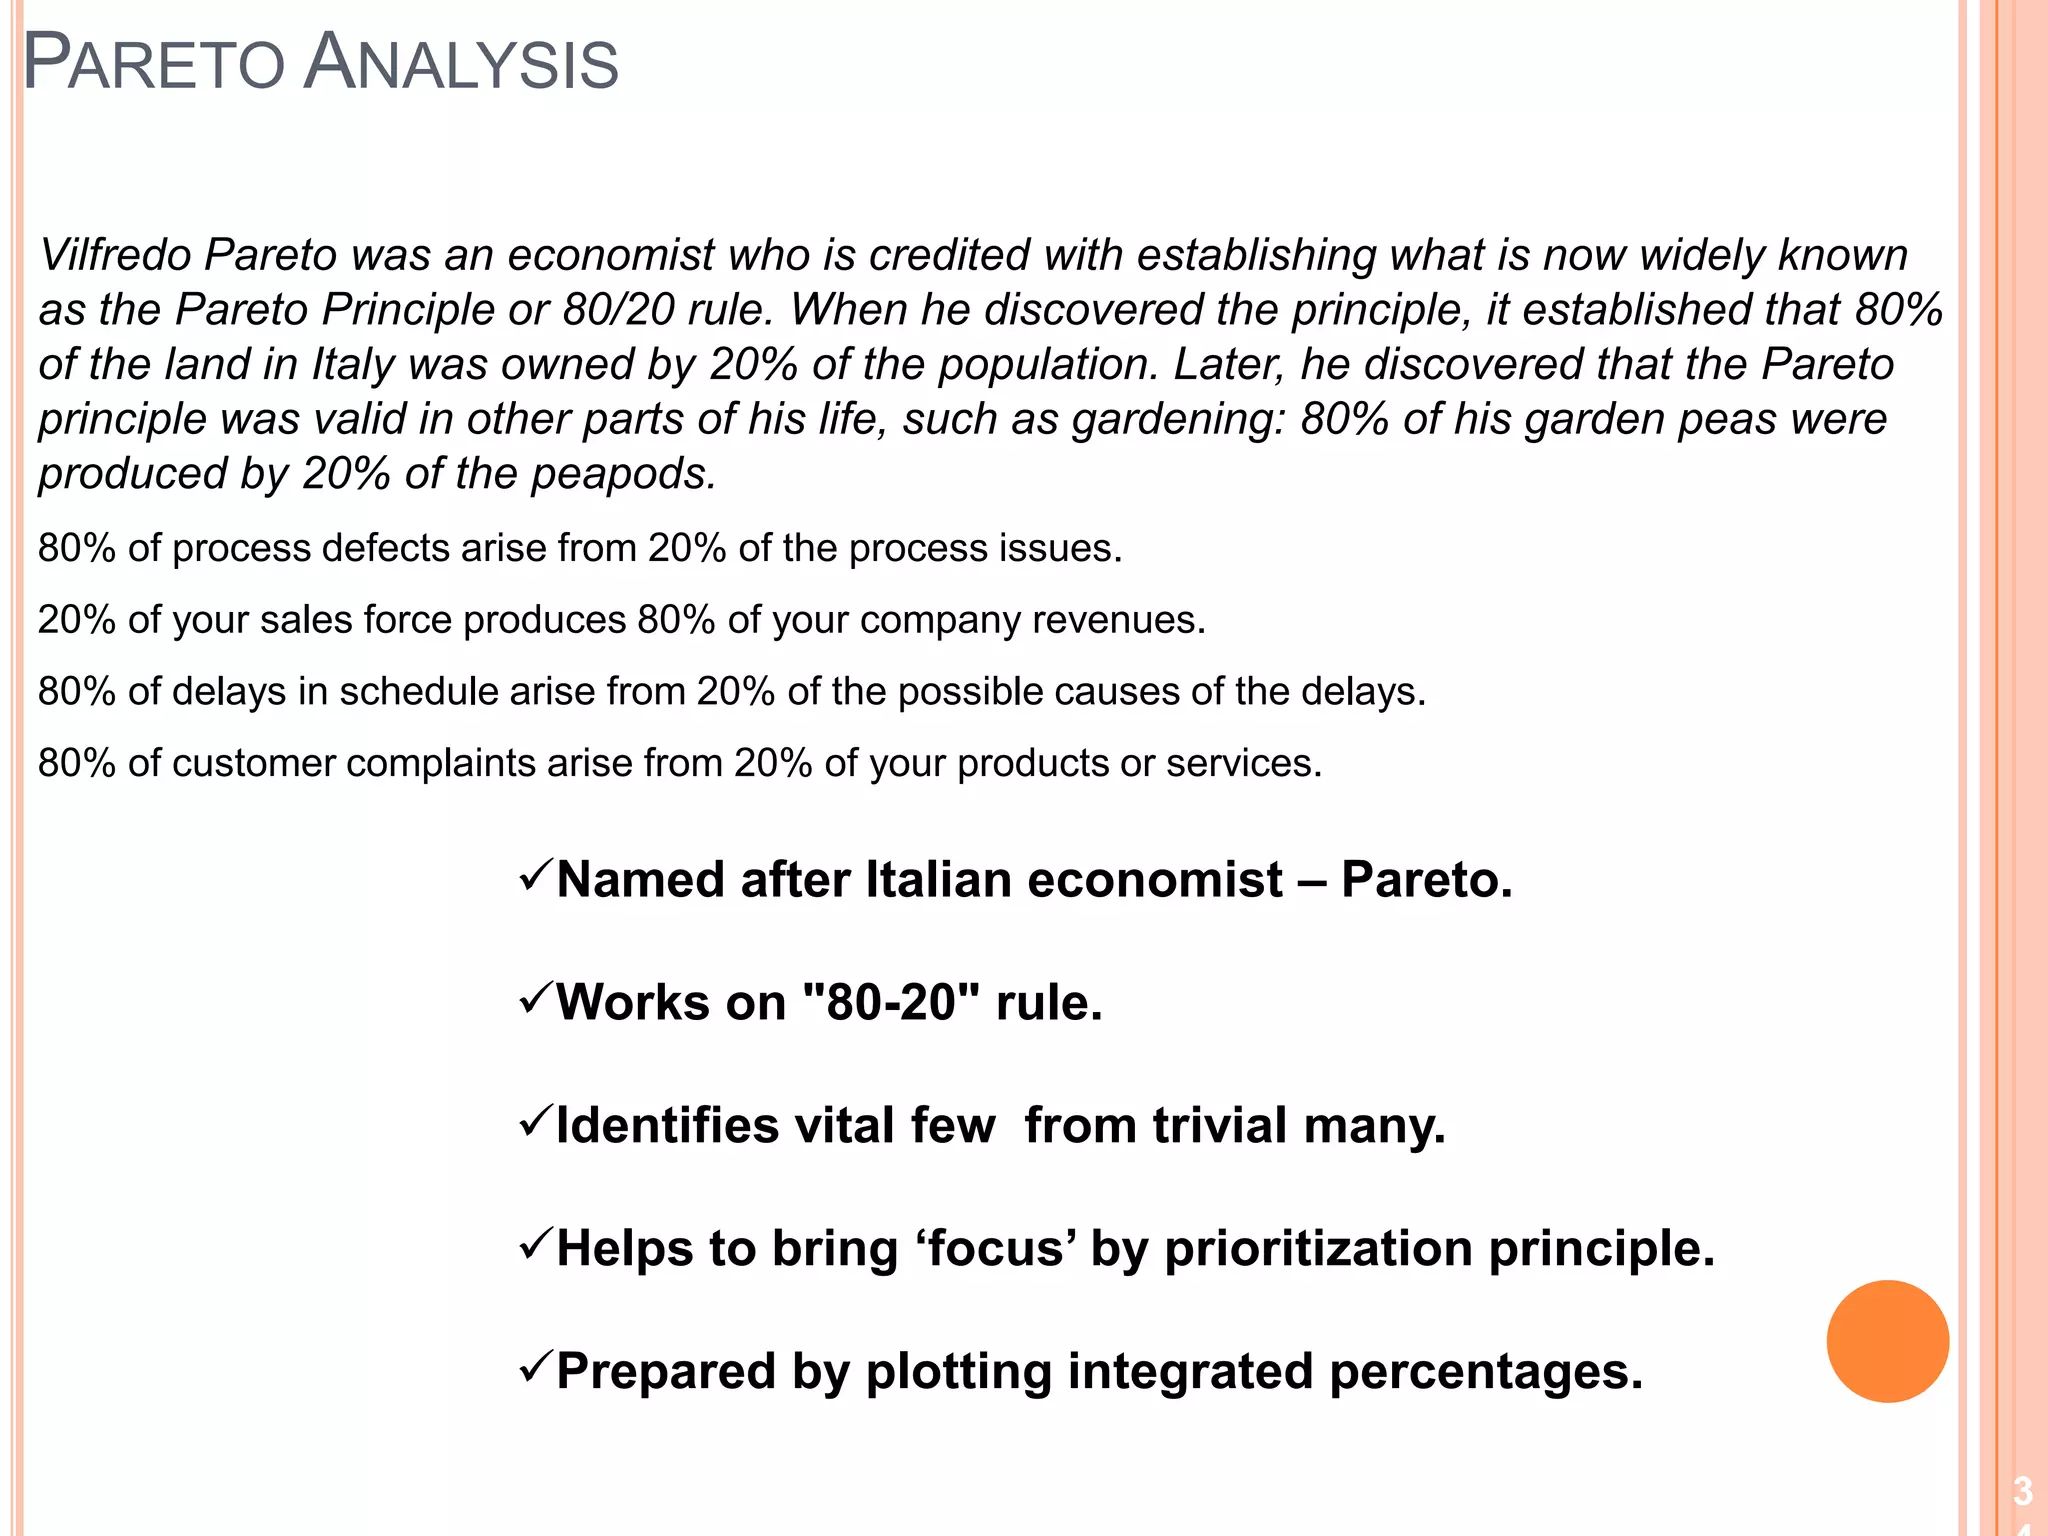
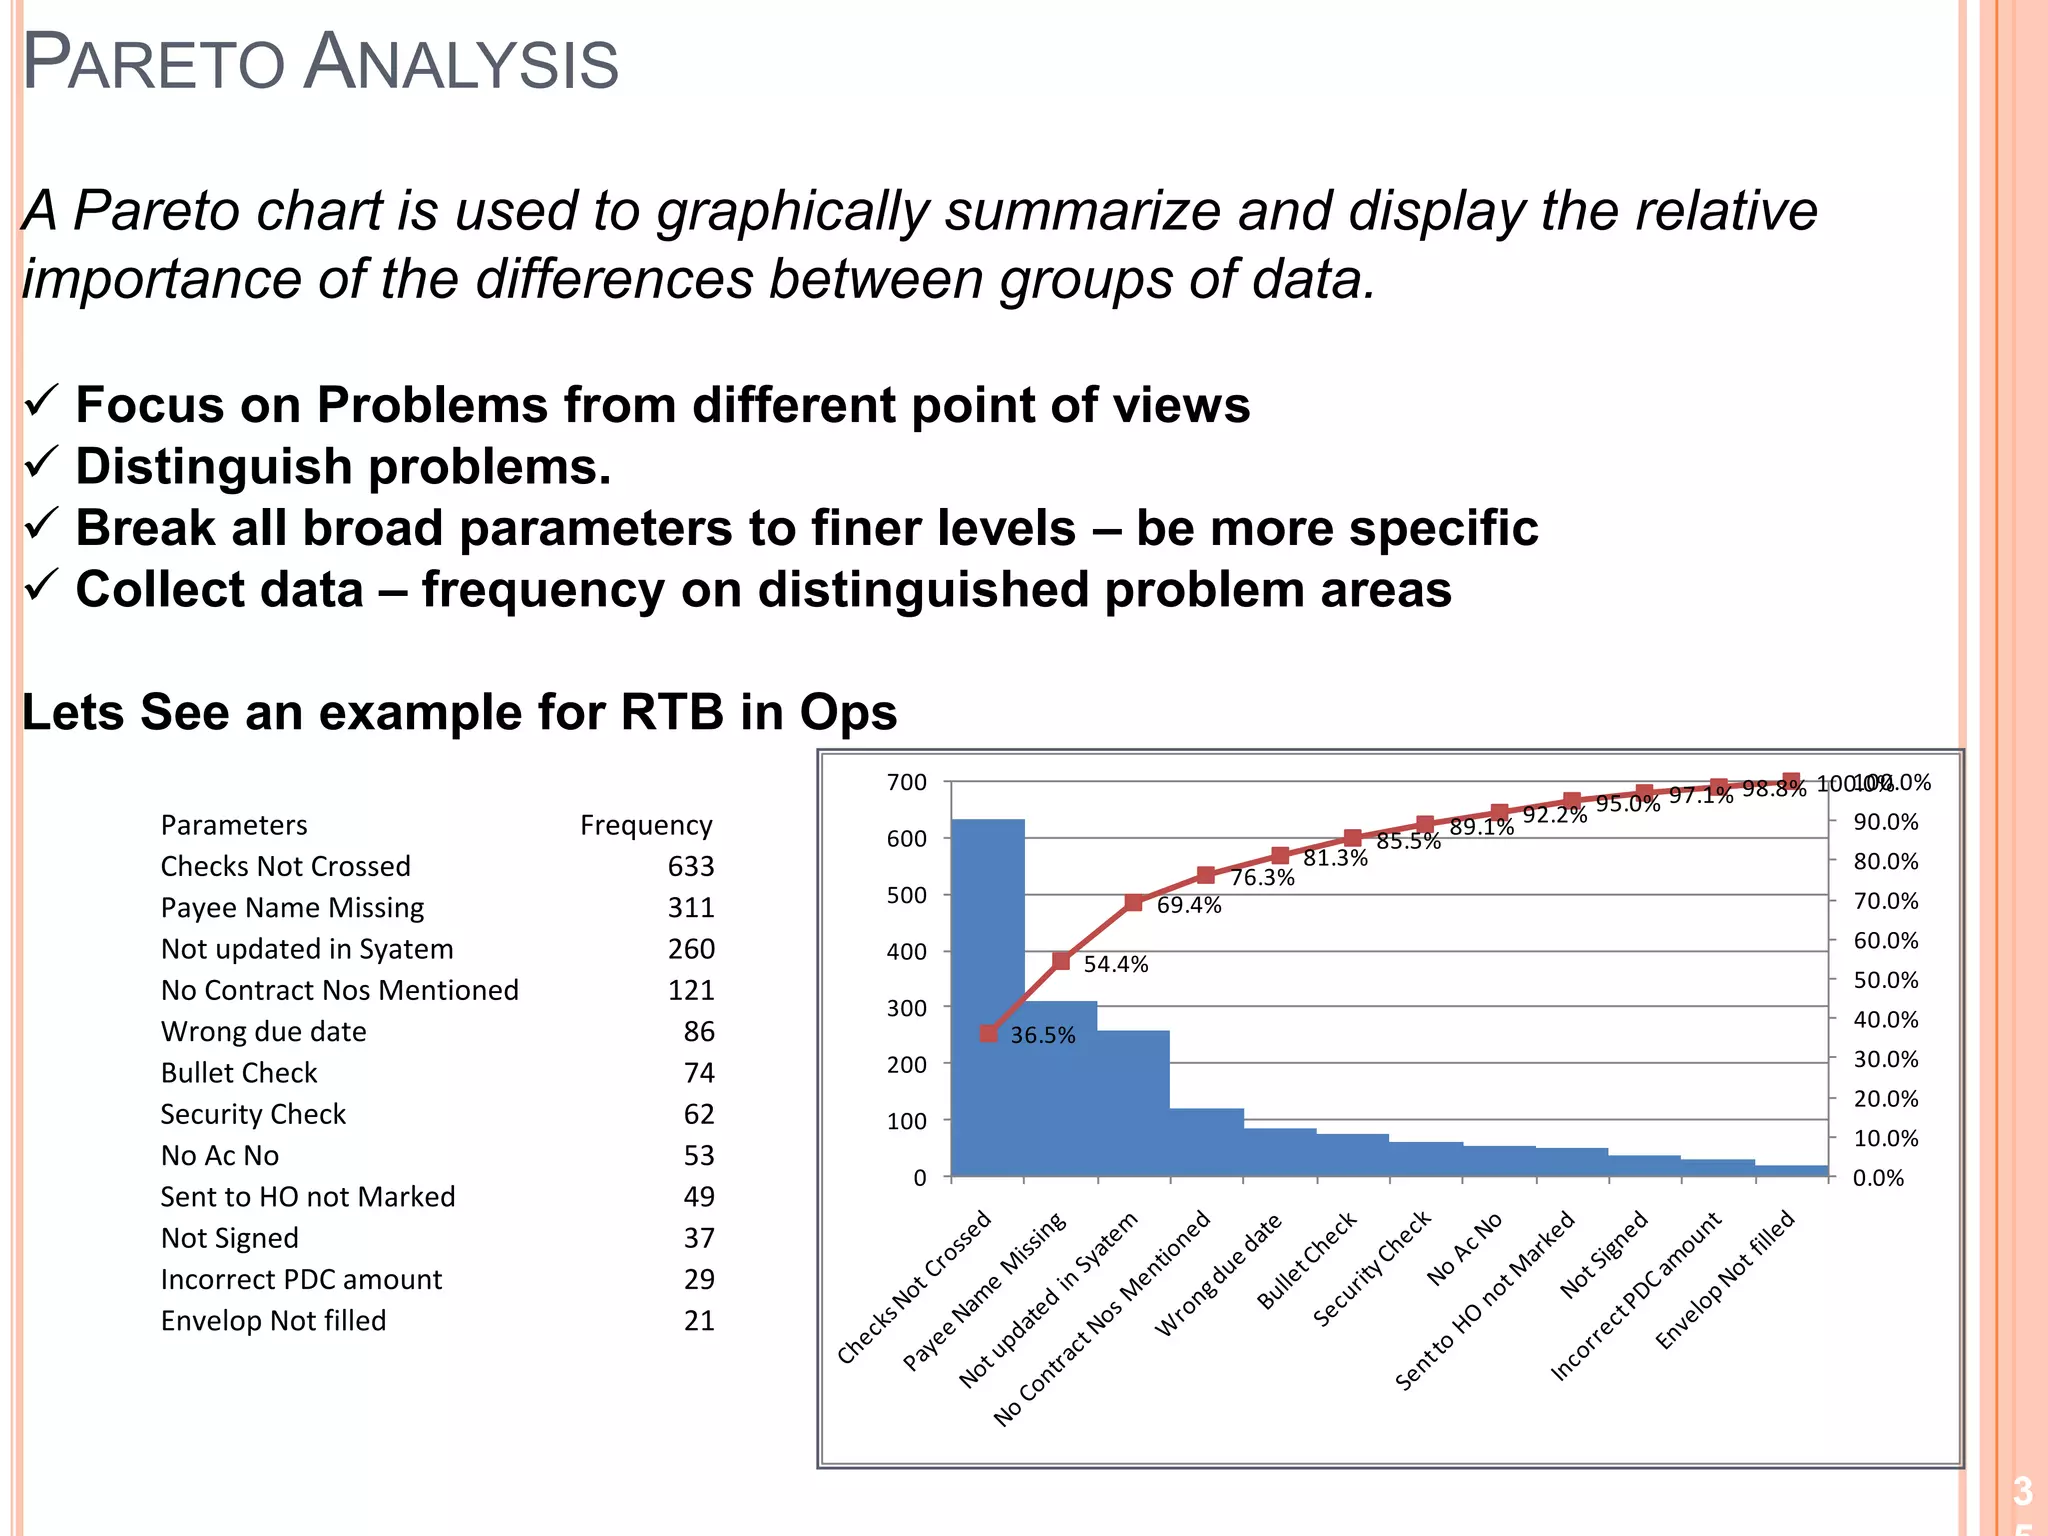
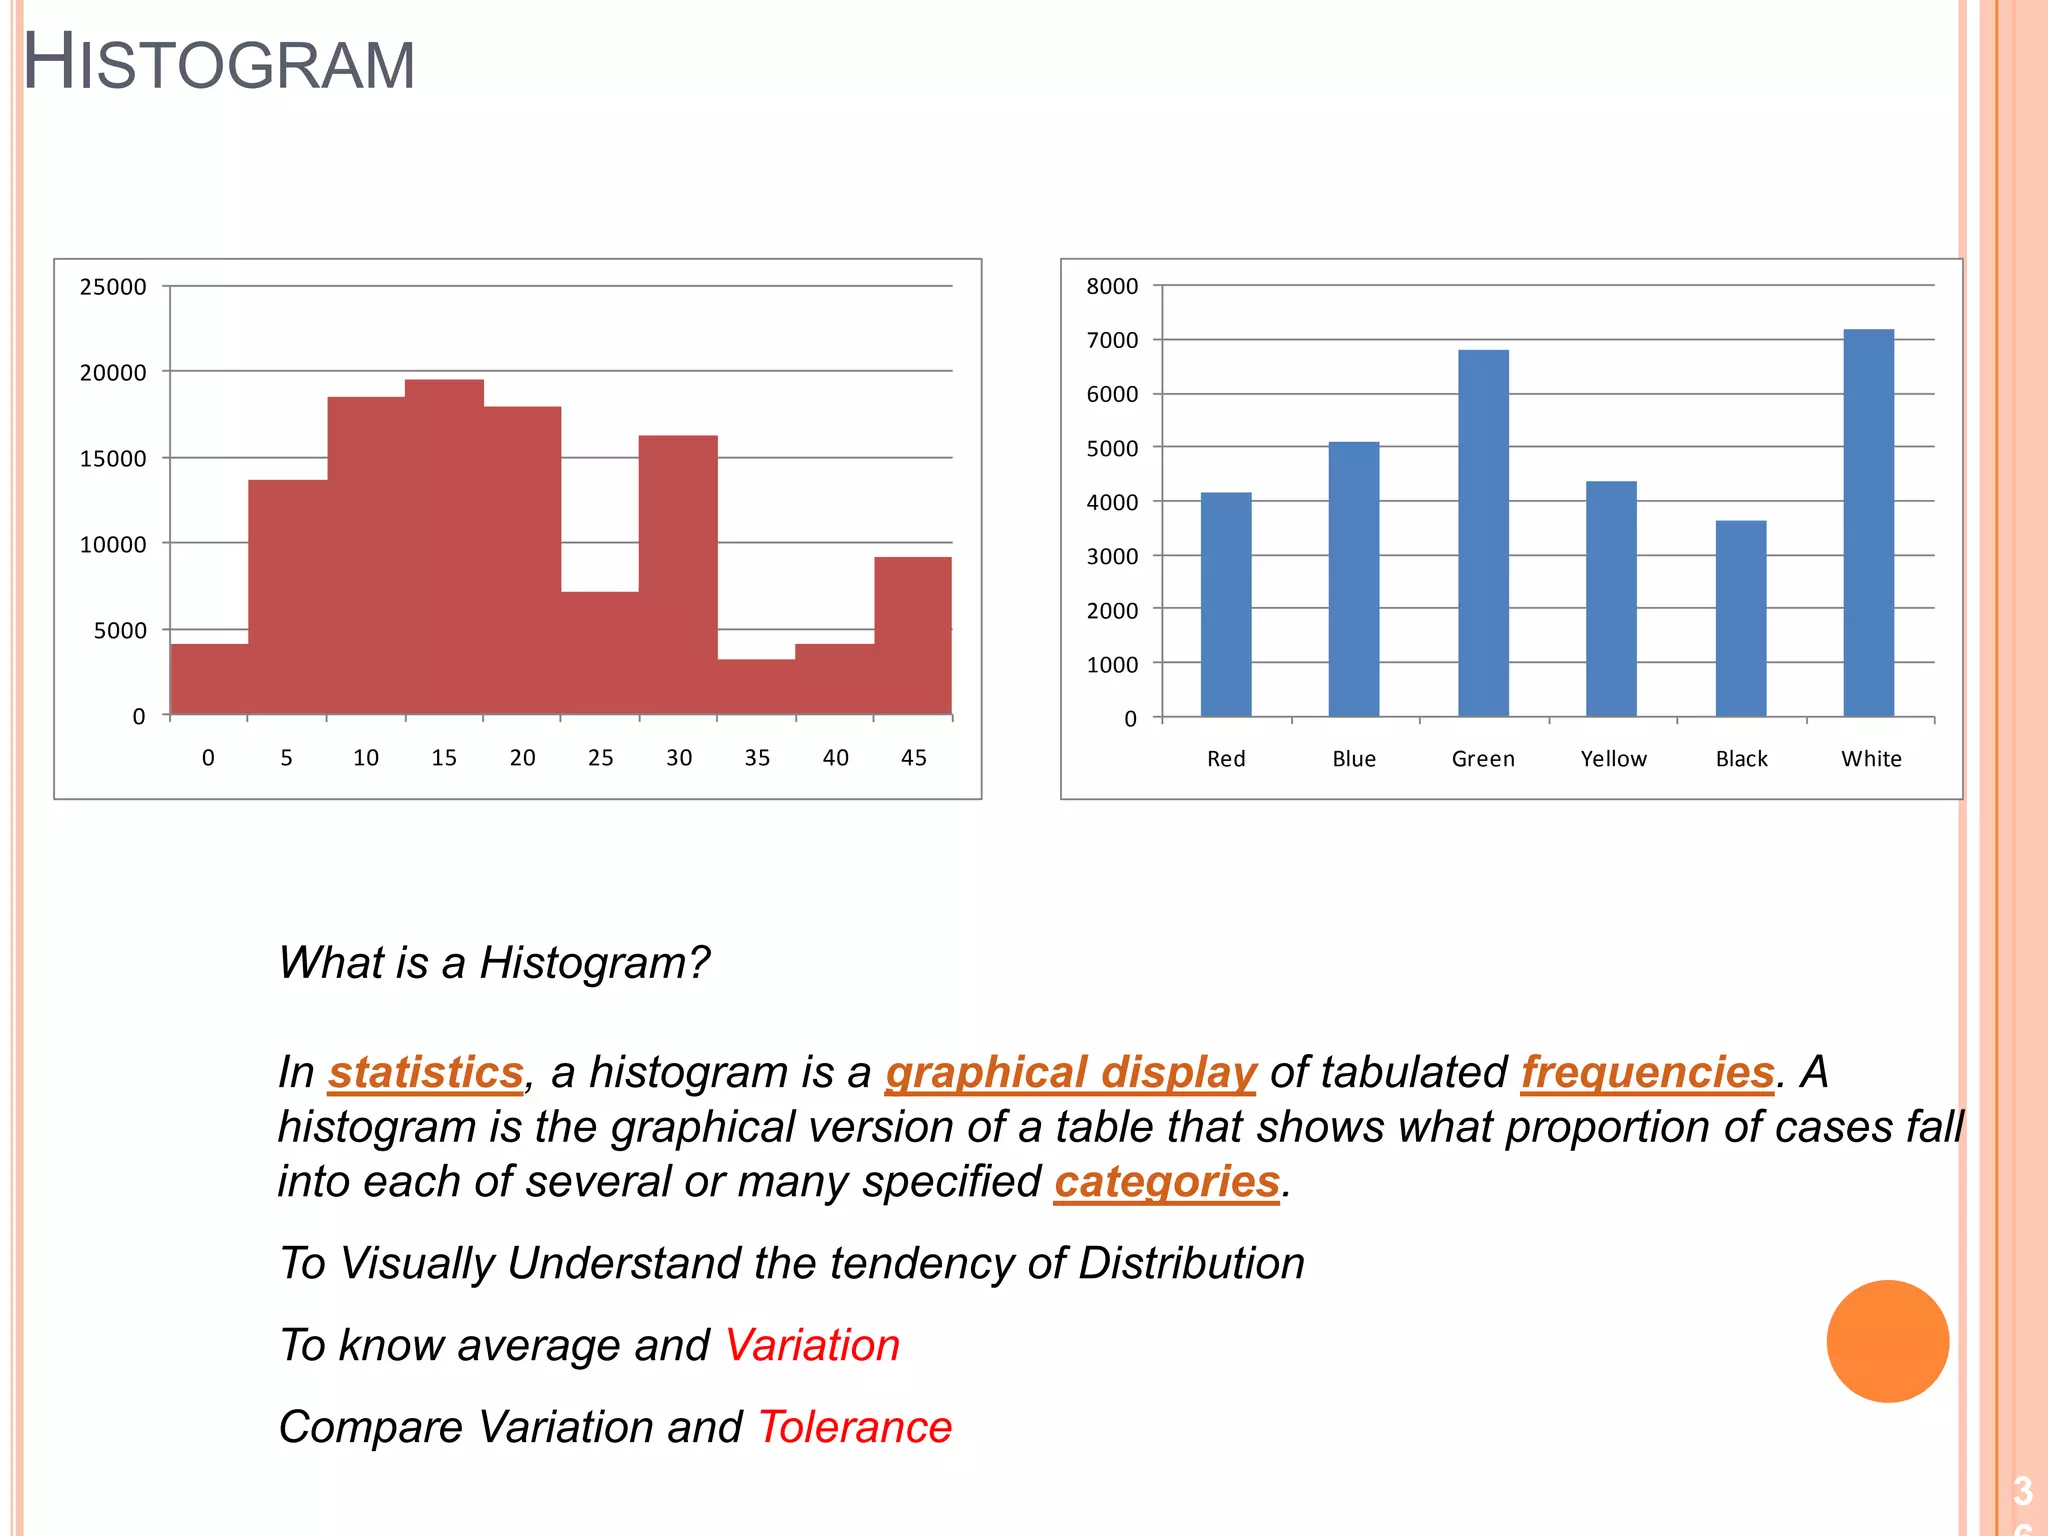
Awareness To Lean	& Quality control ToolsNilesh Sawant
What Is Lean	A principle driven, tool based philosophy that focuses on eliminating waste through continuous improvement by flowing the product on the pull (demand) of the customer in pursuit to perfection.The Key to Lean is about continuous waste elimination.
Why Lean
How To Lean	Identify Problems (EXCESS)		Quick Usage of Tools			Methodology based on Action.SolutionsSimpleComplexKnownCausesUnknown
5s	The 5S principle represents the fivediscipline that help maintain an efficientworkplace, by minimizing waste. It alsounravels the hidden waste in thesystem.1. Seiri - Sort : Eliminating unnecessary items from workplace2. Seiton - Set in Order : Efficient & effective storage ways.3. Seiso - Shine : Keeping things clean and polished.4. Seiketsu - Standardize : Standardizing best practices in workplace.5. Shitsuke - Sustain : Commitment & adherence to established   standards
5 Key Lean PrinciplesSpecify Value in the eyes of the customer.
Identify Value Stream & Eliminate Waste.
Make Value Flow.
Implement Pull.
Continuously Improve and Gain knowledge in pursuit of Perfection		Specify Value in the eyes of the customer.Define value from the perspective of the final customer. Express value interms of a specific product/service, which meets the customer’s needsat a specific price and at a specific time.Ask how your current products/services and processes disappoint your customer’s value expectation:
price?
quality?
reliable delivery?
rapid response to changing needs?Identify Value Stream & Eliminate Waste.Identify all of the steps currentlyrequiredto move products from order to deliveryChallenge every step: Why is thisnecessary? Would the customer thinkthe product is worth less if this stepcould be left out?Many steps are only necessarybecause of the way firms areorganized and previous decisionsabout assets and technologiesValue streamAll activities, both value added andnon-value added, required to bring aproduct (or provide a capability) fromraw material (initialization) into thearm of the customer3 Main Value Streams:1. Raw material to customer2. Concept to launch3. Order to cashMapping the VS – See the whole and improve the system
Make Value Flow.Make the steps in the value stream flow. Eliminate functional barriers and develop a product/service focused organization that dramatically improves lead time & productivity. By doing you increase the Flow (Velocity) !!
Continuous movement of products, services and information through the various transactions from end to end in the process
Flow appears impractical and illogical because we have been trained to think in terms of:
departments, silos
batches, queues,
efficiencies and backlogsImplement PullThrough lead time compression &correct value specification, letcustomers get exactly what’s wantedexactly when it’s wanted: At the pull of the customer/next process
 Using signals (kanbans)
A system of cascading productionand delivery instructions in whichnothing is done by the upstreamsupplier until the downstreamcustomer signals the needPull: Customer Centric
Continuously Improve and Gain knowledge in pursuit of PerfectionThere is always more waste
People learn and exercise more creativity             Involve employees in the process, training them as you proceed.Continuous improvement leads to innovation
Use root cause analysis to solve problems promptly and
permanently.
Make objectives visible
What is WasteCost –Value=WasteWhat it is What it Should Be
What is WasteLean Focuses on working on the 3 M’s.Muda – WasteMura – InconsistencyMuri –Un reasonableness
How to Identify WasteLean on level 1 focuses on identificationand elimination of wastes which can becategorized into 7 units.Over Production 					InventoryMotion 					Waiting Processing 					DefectsTransportationKnowledge not being used and Miss-Use of resources can be added
Lean Tools Help Remove Muda
5sProvides a simple way to organize and standardize the workplace• Employs visual tools to ensure efficiency and stabilize results• Employs team-based standards to keep workplace organized, clean and safe5Ss for greater Efficiency
Keys to 5S successStart with something small
Be positive
Get everyone involved…..Make it fun
 Keep initiatives visible
 Maintain the momentum
Communicate need for 5S, roles of all participants, how it is implemented
 Business Team Leader involvement is a must !!
Follow through - finish what is started - 5S takes effort and   persistence
Link 5S activity with all other Action Workout initiatives5S DeploymentSimple steps towards better functioning
Resistance to 5s5S DeploymentI’m not a cleaner!• We already tried something like this• I know my way around this mess• 5 S is for a factory• Too busy to spend time on orderliness• It’ll just get dirty again• Let us do it the way we’re used to (inertia)Be wary of these words
Waste OverviewAny activity that absorbs resources but adds no value is a WasteMUDA is a Japanese word, which stands for “Waste” Activities that add no value, add cost and timeWaste is a Symptom; need to find root causes and eliminate themWaste points to problems within the systemTypical Operation: 1-10% of the activities are value adding

Awareness To Lean & 7 Qc Tools

  • 1.
    Awareness To Lean &Quality control ToolsNilesh Sawant
  • 2.
    What Is Lean Aprinciple driven, tool based philosophy that focuses on eliminating waste through continuous improvement by flowing the product on the pull (demand) of the customer in pursuit to perfection.The Key to Lean is about continuous waste elimination.
  • 3.
  • 4.
    How To Lean IdentifyProblems (EXCESS) Quick Usage of Tools Methodology based on Action.SolutionsSimpleComplexKnownCausesUnknown
  • 5.
    5s The 5S principlerepresents the fivediscipline that help maintain an efficientworkplace, by minimizing waste. It alsounravels the hidden waste in thesystem.1. Seiri - Sort : Eliminating unnecessary items from workplace2. Seiton - Set in Order : Efficient & effective storage ways.3. Seiso - Shine : Keeping things clean and polished.4. Seiketsu - Standardize : Standardizing best practices in workplace.5. Shitsuke - Sustain : Commitment & adherence to established standards
  • 6.
    5 Key LeanPrinciplesSpecify Value in the eyes of the customer.
  • 7.
    Identify Value Stream& Eliminate Waste.
  • 8.
  • 9.
  • 10.
    Continuously Improve andGain knowledge in pursuit of Perfection Specify Value in the eyes of the customer.Define value from the perspective of the final customer. Express value interms of a specific product/service, which meets the customer’s needsat a specific price and at a specific time.Ask how your current products/services and processes disappoint your customer’s value expectation:
  • 11.
  • 12.
  • 13.
  • 14.
    rapid response tochanging needs?Identify Value Stream & Eliminate Waste.Identify all of the steps currentlyrequiredto move products from order to deliveryChallenge every step: Why is thisnecessary? Would the customer thinkthe product is worth less if this stepcould be left out?Many steps are only necessarybecause of the way firms areorganized and previous decisionsabout assets and technologiesValue streamAll activities, both value added andnon-value added, required to bring aproduct (or provide a capability) fromraw material (initialization) into thearm of the customer3 Main Value Streams:1. Raw material to customer2. Concept to launch3. Order to cashMapping the VS – See the whole and improve the system
  • 15.
    Make Value Flow.Makethe steps in the value stream flow. Eliminate functional barriers and develop a product/service focused organization that dramatically improves lead time & productivity. By doing you increase the Flow (Velocity) !!
  • 16.
    Continuous movement ofproducts, services and information through the various transactions from end to end in the process
  • 17.
    Flow appears impracticaland illogical because we have been trained to think in terms of:
  • 18.
  • 19.
  • 20.
    efficiencies and backlogsImplementPullThrough lead time compression &correct value specification, letcustomers get exactly what’s wantedexactly when it’s wanted: At the pull of the customer/next process
  • 21.
  • 22.
    A system ofcascading productionand delivery instructions in whichnothing is done by the upstreamsupplier until the downstreamcustomer signals the needPull: Customer Centric
  • 23.
    Continuously Improve andGain knowledge in pursuit of PerfectionThere is always more waste
  • 24.
    People learn andexercise more creativity Involve employees in the process, training them as you proceed.Continuous improvement leads to innovation
  • 25.
    Use root causeanalysis to solve problems promptly and
  • 26.
  • 27.
  • 28.
    What is WasteCost–Value=WasteWhat it is What it Should Be
  • 29.
    What is WasteLeanFocuses on working on the 3 M’s.Muda – WasteMura – InconsistencyMuri –Un reasonableness
  • 30.
    How to IdentifyWasteLean on level 1 focuses on identificationand elimination of wastes which can becategorized into 7 units.Over Production InventoryMotion Waiting Processing DefectsTransportationKnowledge not being used and Miss-Use of resources can be added
  • 31.
    Lean Tools HelpRemove Muda
  • 32.
    5sProvides a simpleway to organize and standardize the workplace• Employs visual tools to ensure efficiency and stabilize results• Employs team-based standards to keep workplace organized, clean and safe5Ss for greater Efficiency
  • 33.
    Keys to 5SsuccessStart with something small
  • 34.
  • 35.
  • 36.
  • 37.
  • 38.
    Communicate need for5S, roles of all participants, how it is implemented
  • 39.
    Business TeamLeader involvement is a must !!
  • 40.
    Follow through -finish what is started - 5S takes effort and persistence
  • 41.
    Link 5S activitywith all other Action Workout initiatives5S DeploymentSimple steps towards better functioning
  • 42.
    Resistance to 5s5SDeploymentI’m not a cleaner!• We already tried something like this• I know my way around this mess• 5 S is for a factory• Too busy to spend time on orderliness• It’ll just get dirty again• Let us do it the way we’re used to (inertia)Be wary of these words
  • 43.
    Waste OverviewAny activitythat absorbs resources but adds no value is a WasteMUDA is a Japanese word, which stands for “Waste” Activities that add no value, add cost and timeWaste is a Symptom; need to find root causes and eliminate themWaste points to problems within the systemTypical Operation: 1-10% of the activities are value adding
  • 44.
    Why visual managementWhyVisual ManagementDemonstrate how we manage our processes …Consistent CommunicationExcite customers/ stakeholders walking the floor… Visual ManagementTransparent view of Performance… Shared Ownership Escalate abnormalities… Quicker ResolutionDecision making @ working level … EmpowermentShowcase Successes… Create a sense of Pride
  • 45.
    What will bedifferent from current?• Standardized Look & Feel…. White board / Pinup …digitize gen2• Place Strategically…. @ Entrance to every process… Aisle for huddles• Daily huddle…. Discuss performance , Hits & Misses, resolve issues• Keep Up-to date…. Identify Owner & display next update due• Leadership Engagement… floor walkWhat needs to be displayedProcess performance - Dash boards, Biz Impact…Process improvements - Who, What, When…. drive momentumException situations - Handwritten…. Review by team dailyGood to have: Process Map, Team OrganizationManaging Visually is a Culture Change
  • 46.
    Value analysisDefinition forValue addAny activity that transforms shape/nature of the product that the customer is willing to pay for is a Value added activity.• Physical change of product adds to its value• If the product does not add value, it adds to its cost or creates waste.• Value is always defined by the customer.
  • 47.
    Value v/s nonvalueValue-Added Step:• Customer pays for its occurrence• Changes the physical shape– e.g. Making system entry, Mandate Testing, Packing, Ordering material• Non-value-Added Steps:• Does not add value to the output• Not essential to produce the output– e.g. Revising, Rework, Review, Waiting, Inspection, Filing, Obtaining Approval, Motion, Counting, Delay
  • 48.
    What is aprocess mapA graphical representation of steps, events, operations, and relationships of resources within a processDoes your process overlap with the customer’s?
  • 49.
    Should the customer’sprocess be mapped?
  • 50.
    Should you partnerwith the customer toassess the processes?
  • 51.
    Why Map aProcessFlow of work evaluates the cycle time of the process under two broadcategories:Process TimeDelay Time Process Time + Delay Time _________________ Cycle Time
  • 52.
    Estimate Time Spentin waiting and processing for each activity• Categorize Value Add and Non Value Add time• Calculate %VA• Brainstorm to reduce Steps / waiting to improve the value of the chain process.
  • 54.
    InitiateInitiate and signoff on the process / Team for Lean DeploymentIdentifyIdentify Muda.EliminateEliminate Muda and Implement Pull SystemsStabilizeStabilize and continuously improve.
  • 55.
  • 56.
  • 57.
    Pareto Analysis
  • 58.
  • 59.
    Cause andEffect Diagram31
  • 60.
    Check SheetCheck Sheetsare the best form for Data Collection / Task Completion measurement
  • 61.
    Check sheets canbe used for frequency tracking / error tracking depending on need and design.32
  • 62.
    Check SheetCheck Sheetsare the best form for Data Collection
  • 63.
    Check sheets canbe used for frequency tracking / error tracking depending on need and design.33
  • 64.
    Pareto AnalysisVilfredo Paretowas an economist who is credited with establishing what is now widely known as the Pareto Principle or 80/20 rule. When he discovered the principle, it established that 80% of the land in Italy was owned by 20% of the population. Later, he discovered that the Pareto principle was valid in other parts of his life, such as gardening: 80% of his garden peas were produced by 20% of the peapods.80% of process defects arise from 20% of the process issues. 20% of your sales force produces 80% of your company revenues. 80% of delays in schedule arise from 20% of the possible causes of the delays.80% of customer complaints arise from 20% of your products or services.Named after Italian economist – Pareto.
  • 65.
  • 66.
    Identifies vital few from trivial many.
  • 67.
    Helps to bring‘focus’ by prioritization principle.
  • 68.
    Prepared by plottingintegrated percentages.34
  • 69.
    Pareto AnalysisA Paretochart is used to graphically summarize and display the relative importance of the differences between groups of data. Focus on Problems from different point of views
  • 70.
  • 71.
    Break allbroad parameters to finer levels – be more specific
  • 72.
    Collect data– frequency on distinguished problem areasLets See an example for RTB in Ops35
  • 73.
    HistogramWhat is aHistogram?In statistics, a histogram is a graphical display of tabulated frequencies. A histogram is the graphical version of a table that shows what proportion of cases fall into each of several or many specified categories.To Visually Understand the tendency of DistributionTo know average and VariationCompare Variation and Tolerance36
  • 74.
    BrainstormingLets look atone tool which helps to compile discussionTo find a solution to a specific problem
  • 75.
    To suggest countermeasures when the target has not been achieved
  • 76.
    To select atheme/topic
  • 77.
    To find causesof a specific problem37
  • 78.
    Cause and EffectDiagram Tool that facilitates to identify the results (characteristics or effects) and the possible causes (factors) in a systematic manner.Created by Prof. Ishikawa of Tokyo University.Also known as Fish Bone Diagram.Why Cause and Effect Diagram Helps Summarize Potential Causes
  • 79.
  • 80.
    Helps simulate identificationof other potential root causes.38
  • 81.
    Cause and EffectDiagram An Ishikawa or Cause and Effect Diagram also known as Fish Bone classifies all the sources of Variation into 6 categories (5M and 1P) Machine
  • 82.
  • 83.
  • 84.
  • 85.
  • 86.
  • 87.
    Cause and EffectDiagram - Steps 1. Define the effect (results obtained through a process / Pain Area). 2. Determine the causes or the factors that have bearing (influence) on the effect, through a process of brainstorming by a group of concerned people. 3. Arrange the causes in the form of a fish-bone graph or cause and effect diagram.Major causes are indicated by larger bones and Minor causes are indicated by shorter bones. 4. Determine Vital causes .Take actions to improve in order of priority and importance or impact (Not more than 5).Main CauseSub-causes orMinor causesEFFECT40
  • 88.
    Cause and EffectDiagram - Example 41
  • 89.
  • 90.