and
present
A Summary of
Leveraged Buyout
(LBO) Models
2.
About JobSearchDigest.com
Every day our team researches all the online job
sources (including the specialty niche sites)
We capture every Hedge Fund, Private Equity,
Venture Capital and Investment Banking job
Daily email updates give you a competitive
advantage in your job search
www.JobSearchDigest.com
Copyright 2009
3.
About The InvestmentBanking Institute
Core financial, technical and modeling skills.
Similar to the top firms.
4 Weeks of training
– 28 hours of live, in-class instruction,
– Taught by current and former investment bankers.
Wide range of topics.
Classes monthly in major cities across the US,
Canada and Europe.
Visit www.ibtraining.com for additional details.
Copyright 2009
4.
Table of Contents
I. Uses for An LBO Model
II. Components of LBO Model
III. IRR Analysis
IV. Q&A
Copyright 2009
5.
Uses for anLBO Model
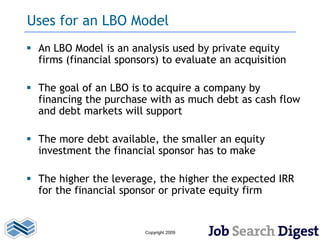
An LBO Model is an analysis used by private equity
firms (financial sponsors) to evaluate an acquisition
The goal of an LBO is to acquire a company by
financing the purchase with as much debt as cash flow
and debt markets will support
The more debt available, the smaller an equity
investment the financial sponsor has to make
The higher the leverage, the higher the expected IRR
for the financial sponsor or private equity firm
Copyright 2009
6.
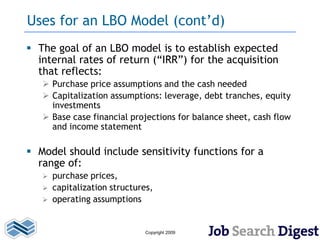
Uses for anLBO Model (cont’d)
The goal of an LBO model is to establish expected
internal rates of return (“IRR”) for the acquisition
that reflects:
Purchase price assumptions and the cash needed
Capitalization assumptions: leverage, debt tranches, equity
investments
Base case financial projections for balance sheet, cash flow
and income statement
Model should include sensitivity functions for a
range of:
purchase prices,
capitalization structures,
operating assumptions
Copyright 2009
7.
Uses for anLBO Model (cont’d)
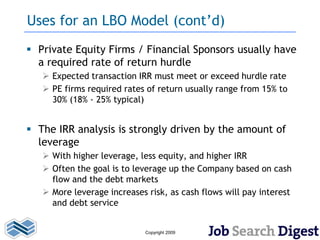
Private Equity Firms / Financial Sponsors usually have
a required rate of return hurdle
Expected transaction IRR must meet or exceed hurdle rate
PE firms required rates of return usually range from 15% to
30% (18% - 25% typical)
The IRR analysis is strongly driven by the amount of
leverage
With higher leverage, less equity, and higher IRR
Often the goal is to leverage up the Company based on cash
flow and the debt markets
More leverage increases risk, as cash flows will pay interest
and debt service
Copyright 2009
8.
Uses for anLBO Model (cont’d)
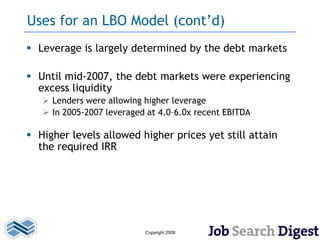
Leverage is largely determined by the debt markets
Until mid-2007, the debt markets were experiencing
excess liquidity
Lenders were allowing higher leverage
In 2005-2007 leveraged at 4.0–6.0x recent EBITDA
Higher levels allowed higher prices yet still attain
the required IRR
Copyright 2009
9.
Uses for anLBO Model (cont’d)
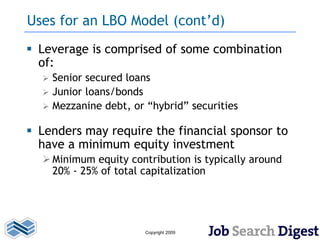
Leverage is comprised of some combination
of:
Senior secured loans
Junior loans/bonds
Mezzanine debt, or “hybrid” securities
Lenders may require the financial sponsor to
have a minimum equity investment
Minimum equity contribution is typically around
20% - 25% of total capitalization
Copyright 2009
10.
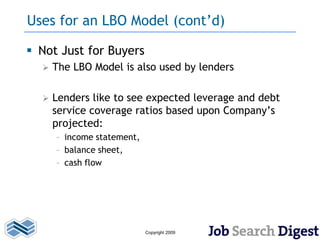
Uses for anLBO Model (cont’d)
Not Just for Buyers
The LBO Model is also used by lenders
Lenders like to see expected leverage and debt
service coverage ratios based upon Company’s
projected:
– income statement,
– balance sheet,
– cash flow
Copyright 2009
11.
Pop Quiz
Thegoal of an LBO model is to establish
expected internal rates of return (“IRR”)
using a financial model that reflects:
a. Purchase price assumptions and uses of cash
b. Capitalization assumptions and sources of cash
c. Base case financial projections with
assumptions
d. All the above.
Copyright 2009
12.
Pop Quiz
Thegoal of an LBO model is to establish
expected internal rates of return (“IRR”)
using a financial model that reflects:
a. Purchase price assumptions and uses of cash
b. Capitalization assumptions and sources of cash
c. Base case financial projections with
assumptions
d. All the above.
Copyright 2009
13.
I. Uses forAn LBO Model
II. Components of LBO Model
III. IRR Analysis
IV. Q&A
Copyright 2009
14.
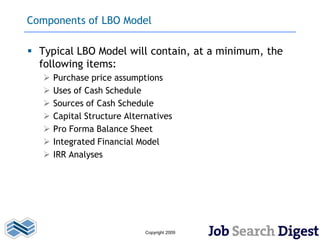
Components of LBOModel
Typical LBO Model will contain, at a minimum, the
following items:
Purchase price assumptions
Uses of Cash Schedule
Sources of Cash Schedule
Capital Structure Alternatives
Pro Forma Balance Sheet
Integrated Financial Model
IRR Analyses
Copyright 2009
15.
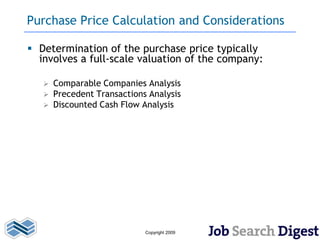
Purchase Price Calculationand Considerations
Determination of the purchase price typically
involves a full-scale valuation of the company:
Comparable Companies Analysis
Precedent Transactions Analysis
Discounted Cash Flow Analysis
Copyright 2009
16.
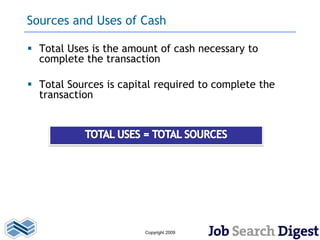
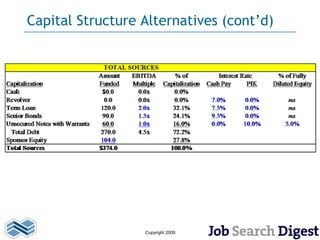
Sources and Usesof Cash
Total Uses is the amount of cash necessary to
complete the transaction
Total Sources is capital required to complete the
transaction
Copyright 2009
17.
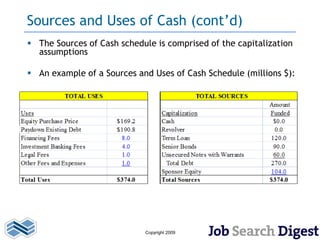
Sources and Usesof Cash (cont’d)
The Sources of Cash schedule is comprised of the capitalization
assumptions
An example of a Sources and Uses of Cash Schedule (millions $):
Copyright 2009
18.
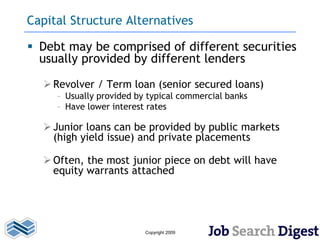
Capital Structure Alternatives
Debt may be comprised of different securities
usually provided by different lenders
Revolver / Term loan (senior secured loans)
– Usually provided by typical commercial banks
– Have lower interest rates
Junior loans can be provided by public markets
(high yield issue) and private placements
Often, the most junior piece on debt will have
equity warrants attached
Copyright 2009
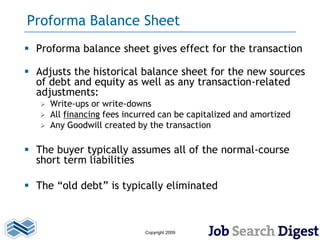
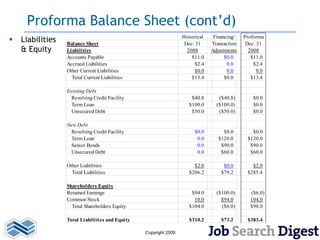
Proforma Balance Sheet
Proforma balance sheet gives effect for the transaction
Adjusts the historical balance sheet for the new sources
of debt and equity as well as any transaction-related
adjustments:
Write-ups or write-downs
All financing fees incurred can be capitalized and amortized
Any Goodwill created by the transaction
The buyer typically assumes all of the normal-course
short term liabilities
The “old debt” is typically eliminated
Copyright 2009
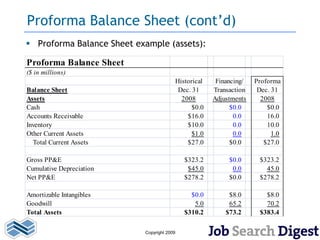
Proforma Balance Sheet(cont’d)
Liabilities Balance Sheet
Historical
Dec. 31
Financing/
Transaction
Proforma
Dec. 31
& Equity Liabilities 2008 Adjustments 2008
Accounts Payable $11.0 $0.0 $11.0
Accrued Liabilities $2.4 0.0 $2.4
Other Current Liabilities $0.0 0.0 0.0
Total Current Liabilities $13.4 $0.0 $13.4
Existing Debt
Revolving Credit Facility $40.8 ($40.8) $0.0
Term Loan $100.0 ($100.0) $0.0
Unsecured Debt $50.0 ($50.0) $0.0
New Debt
Revolving Credit Facility $0.0 $0.0 $0.0
Term Loan 0.0 $120.0 $120.0
Senior Bonds 0.0 $90.0 $90.0
Unsecured Debt 0.0 $60.0 $60.0
Other Liabilities $2.0 $0.0 $2.0
Total Liabilities $206.2 $79.2 $285.4
Shareholders Equity
Retained Earnings $94.0 ($100.0) ($6.0)
Common Stock 10.0 $94.0 104.0
Total Shareholders Equity $104.0 ($6.0) $98.0
Total Liabilities and Equity $310.2 $73.2 $383.4
Copyright 2009
23.
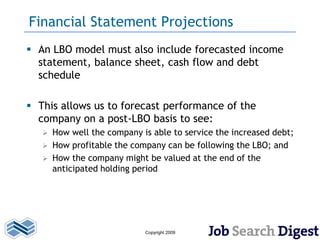
Financial Statement Projections
An LBO model must also include forecasted income
statement, balance sheet, cash flow and debt
schedule
This allows us to forecast performance of the
company on a post-LBO basis to see:
How well the company is able to service the increased debt;
How profitable the company can be following the LBO; and
How the company might be valued at the end of the
anticipated holding period
Copyright 2009
24.
Pop Quiz
Whichof the following is not included in total
uses of cash?
a. purchase price
b. transaction fees
c. debt service
d. other required cash payments in the transaction
e. none
Copyright 2009
25.
Pop Quiz
Whichof the following is not included in total
uses of cash?
a. purchase price
b. transaction fees
c. debt service
d. other required cash payments in the transaction
e. none
Copyright 2009
26.
I. Uses forAn LBO Model
II. Components of LBO Model
III. IRR Analysis
IV. Q&A
Copyright 2009
27.
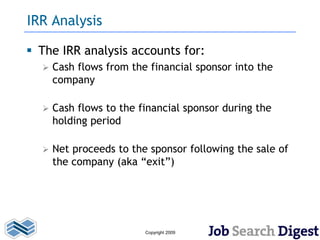
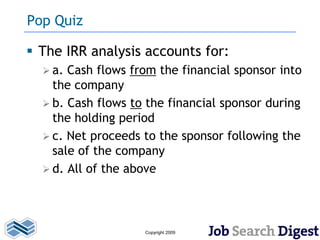
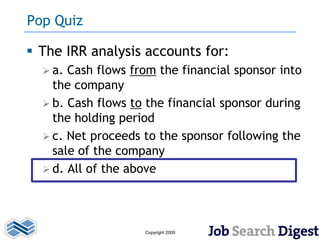
IRR Analysis
TheIRR analysis accounts for:
Cash flows from the financial sponsor into the
company
Cash flows to the financial sponsor during the
holding period
Net proceeds to the sponsor following the sale of
the company (aka “exit”)
Copyright 2009
28.
IRR Analysis (cont’d)
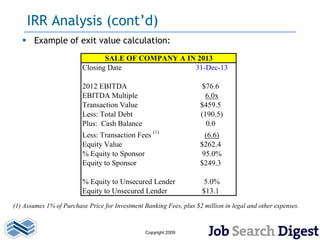
Example of exit value calculation:
SALE OF COMPANY A IN 2013
Closing Date 31-Dec-13
2012 EBITDA $76.6
EBITDA Multiple 6.0x
Transaction Value $459.5
Less: Total Debt (190.5)
Plus: Cash Balance 0.0
Less: Transaction Fees (1) (6.6)
Equity Value $262.4
% Equity to Sponsor 95.0%
Equity to Sponsor $249.3
% Equity to Unsecured Lender 5.0%
Equity to Unsecured Lender $13.1
(1) Assumes 1% of Purchase Price for Investment Banking Fees, plus $2 million in legal and other expenses.
Copyright 2009
29.
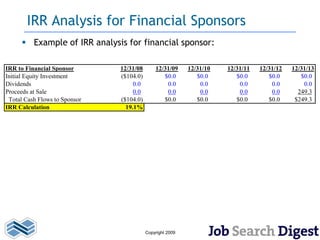
IRR Analysis forFinancial Sponsors
Example of IRR analysis for financial sponsor:
IRR to Financial Sponsor 12/31/08 12/31/09 12/31/10 12/31/11 12/31/12 12/31/13
Initial Equity Investment ($104.0) $0.0 $0.0 $0.0 $0.0 $0.0
Dividends 0.0 0.0 0.0 0.0 0.0 0.0
Proceeds at Sale 0.0 0.0 0.0 0.0 0.0 249.3
Total Cash Flows to Sponsor ($104.0) $0.0 $0.0 $0.0 $0.0 $249.3
IRR Calculation 19.1%
Copyright 2009
30.
Pop Quiz
TheIRR analysis accounts for:
a. Cash flows from the financial sponsor into
the company
b. Cash flows to the financial sponsor during
the holding period
c. Net proceeds to the sponsor following the
sale of the company
d. All of the above
Copyright 2009
31.
Pop Quiz
TheIRR analysis accounts for:
a. Cash flows from the financial sponsor into
the company
b. Cash flows to the financial sponsor during
the holding period
c. Net proceeds to the sponsor following the
sale of the company
d. All of the above
Copyright 2009
32.
I. Uses forAn LBO Model
II. Construction of LBO Model
III. IRR Analysis
IV. Q&A
Copyright 2009
33.
Q&A
Q: When isthe LBO considered an
appropriate method over other
financing options?
Copyright 2009
34.
Q&A
Q: How havecurrent market
conditions affected the LBO
model?
Copyright 2009
About Investment BankingInstitute
The Investment Banking Institute (IBI), with offices in 14 cities
throughout North America and Europe, conducts corporate as
well as individual training for candidates ranging from
Managing Directors to MBAs to College Undergrads and other
professionals seeking to enter the industry. Since our inception
in 2002, IBI has offered the most comprehensive course
syllabus and longest running program available
IBI conducts more individual based programs in more cities
than any other firm. Last year alone (2008) we held over 700
sessions worldwide for more than 2000 live training hours;
moreover, our bankers/instructors possess a combined 129
years of I-banking and/or PE experience
Copyright 2009
40.
About Investment BankingInstitute
IBI is affiliated with the CFA Institute, NASBA (the national
association of the state boards of accountancy –overseeing
CPAs), and the CFP Board
IBI has trained analysts and associates for hundreds of
organizations (a partial list can be viewed on our website), the
in-class training we provide our individual students is the same
exact training provided to corporate clients
Interview preparation, resume revision, and job contacts are
available through our Human Resources division on a one-on-
one basis with no set expiration date
The training program can be repeated free of charge at any
future date to ensure your skills are sharp when you need them
to be
Seasoned Investment Bankers are available for help outside of
class whenever needed
Copyright 2009
41.
Investment Banking Institute Student Testimonial
I am so thankful for the class I took at the Investment Banking Institute. It was both
an enriching knowledge vault and a confidence booster!
Your walkthrough of the DCF calculations was an excellent refresher. While I still
remember bits and pieces of how DCF works from my on-campus interviews back in
college and work at JP Morgan, your presentation helped to consolidate everything
in my mind. I also appreciate how you tied things back to an estimate of the
company's stock price at the end -- I actually once got an interview question on that
exact topic! The details and examples of the LBO modeling were extremely helpful,
and the encouragement you gave students throughout the class was equally
invaluable.
A huge thank-you for your insight into current market conditions, and on how the
subprime crisis actually unfolded. Although I manage to gain exposure to
macroeconomic and market valuation issues at work every day at JP Morgan, it was
your engaging, concise teaching method and holistic approach to the course that
put everything in perspective for me.
I will definitely recommend your course to my future classmates at Harvard Business
School as I am sure they will benefit tremendously from it.
Thank you very much.
Anthony, Boston
Copyright 2009
42.
Investment Banking Institute
Please visit us at
www.ibtraining.com
For company information, banker’s bios, and contact
information for any of our local offices
Headquarters:
The Helmsley Building
230 Park Avenue, 10th Floor
New York, NY 10169
212-380-7027
Copyright 2009