Download as PDF, PPTX


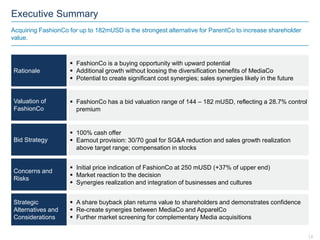
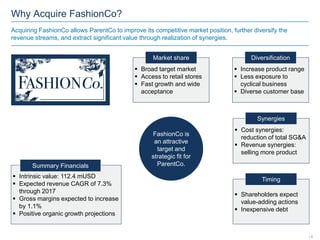
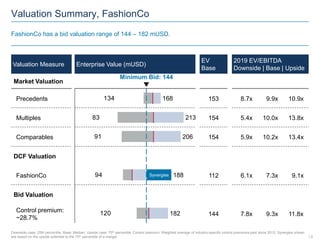
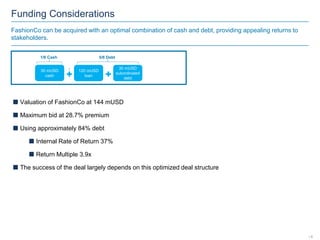
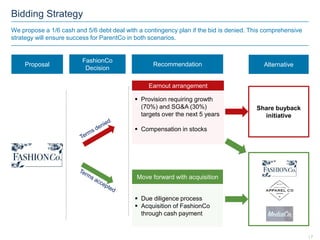
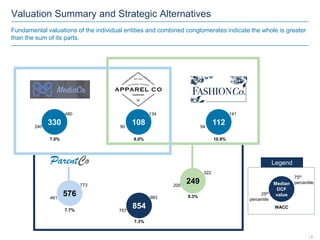
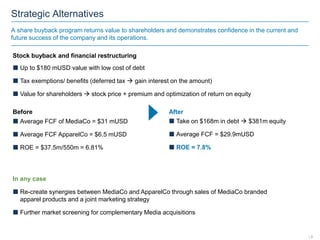


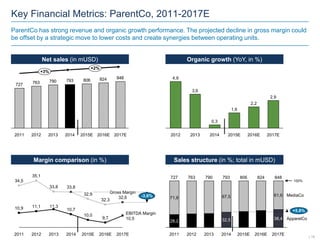
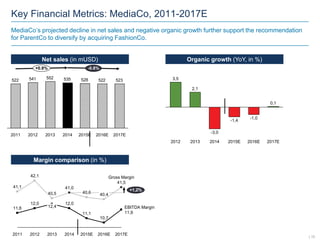
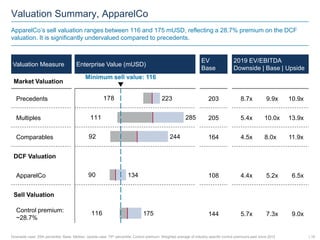


The document presents a detailed analysis on the acquisition of FashionCo by ParentCo for up to 182 million USD, outlining the strategic benefits and financial implications of the deal. It underscores the potential for significant cost and sales synergies, diversification of revenue streams, and improved competitive positioning for ParentCo. Key financial metrics, such as expected revenue growth and modest increase in gross margins, support the rationale for the acquisition.


