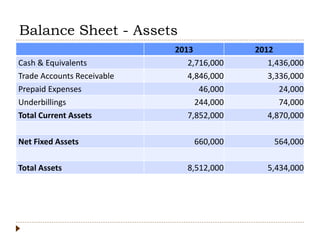
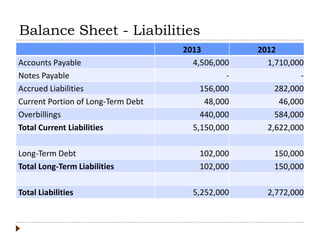
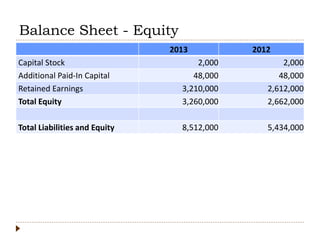
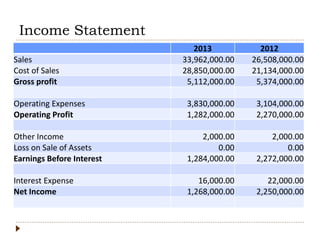
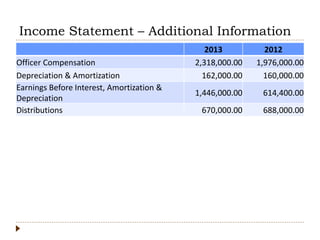
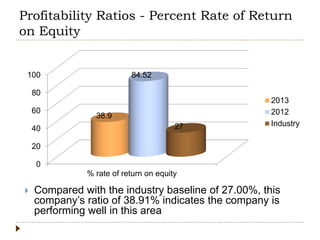
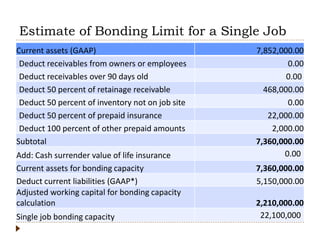
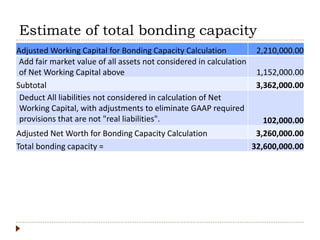
Construction Financial Issues
December 10, 2014
Agenda
 Goal of session
 Case study
 Other considerations
 Future sessions
Balance Sheet - Assets
2013 2012
Cash & Equivalents 2,716,000 1,436,000
Trade Accounts Receivable 4,846,000 3,336,000
Prepaid Expenses 46,000 24,000
Underbillings 244,000 74,000
Total Current Assets 7,852,000 4,870,000
Net Fixed Assets 660,000 564,000
Total Assets 8,512,000 5,434,000
Balance Sheet - Liabilities
2013 2012
Accounts Payable 4,506,000 1,710,000
Notes Payable - -
Accrued Liabilities 156,000 282,000
Current Portion of Long-Term Debt 48,000 46,000
Overbillings 440,000 584,000
Total Current Liabilities 5,150,000 2,622,000
Long-Term Debt 102,000 150,000
Total Long-Term Liabilities 102,000 150,000
Total Liabilities 5,252,000 2,772,000
Balance Sheet - Equity
2013 2012
Capital Stock 2,000 2,000
Additional Paid-In Capital 48,000 48,000
Retained Earnings 3,210,000 2,612,000
Total Equity 3,260,000 2,662,000
Total Liabilities and Equity 8,512,000 5,434,000
Income Statement
2013 2012
Sales 33,962,000.00 26,508,000.00
Cost of Sales 28,850,000.00 21,134,000.00
Gross profit 5,112,000.00 5,374,000.00
Operating Expenses 3,830,000.00 3,104,000.00
Operating Profit 1,282,000.00 2,270,000.00
Other Income 2,000.00 2,000.00
Loss on Sale of Assets 0.00 0.00
Earnings Before Interest 1,284,000.00 2,272,000.00
Interest Expense 16,000.00 22,000.00
Net Income 1,268,000.00 2,250,000.00
Income Statement – Additional Information
2013 2012
Officer Compensation 2,318,000.00 1,976,000.00
Depreciation & Amortization 162,000.00 160,000.00
Earnings Before Interest, Amortization &
Depreciation
1,446,000.00 614,400.00
Distributions 670,000.00 688,000.00
Liquidity Ratios
 Measure a company’s ability to meet short term
obligations
 Can assets be quickly converted to cash?
 Critical in industries where cash flow is unsteady
 Key predictor of a company’s ability to make timely
debt service payments
Liquidity Ratios – Current Ratio
2013 2012 Industry
Current Ratio 1.52 1.86 1.60
Current Assets/Current Liabilities
Liquidity Ratios – Current Ratio
0
0.5
1
1.5
2
Current ratio
1.52
1.86
1.6
2013
2012
Industry
 Compared with the industry baseline of 1.6, this
company’s ratio of 1.52 indicates its ability to service
short-term obligations is not satisfactory
Liquidity Ratios – Quick Ratio
2013 2012 Industry
Quick Ratio 1.47 1.82 1.40
(Cash + Marketable Securities + Trade
Accounts Receivable)/Current Liabilities
Liquidity Ratios – Quick Ratio
0
0.5
1
1.5
2
Quick ratio
1.47
1.82
1.4
2013
2012
Industry
 Compared with the industry baseline of 1.4, this
company’s ratio of 1.47 indicates its ability to service
short-term obligations is favorable
Liquidity Ratios – Sales to Working Capital
2013 2012 Industry
Sales to Working Capital 12.57 11.79 12.40
Sales/(Current Assets - Current Liabilities)
Liquidity Ratios – Sales to Working Capital
11.4
11.6
11.8
12
12.2
12.4
12.6
Sales to working capital
12.57
11.79
12.4
2013
2012
Industry
 Compared with the industry baseline of 12.40, this
company’s ratio of 12.57 reveals the company’s level of
working capital is strong
Activity Ratios
 Gauge a company’s operations
 Based on account balances on a single day
 Seasonal fluctuations not necessarily reflected
Activity Ratios – A/R Turnover
2013 2012 Industry
Accounts Receivable Turnover 7.01 7.95 6.70
Sales /Trade Accounts Receivable
Activity Ratios – A/R Turnover
6
6.5
7
7.5
8
A/R turnover
7.01
7.95
6.7
2013
2012
Industry
 Compared with the industry baseline of 6.70, this
company’s ratio of 7.01 is on target with company
objectives
Activity Ratios – Days Sales in Receivables
2013 2012 Industry
Days Sales in Receivables 52.08 45.93 54.00
Trade Accounts Receivable/(Sales/Days)
Activity Ratios – Days Sales in Receivables
40
42
44
46
48
50
52
54
Days sales in receivables
52.08
45.93
54
2013
2012
Industry
 This company’s ratio of 52.08 indicates it may not
be effective in collecting outstanding receivables
Activity Ratios – A/P Turnover
2013 2012 Industry
Accounts Payable Turnover 6.40 12.36 12.70
Cost of Sales/Trade Accounts Payable
Activity Ratios – A/P Turnover
0
2
4
6
8
10
12
14
A/P turnover
6.4
12.36 12.7
2013
2012
Industry
 Compared with the industry baseline of 12.70, this
company’s ratio of 6.40 indicates the company’s ability
to promptly pay creditors may need improvement
Activity Ratios – Sales to Assets
2013 2012 Industry
Sales to Assets 3.99 4.88 3.20
Sales /Total Assets
Activity Ratios – Sales to Assets
0
1
2
3
4
5
Sales to assets
3.99
4.88
3.2
2013
2012
Industry
 Compared with the industry baseline of 3.20, this
company’s ratio of 3.99 indicates the company is
performing well in this area
Profitability Ratios
 Measure a company’s ability to use its capital or
assets to generate profits
 Key component in determining success
 Based on earnings before taxes
Profitability Ratios - Percent Rate of Return
on Assets
2013 2012 Industry
Percent Rate of Return on Assets 14.90 41.41 9.20
Earnings before Taxes /Total Assets * 100
Profitability Ratios - Percent Rate of Return
on Assets
0
10
20
30
40
50
% rate of return on assets
14.9
41.41
9.2
2013
2012
Industry
 Compared with the industry baseline of 9.20%, this
company’s ratio of 14.90% indicates the company
successfully uses its asset base to generate profits
Profitability Ratios - Percent Rate of Return
on Equity
2013 2012 Industry
Percent Rate of Return on Equity 38.90 84.52 27.00
Earnings before Taxes/Total Equity * 100
Profitability Ratios - Percent Rate of Return
on Equity
0
20
40
60
80
100
% rate of return on equity
38.9
84.52
27
2013
2012
Industry
 Compared with the industry baseline of 27.00%, this
company’s ratio of 38.91% indicates the company is
performing well in this area
Coverage Ratios
 Assess a company’s ability to meet its long-term
obligations, remain solvent, and avoid bankruptcy
 Measures how well a company’s cash flow covers its
short-term financial obligations
 Assess vulnerability to economic downturns
 High debt levels pose higher risk to creditors
Coverage Ratios – Debt to Equity
2013 2012 Industry
Debt to Equity 1.61 1.04 1.50
Total Liabilities /Total Equity
Coverage Ratios – Debt to Equity
0
0.2
0.4
0.6
0.8
1
1.2
1.4
1.6
1.8
Debt to equity
1.61
1.04
1.5
2013
2012
Industry
 Compared with the industry baseline of 1.50, this
company’s ratio of 1.61 indicates there may be some
issues with the way the company is financed
Estimate of Bonding Limit for a Single Job
Current assets (GAAP) 7,852,000.00
Deduct receivables from owners or employees 0.00
Deduct receivables over 90 days old 0.00
Deduct 50 percent of retainage receivable 468,000.00
Deduct 50 percent of inventory not on job site 0.00
Deduct 50 percent of prepaid insurance 22,000.00
Deduct 100 percent of other prepaid amounts 2,000.00
Subtotal 7,360,000.00
Add: Cash surrender value of life insurance 0.00
Current assets for bonding capacity 7,360,000.00
Deduct current liabilities (GAAP*) 5,150,000.00
Adjusted working capital for bonding capacity
calculation 2,210,000.00
Single job bonding capacity 22,100,000
Estimate of total bonding capacity
Adjusted Working Capital for Bonding Capacity Calculation 2,210,000.00
Add fair market value of all assets not considered in calculation
of Net Working Capital above 1,152,000.00
Subtotal 3,362,000.00
Deduct All liabilities not considered in calculation of Net
Working Capital, with adjustments to eliminate GAAP required
provisions that are not "real liabilities". 102,000.00
Adjusted Net Worth for Bonding Capacity Calculation 3,260,000.00
Total bonding capacity = 32,600,000.00
Additional bonding considerations
 Estimated gross profit in backlog should be greater
than 50% of annual general and administrative
overhead
 Underbillings should not exceed 20% of Adjusted
Net Worth
 Net Quick Ratio should be greater than 1 to 1
 Total liabilities should be less than 3 times Adjusted
Net Worth
Additional bonding considerations – cont.
 Interest bearing debt should be less than 75% of
adjusted net worth
 Debt coverage should be at least 125%
 General and administrative overhead should be less
than 10% of contract revenue earned
 All other information should compare favorably to
industry averages or other benchmarking data
Other Resources
 National Association of Surety Bond Producers
 www.sio.org – general surety information
 www.suretylearn .org – for small, emerging contractors
Future sessions potential topics
 Quickbooks
 Independent contractor versus employee
 Internal controls
 Job costing schedules
 Loan covenants and how to effectively deal with
violations

REC presentation

  • 1.
  • 2.
    Agenda  Goal ofsession  Case study  Other considerations  Future sessions
  • 3.
    Balance Sheet -Assets 2013 2012 Cash & Equivalents 2,716,000 1,436,000 Trade Accounts Receivable 4,846,000 3,336,000 Prepaid Expenses 46,000 24,000 Underbillings 244,000 74,000 Total Current Assets 7,852,000 4,870,000 Net Fixed Assets 660,000 564,000 Total Assets 8,512,000 5,434,000
  • 4.
    Balance Sheet -Liabilities 2013 2012 Accounts Payable 4,506,000 1,710,000 Notes Payable - - Accrued Liabilities 156,000 282,000 Current Portion of Long-Term Debt 48,000 46,000 Overbillings 440,000 584,000 Total Current Liabilities 5,150,000 2,622,000 Long-Term Debt 102,000 150,000 Total Long-Term Liabilities 102,000 150,000 Total Liabilities 5,252,000 2,772,000
  • 5.
    Balance Sheet -Equity 2013 2012 Capital Stock 2,000 2,000 Additional Paid-In Capital 48,000 48,000 Retained Earnings 3,210,000 2,612,000 Total Equity 3,260,000 2,662,000 Total Liabilities and Equity 8,512,000 5,434,000
  • 6.
    Income Statement 2013 2012 Sales33,962,000.00 26,508,000.00 Cost of Sales 28,850,000.00 21,134,000.00 Gross profit 5,112,000.00 5,374,000.00 Operating Expenses 3,830,000.00 3,104,000.00 Operating Profit 1,282,000.00 2,270,000.00 Other Income 2,000.00 2,000.00 Loss on Sale of Assets 0.00 0.00 Earnings Before Interest 1,284,000.00 2,272,000.00 Interest Expense 16,000.00 22,000.00 Net Income 1,268,000.00 2,250,000.00
  • 7.
    Income Statement –Additional Information 2013 2012 Officer Compensation 2,318,000.00 1,976,000.00 Depreciation & Amortization 162,000.00 160,000.00 Earnings Before Interest, Amortization & Depreciation 1,446,000.00 614,400.00 Distributions 670,000.00 688,000.00
  • 8.
    Liquidity Ratios  Measurea company’s ability to meet short term obligations  Can assets be quickly converted to cash?  Critical in industries where cash flow is unsteady  Key predictor of a company’s ability to make timely debt service payments
  • 9.
    Liquidity Ratios –Current Ratio 2013 2012 Industry Current Ratio 1.52 1.86 1.60 Current Assets/Current Liabilities
  • 10.
    Liquidity Ratios –Current Ratio 0 0.5 1 1.5 2 Current ratio 1.52 1.86 1.6 2013 2012 Industry  Compared with the industry baseline of 1.6, this company’s ratio of 1.52 indicates its ability to service short-term obligations is not satisfactory
  • 11.
    Liquidity Ratios –Quick Ratio 2013 2012 Industry Quick Ratio 1.47 1.82 1.40 (Cash + Marketable Securities + Trade Accounts Receivable)/Current Liabilities
  • 12.
    Liquidity Ratios –Quick Ratio 0 0.5 1 1.5 2 Quick ratio 1.47 1.82 1.4 2013 2012 Industry  Compared with the industry baseline of 1.4, this company’s ratio of 1.47 indicates its ability to service short-term obligations is favorable
  • 13.
    Liquidity Ratios –Sales to Working Capital 2013 2012 Industry Sales to Working Capital 12.57 11.79 12.40 Sales/(Current Assets - Current Liabilities)
  • 14.
    Liquidity Ratios –Sales to Working Capital 11.4 11.6 11.8 12 12.2 12.4 12.6 Sales to working capital 12.57 11.79 12.4 2013 2012 Industry  Compared with the industry baseline of 12.40, this company’s ratio of 12.57 reveals the company’s level of working capital is strong
  • 15.
    Activity Ratios  Gaugea company’s operations  Based on account balances on a single day  Seasonal fluctuations not necessarily reflected
  • 16.
    Activity Ratios –A/R Turnover 2013 2012 Industry Accounts Receivable Turnover 7.01 7.95 6.70 Sales /Trade Accounts Receivable
  • 17.
    Activity Ratios –A/R Turnover 6 6.5 7 7.5 8 A/R turnover 7.01 7.95 6.7 2013 2012 Industry  Compared with the industry baseline of 6.70, this company’s ratio of 7.01 is on target with company objectives
  • 18.
    Activity Ratios –Days Sales in Receivables 2013 2012 Industry Days Sales in Receivables 52.08 45.93 54.00 Trade Accounts Receivable/(Sales/Days)
  • 19.
    Activity Ratios –Days Sales in Receivables 40 42 44 46 48 50 52 54 Days sales in receivables 52.08 45.93 54 2013 2012 Industry  This company’s ratio of 52.08 indicates it may not be effective in collecting outstanding receivables
  • 20.
    Activity Ratios –A/P Turnover 2013 2012 Industry Accounts Payable Turnover 6.40 12.36 12.70 Cost of Sales/Trade Accounts Payable
  • 21.
    Activity Ratios –A/P Turnover 0 2 4 6 8 10 12 14 A/P turnover 6.4 12.36 12.7 2013 2012 Industry  Compared with the industry baseline of 12.70, this company’s ratio of 6.40 indicates the company’s ability to promptly pay creditors may need improvement
  • 22.
    Activity Ratios –Sales to Assets 2013 2012 Industry Sales to Assets 3.99 4.88 3.20 Sales /Total Assets
  • 23.
    Activity Ratios –Sales to Assets 0 1 2 3 4 5 Sales to assets 3.99 4.88 3.2 2013 2012 Industry  Compared with the industry baseline of 3.20, this company’s ratio of 3.99 indicates the company is performing well in this area
  • 24.
    Profitability Ratios  Measurea company’s ability to use its capital or assets to generate profits  Key component in determining success  Based on earnings before taxes
  • 25.
    Profitability Ratios -Percent Rate of Return on Assets 2013 2012 Industry Percent Rate of Return on Assets 14.90 41.41 9.20 Earnings before Taxes /Total Assets * 100
  • 26.
    Profitability Ratios -Percent Rate of Return on Assets 0 10 20 30 40 50 % rate of return on assets 14.9 41.41 9.2 2013 2012 Industry  Compared with the industry baseline of 9.20%, this company’s ratio of 14.90% indicates the company successfully uses its asset base to generate profits
  • 27.
    Profitability Ratios -Percent Rate of Return on Equity 2013 2012 Industry Percent Rate of Return on Equity 38.90 84.52 27.00 Earnings before Taxes/Total Equity * 100
  • 28.
    Profitability Ratios -Percent Rate of Return on Equity 0 20 40 60 80 100 % rate of return on equity 38.9 84.52 27 2013 2012 Industry  Compared with the industry baseline of 27.00%, this company’s ratio of 38.91% indicates the company is performing well in this area
  • 29.
    Coverage Ratios  Assessa company’s ability to meet its long-term obligations, remain solvent, and avoid bankruptcy  Measures how well a company’s cash flow covers its short-term financial obligations  Assess vulnerability to economic downturns  High debt levels pose higher risk to creditors
  • 30.
    Coverage Ratios –Debt to Equity 2013 2012 Industry Debt to Equity 1.61 1.04 1.50 Total Liabilities /Total Equity
  • 31.
    Coverage Ratios –Debt to Equity 0 0.2 0.4 0.6 0.8 1 1.2 1.4 1.6 1.8 Debt to equity 1.61 1.04 1.5 2013 2012 Industry  Compared with the industry baseline of 1.50, this company’s ratio of 1.61 indicates there may be some issues with the way the company is financed
  • 32.
    Estimate of BondingLimit for a Single Job Current assets (GAAP) 7,852,000.00 Deduct receivables from owners or employees 0.00 Deduct receivables over 90 days old 0.00 Deduct 50 percent of retainage receivable 468,000.00 Deduct 50 percent of inventory not on job site 0.00 Deduct 50 percent of prepaid insurance 22,000.00 Deduct 100 percent of other prepaid amounts 2,000.00 Subtotal 7,360,000.00 Add: Cash surrender value of life insurance 0.00 Current assets for bonding capacity 7,360,000.00 Deduct current liabilities (GAAP*) 5,150,000.00 Adjusted working capital for bonding capacity calculation 2,210,000.00 Single job bonding capacity 22,100,000
  • 33.
    Estimate of totalbonding capacity Adjusted Working Capital for Bonding Capacity Calculation 2,210,000.00 Add fair market value of all assets not considered in calculation of Net Working Capital above 1,152,000.00 Subtotal 3,362,000.00 Deduct All liabilities not considered in calculation of Net Working Capital, with adjustments to eliminate GAAP required provisions that are not "real liabilities". 102,000.00 Adjusted Net Worth for Bonding Capacity Calculation 3,260,000.00 Total bonding capacity = 32,600,000.00
  • 34.
    Additional bonding considerations Estimated gross profit in backlog should be greater than 50% of annual general and administrative overhead  Underbillings should not exceed 20% of Adjusted Net Worth  Net Quick Ratio should be greater than 1 to 1  Total liabilities should be less than 3 times Adjusted Net Worth
  • 35.
    Additional bonding considerations– cont.  Interest bearing debt should be less than 75% of adjusted net worth  Debt coverage should be at least 125%  General and administrative overhead should be less than 10% of contract revenue earned  All other information should compare favorably to industry averages or other benchmarking data
  • 36.
    Other Resources  NationalAssociation of Surety Bond Producers  www.sio.org – general surety information  www.suretylearn .org – for small, emerging contractors
  • 37.
    Future sessions potentialtopics  Quickbooks  Independent contractor versus employee  Internal controls  Job costing schedules  Loan covenants and how to effectively deal with violations