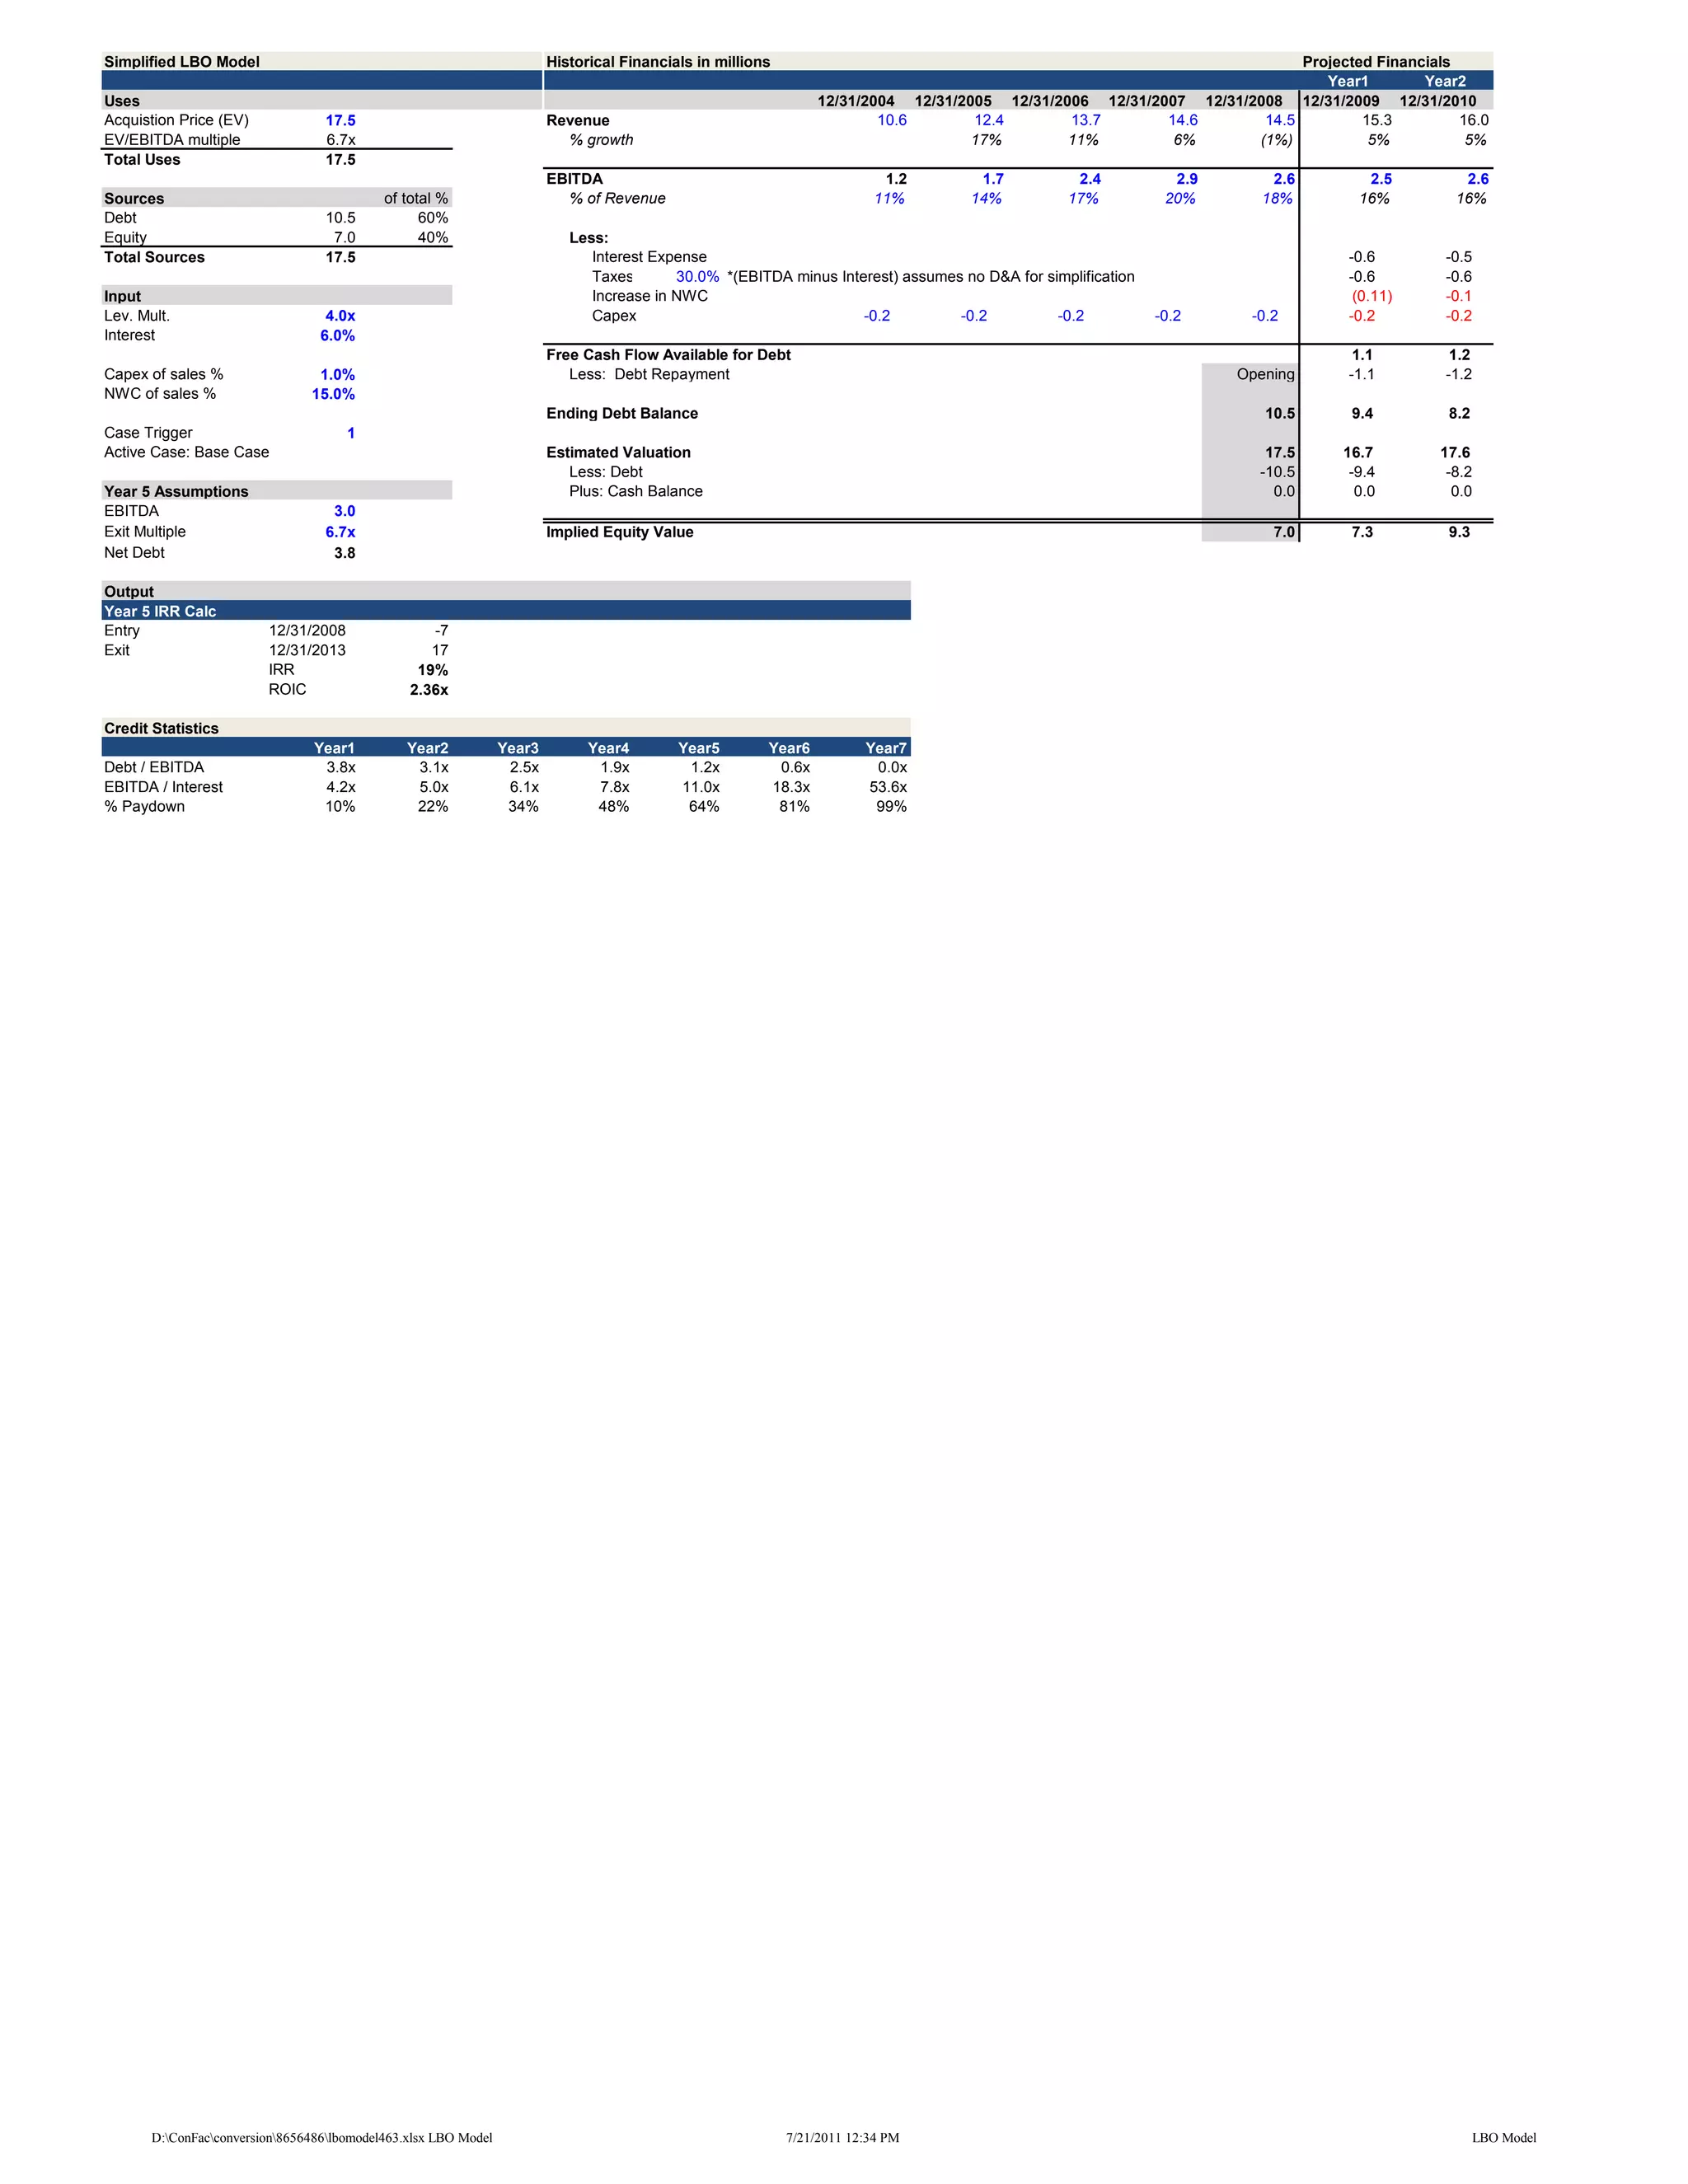
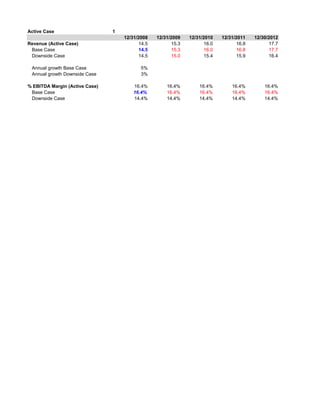
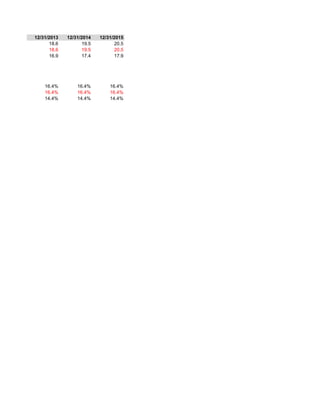
Simplified LBO Model                                                     Historical Financials in millions                                                                Projected Financials
                                                                                                                                                                             Year1        Year2
Uses                                                                                                             12/31/2004 12/31/2005 12/31/2006 12/31/2007 12/31/2008 12/31/2009 12/31/2010
Acquistion Price (EV)              17.5                                  Revenue                                         10.6       12.4       13.7       14.6       14.5         15.3         16.0
EV/EBITDA multiple                 6.7x                                    % growth                                                 17%        11%         6%       (1%)           5%           5%
Total Uses                         17.5
                                                                         EBITDA                                            1.2       1.7          2.4           2.9       2.6       2.5         2.6
Sources                                     of total %                     % of Revenue                                   11%       14%          17%           20%       18%       16%         16%
Debt                               10.5           60%
Equity                              7.0           40%                       Less:
Total Sources                      17.5                                        Interest Expense                                                                                  -0.6        -0.5
                                                                               Taxes       30.0% *(EBITDA minus Interest) assumes no D&A for simplification                      -0.6        -0.6
Input                                                                          Increase in NWC                                                                                    (0.11)     -0.1
Lev. Mult.                         4.0x                                        Capex                                -0.2         -0.2          -0.2           -0.2     -0.2      -0.2        -0.2
Interest                          6.0%
                                                                         Free Cash Flow Available for Debt                                                                        1.1         1.2
Capex of sales %                 1.0%                                       Less: Debt Repayment                                                                      Opening    -1.1        -1.2
NWC of sales %                  15.0%
                                                                         Ending Debt Balance                                                                             10.5     9.4         8.2
Case Trigger                          1
Active Case: Base Case                                                   Estimated Valuation                                                                             17.5    16.7        17.6
                                                                            Less: Debt                                                                                  -10.5     -9.4        -8.2
Year 5 Assumptions                                                          Plus: Cash Balance                                                                            0.0      0.0         0.0
EBITDA                              3.0
Exit Multiple                      6.7x                                  Implied Equity Value                                                                             7.0     7.3         9.3
Net Debt                            3.8

Output
Year 5 IRR Calc
Entry                    12/31/2008                -7
Exit                     12/31/2013                17
                         IRR                     19%
                         ROIC                   2.36x

Credit Statistics
                                 Year1          Year2            Year3         Year4        Year5        Year6           Year7
Debt / EBITDA                     3.8x           3.1x             2.5x          1.9x         1.2x         0.6x            0.0x
EBITDA / Interest                 4.2x           5.0x             6.1x          7.8x        11.0x        18.3x           53.6x
% Paydown                         10%            22%              34%           48%          64%          81%             99%


       D:ConFacconversion8656486lbomodel463.xlsx LBO Model                                               7/21/2011 12:34 PM                                                                     LBO Model
Year3      Year4      Year5      Year6      Year7      CAGR         CAGR
12/31/2011 12/30/2012 12/31/2013 12/31/2014 12/31/2015 '08 - '11    '08 - '11
        16.8       17.7       18.6       19.5       20.5         5%           5%
         5%         5%         5%         5%         5%

       2.8             2.9            3.0             3.2         3.4   2%   3%
      16%             16%            16%             16%         16%


     -0.5           -0.4            -0.3           -0.2        -0.1
     -0.7           -0.8            -0.8           -0.9        -1.0
     -0.1           -0.1            -0.1           -0.1        -0.1
     -0.2           -0.2            -0.2           -0.2        -0.2

      1.3            1.5             1.6            1.8         2.0
     -1.3           -1.5            -1.6           -1.8        -2.0

      6.9           5.4             3.8             2.0         0.1

    18.4           19.4            20.3           21.3         22.4
     -6.9           -5.4            -3.8           -2.0         -0.1
      0.0            0.0             0.0            0.0          0.0

    11.5           13.9            16.5           19.3         22.3


     D:ConFacconversion8656486lbomodel463.xlsx LBO Model                       7/21/2011 12:34 PM   LBO Model
Active Case                     1
                                    12/31/2008    12/31/2009    12/31/2010    12/31/2011    12/30/2012
Revenue (Active Case)                      14.5          15.3          16.0          16.8          17.7
 Base Case                                 14.5          15.3          16.0          16.8          17.7
 Downside Case                             14.5          15.0          15.4          15.9          16.4

 Annual growth Base Case                   5%
 Annual growth Downside Case               3%

% EBITDA Margin (Active Case)           16.4%         16.4%         16.4%         16.4%         16.4%
 Base Case                              16.4%         16.4%         16.4%         16.4%         16.4%
 Downside Case                          14.4%         14.4%         14.4%         14.4%         14.4%
12/31/2013    12/31/2014    12/31/2015
       18.6          19.5          20.5
       18.6          19.5          20.5
       16.9          17.4          17.9


    16.4%         16.4%         16.4%
    16.4%         16.4%         16.4%
    14.4%         14.4%         14.4%

lbo-model

  • 1.
    Simplified LBO Model Historical Financials in millions Projected Financials Year1 Year2 Uses 12/31/2004 12/31/2005 12/31/2006 12/31/2007 12/31/2008 12/31/2009 12/31/2010 Acquistion Price (EV) 17.5 Revenue 10.6 12.4 13.7 14.6 14.5 15.3 16.0 EV/EBITDA multiple 6.7x % growth 17% 11% 6% (1%) 5% 5% Total Uses 17.5 EBITDA 1.2 1.7 2.4 2.9 2.6 2.5 2.6 Sources of total % % of Revenue 11% 14% 17% 20% 18% 16% 16% Debt 10.5 60% Equity 7.0 40% Less: Total Sources 17.5 Interest Expense -0.6 -0.5 Taxes 30.0% *(EBITDA minus Interest) assumes no D&A for simplification -0.6 -0.6 Input Increase in NWC (0.11) -0.1 Lev. Mult. 4.0x Capex -0.2 -0.2 -0.2 -0.2 -0.2 -0.2 -0.2 Interest 6.0% Free Cash Flow Available for Debt 1.1 1.2 Capex of sales % 1.0% Less: Debt Repayment Opening -1.1 -1.2 NWC of sales % 15.0% Ending Debt Balance 10.5 9.4 8.2 Case Trigger 1 Active Case: Base Case Estimated Valuation 17.5 16.7 17.6 Less: Debt -10.5 -9.4 -8.2 Year 5 Assumptions Plus: Cash Balance 0.0 0.0 0.0 EBITDA 3.0 Exit Multiple 6.7x Implied Equity Value 7.0 7.3 9.3 Net Debt 3.8 Output Year 5 IRR Calc Entry 12/31/2008 -7 Exit 12/31/2013 17 IRR 19% ROIC 2.36x Credit Statistics Year1 Year2 Year3 Year4 Year5 Year6 Year7 Debt / EBITDA 3.8x 3.1x 2.5x 1.9x 1.2x 0.6x 0.0x EBITDA / Interest 4.2x 5.0x 6.1x 7.8x 11.0x 18.3x 53.6x % Paydown 10% 22% 34% 48% 64% 81% 99% D:ConFacconversion8656486lbomodel463.xlsx LBO Model 7/21/2011 12:34 PM LBO Model
  • 2.
    Year3 Year4 Year5 Year6 Year7 CAGR CAGR 12/31/2011 12/30/2012 12/31/2013 12/31/2014 12/31/2015 '08 - '11 '08 - '11 16.8 17.7 18.6 19.5 20.5 5% 5% 5% 5% 5% 5% 5% 2.8 2.9 3.0 3.2 3.4 2% 3% 16% 16% 16% 16% 16% -0.5 -0.4 -0.3 -0.2 -0.1 -0.7 -0.8 -0.8 -0.9 -1.0 -0.1 -0.1 -0.1 -0.1 -0.1 -0.2 -0.2 -0.2 -0.2 -0.2 1.3 1.5 1.6 1.8 2.0 -1.3 -1.5 -1.6 -1.8 -2.0 6.9 5.4 3.8 2.0 0.1 18.4 19.4 20.3 21.3 22.4 -6.9 -5.4 -3.8 -2.0 -0.1 0.0 0.0 0.0 0.0 0.0 11.5 13.9 16.5 19.3 22.3 D:ConFacconversion8656486lbomodel463.xlsx LBO Model 7/21/2011 12:34 PM LBO Model
  • 3.
    Active Case 1 12/31/2008 12/31/2009 12/31/2010 12/31/2011 12/30/2012 Revenue (Active Case) 14.5 15.3 16.0 16.8 17.7 Base Case 14.5 15.3 16.0 16.8 17.7 Downside Case 14.5 15.0 15.4 15.9 16.4 Annual growth Base Case 5% Annual growth Downside Case 3% % EBITDA Margin (Active Case) 16.4% 16.4% 16.4% 16.4% 16.4% Base Case 16.4% 16.4% 16.4% 16.4% 16.4% Downside Case 14.4% 14.4% 14.4% 14.4% 14.4%
  • 4.
    12/31/2013 12/31/2014 12/31/2015 18.6 19.5 20.5 18.6 19.5 20.5 16.9 17.4 17.9 16.4% 16.4% 16.4% 16.4% 16.4% 16.4% 14.4% 14.4% 14.4%