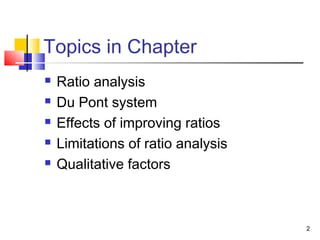
Topics in Chapter
Ratio analysis
Du Pont system
Effects of improving ratios
Limitations of ratio analysis
Qualitative factors
2
3.
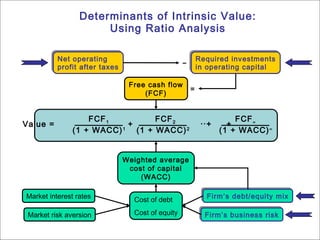
Determinants of IntrinsicValue:
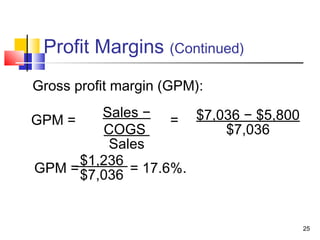
Using Ratio Analysis
Net operating
Net operating Required investments
Required investments
profit after taxes − in operating capital
profit after taxes in operating capital
Free cash flow
=
(FCF)
FCF 1 FCF 2 ... FCF ∞
Value = + + +
(1 + WACC) 1 (1 + WACC) 2 (1 + WACC) ∞
Weighted average
cost of capital
(WACC)
Market interest rates Firm’s debt/equity mix
Firm’s debt/equity mix
Cost of debt
Market risk aversion Cost of equity Firm’s business risk
Firm’s business risk
3
4.
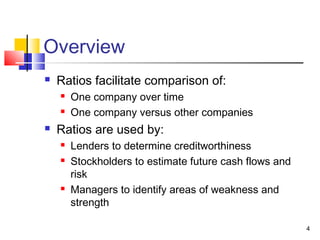
Overview
Ratios facilitate comparison of:
One company over time
One company versus other companies
Ratios are used by:
Lenders to determine creditworthiness
Stockholders to estimate future cash flows and
risk
Managers to identify areas of weakness and
strength
4
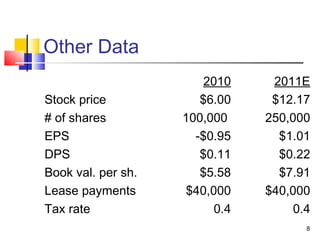
Other Data
2010 2011E
Stock price $6.00 $12.17
# of shares 100,000 250,000
EPS -$0.95 $1.01
DPS $0.11 $0.22
Book val. per sh. $5.58 $7.91
Lease payments $40,000 $40,000
Tax rate 0.4 0.4
8
9.
Liquidity Ratios
Can the company meet its short-term
obligations using the resources it
currently has on hand?
9
10.
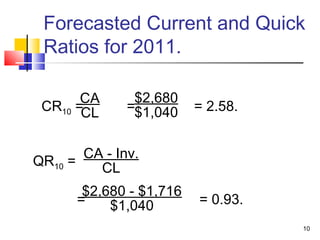
Forecasted Current andQuick
Ratios for 2011.
CA $2,680
CR10 =CL =$1,040 = 2.58.
CA - Inv.
QR10 = CL
$2,680 - $1,716
= $1,040 = 0.93.
10
11.
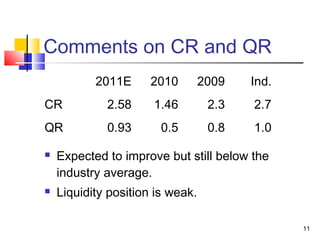
Comments on CRand QR
2011E 2010 2009 Ind.
CR 2.58 1.46 2.3 2.7
QR 0.93 0.5 0.8 1.0
Expected to improve but still below the
industry average.
Liquidity position is weak.
11
12.
Asset Management Ratios
How efficiently does the firm use its
assets?
How much does the firm have tied up in
assets for each dollar of sales?
12
13.
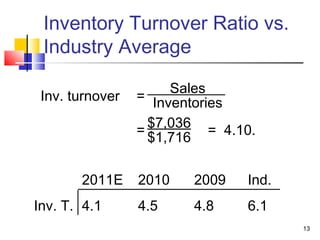
Inventory Turnover Ratiovs.
Industry Average
Sales
Inv. turnover = Inventories
$7,036
= = 4.10.
$1,716
2011E 2010 2009 Ind.
Inv. T. 4.1 4.5 4.8 6.1
13
14.
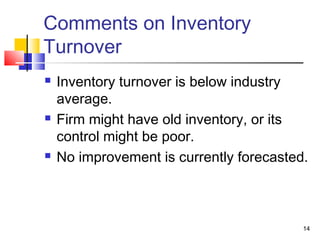
Comments on Inventory
Turnover
Inventory turnover is below industry
average.
Firm might have old inventory, or its
control might be poor.
No improvement is currently forecasted.
14
15.
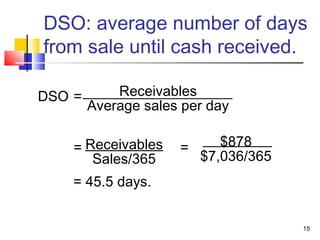
DSO: average numberof days
from sale until cash received.
DSO = Receivables
Average sales per day
= Receivables = $878
Sales/365 $7,036/365
= 45.5 days.
15
16.
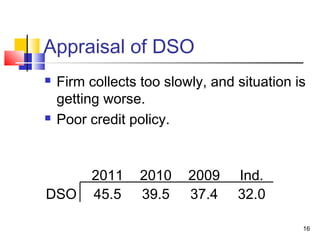
Appraisal of DSO
Firm collects too slowly, and situation is
getting worse.
Poor credit policy.
2011 2010 2009 Ind.
DSO 45.5 39.5 37.4 32.0
16
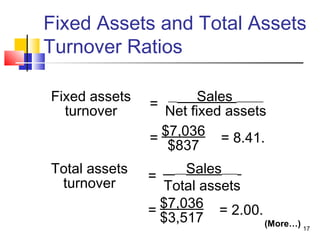
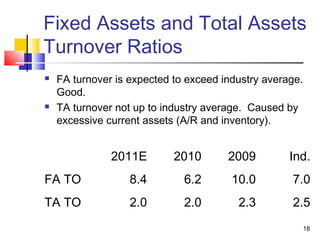
Fixed Assets andTotal Assets
Turnover Ratios
FA turnover is expected to exceed industry average.
Good.
TA turnover not up to industry average. Caused by
excessive current assets (A/R and inventory).
2011E 2010 2009 Ind.
FA TO 8.4 6.2 10.0 7.0
TA TO 2.0 2.0 2.3 2.5
18
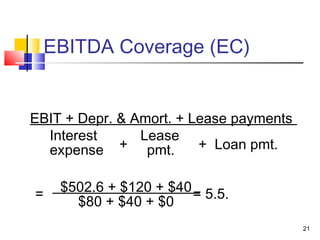
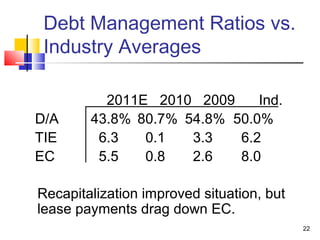
19.
Debt Management Ratios
Does the company have too much
debt?
Can the company’s earnings meet its
debt servicing requirements?
19
20.
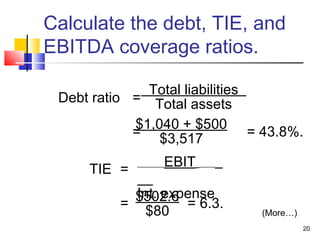
Calculate the debt,TIE, and
EBITDA coverage ratios.
Total liabilities
Debt ratio = Total assets
$1,040 + $500
= $3,517 = 43.8%.
EBIT
TIE =
Int. expense
$502.6 = 6.3.
=
$80 (More…)
20
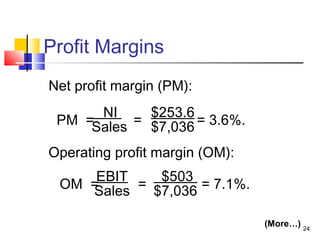
Profit Margins vs.Industry
Averages
2011E 2010 2009 Ind.
PM 3.6% -1.6% 2.6% 3.6%
OPM 7.1 0.3 6.1 7.1
GPM 17.6 14.6 16.6 15.5
Very bad in 2010, but projected to
meet or exceed industry average in
2011.
26
27.
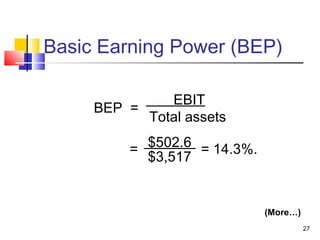
Basic Earning Power(BEP)
EBIT
BEP =
Total assets
= $502.6 = 14.3%.
$3,517
(More…)
27
28.
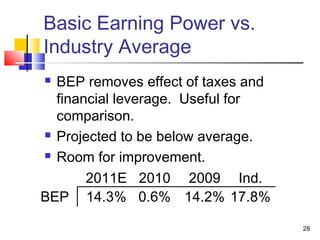
Basic Earning Powervs.
Industry Average
BEP removes effect of taxes and
financial leverage. Useful for
comparison.
Projected to be below average.
Room for improvement.
2011E 2010 2009 Ind.
BEP 14.3% 0.6% 14.2% 17.8%
28
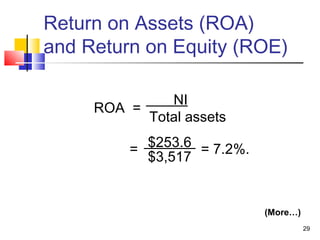
29.
Return on Assets(ROA)
and Return on Equity (ROE)
NI
ROA =
Total assets
= $253.6 = 7.2%.
$3,517
(More…)
29
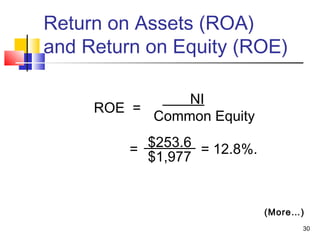
30.
Return on Assets(ROA)
and Return on Equity (ROE)
NI
ROE =
Common Equity
= $253.6 = 12.8%.
$1,977
(More…)
30
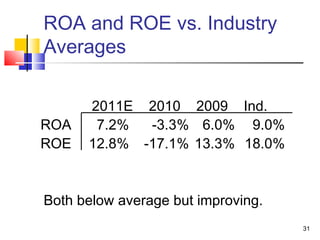
31.
ROA and ROEvs. Industry
Averages
2011E 2010 2009 Ind.
ROA 7.2% -3.3% 6.0% 9.0%
ROE 12.8% -17.1% 13.3% 18.0%
Both below average but improving.
31
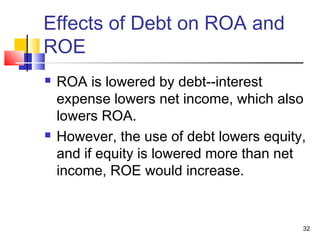
32.
Effects of Debton ROA and
ROE
ROA is lowered by debt--interest
expense lowers net income, which also
lowers ROA.
However, the use of debt lowers equity,
and if equity is lowered more than net
income, ROE would increase.
32
33.
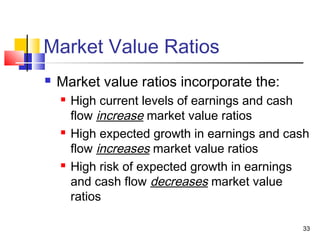
Market Value Ratios
Market value ratios incorporate the:
High current levels of earnings and cash
flow increase market value ratios
High expected growth in earnings and cash
flow increases market value ratios
High risk of expected growth in earnings
and cash flow decreases market value
ratios
33
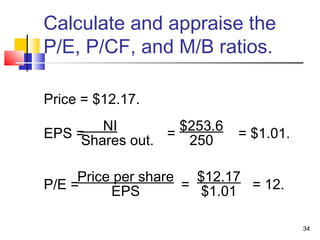
34.
Calculate and appraisethe
P/E, P/CF, and M/B ratios.
Price = $12.17.
NI $253.6
EPS =Shares out. = 250 = $1.01.
Price per share $12.17
P/E = EPS = $1.01 = 12.
34
35.
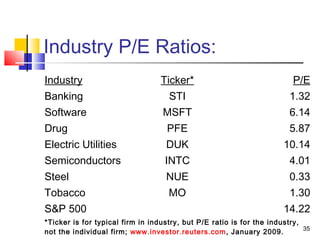
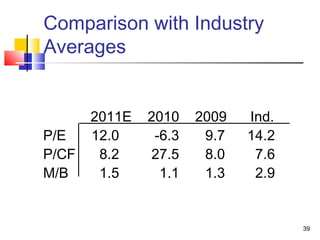
Industry P/E Ratios:
Industry Ticker* P/E
Banking STI 1.32
Software MSFT 6.14
Drug PFE 5.87
Electric Utilities DUK 10.14
Semiconductors INTC 4.01
Steel NUE 0.33
Tobacco MO 1.30
S&P 500 14.22
*Ticker is for typical firm in industry, but P/E ratio is for the industry,
35
not the individual firm; www.investor.reuters.com, January 2009.
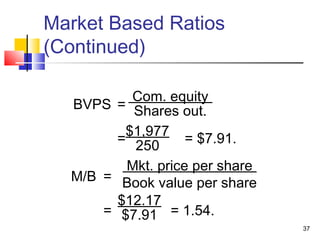
36.
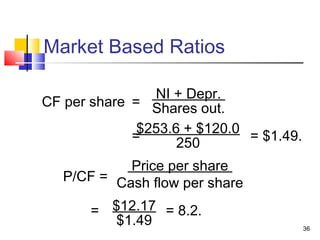
Market Based Ratios
NI + Depr.
CF per share = Shares out.
$253.6 + $120.0
= 250 = $1.49.
Price per share
P/CF = Cash flow per share
= $12.17 = 8.2.
$1.49 36
37.
Market Based Ratios
(Continued)
Com. equity
BVPS = Shares out.
$1,977
= 250 = $7.91.
Mkt. price per share
M/B = Book value per share
$12.17
= $7.91 = 1.54.
37
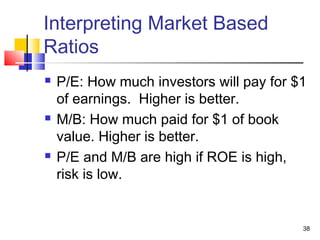
38.
Interpreting Market Based
Ratios
P/E: How much investors will pay for $1
of earnings. Higher is better.
M/B: How much paid for $1 of book
value. Higher is better.
P/E and M/B are high if ROE is high,
risk is low.
38
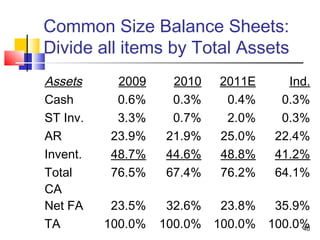
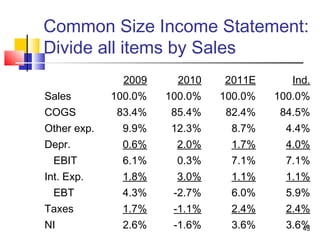
Common Size BalanceSheets:
Divide all items by Total Assets
Assets 2009 2010 2011E Ind.
Cash 0.6% 0.3% 0.4% 0.3%
ST Inv. 3.3% 0.7% 2.0% 0.3%
AR 23.9% 21.9% 25.0% 22.4%
Invent. 48.7% 44.6% 48.8% 41.2%
Total 76.5% 67.4% 76.2% 64.1%
CA
Net FA 23.5% 32.6% 23.8% 35.9%
TA 100.0% 100.0% 100.0% 100.0%
40
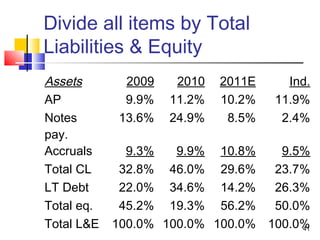
41.
Divide all itemsby Total
Liabilities & Equity
Assets 2009 2010 2011E Ind.
AP 9.9% 11.2% 10.2% 11.9%
Notes 13.6% 24.9% 8.5% 2.4%
pay.
Accruals 9.3% 9.9% 10.8% 9.5%
Total CL 32.8% 46.0% 29.6% 23.7%
LT Debt 22.0% 34.6% 14.2% 26.3%
Total eq. 45.2% 19.3% 56.2% 50.0%
Total L&E 100.0% 100.0% 100.0% 100.0%
41
42.
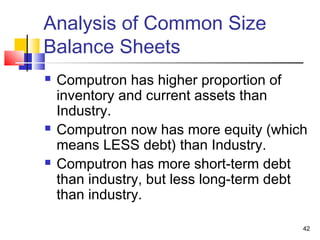
Analysis of CommonSize
Balance Sheets
Computron has higher proportion of
inventory and current assets than
Industry.
Computron now has more equity (which
means LESS debt) than Industry.
Computron has more short-term debt
than industry, but less long-term debt
than industry.
42
Analysis of CommonSize
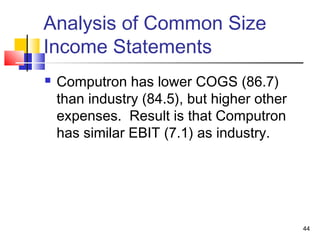
Income Statements
Computron has lower COGS (86.7)
than industry (84.5), but higher other
expenses. Result is that Computron
has similar EBIT (7.1) as industry.
44
45.
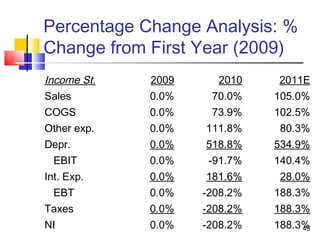
Percentage Change Analysis:%
Change from First Year (2009)
Income St. 2009 2010 2011E
Sales 0.0% 70.0% 105.0%
COGS 0.0% 73.9% 102.5%
Other exp. 0.0% 111.8% 80.3%
Depr. 0.0% 518.8% 534.9%
EBIT 0.0% -91.7% 140.4%
Int. Exp. 0.0% 181.6% 28.0%
EBT 0.0% -208.2% 188.3%
Taxes 0.0% -208.2% 188.3%
NI 0.0% -208.2% 188.3%
45
46.
Analysis of PercentChange
Income Statement
We see that 2011 sales grew 105%
from 2009, and that NI grew 188% from
2009.
So Computron has become more
profitable.
46
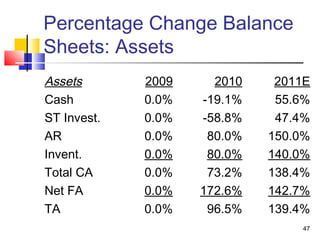
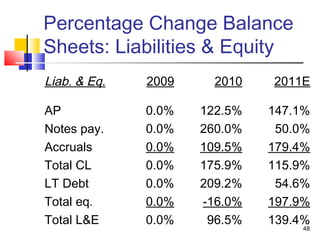
47.
Percentage Change Balance
Sheets:Assets
Assets 2009 2010 2011E
Cash 0.0% -19.1% 55.6%
ST Invest. 0.0% -58.8% 47.4%
AR 0.0% 80.0% 150.0%
Invent. 0.0% 80.0% 140.0%
Total CA 0.0% 73.2% 138.4%
Net FA 0.0% 172.6% 142.7%
TA 0.0% 96.5% 139.4%
47
Analysis of PercentChange
Balance Sheets
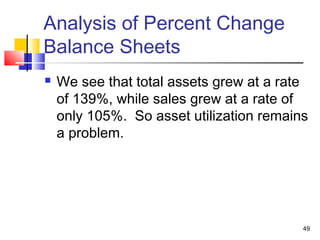
We see that total assets grew at a rate
of 139%, while sales grew at a rate of
only 105%. So asset utilization remains
a problem.
49
50.
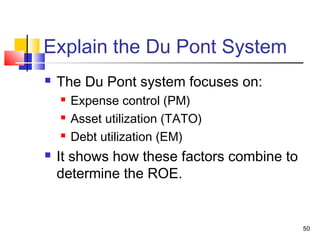
Explain the DuPont System
The Du Pont system focuses on:
Expense control (PM)
Asset utilization (TATO)
Debt utilization (EM)
It shows how these factors combine to
determine the ROE.
50
51.
The Du PontSystem
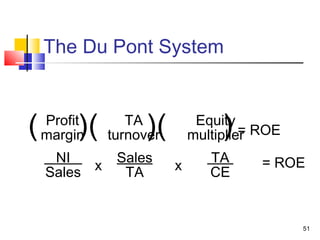
( )(
Profit
margin
TA
)(
turnover )
Equity
multiplier ROE
=
NI Sales TA = ROE
Sales x TA x CE
51
52.
The Du PontSystem
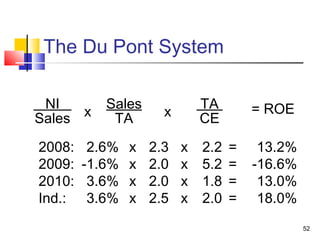
NI Sales TA = ROE
Sales x TA x CE
2008: 2.6% x 2.3 x 2.2 = 13.2%
2009: -1.6% x 2.0 x 5.2 = -16.6%
2010: 3.6% x 2.0 x 1.8 = 13.0%
Ind.: 3.6% x 2.5 x 2.0 = 18.0%
52
53.
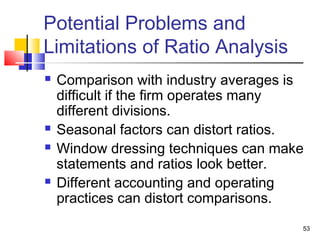
Potential Problems and
Limitationsof Ratio Analysis
Comparison with industry averages is
difficult if the firm operates many
different divisions.
Seasonal factors can distort ratios.
Window dressing techniques can make
statements and ratios look better.
Different accounting and operating
practices can distort comparisons.
53
54.
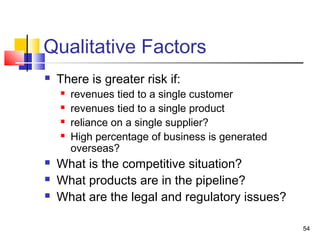
Qualitative Factors
There is greater risk if:
revenues tied to a single customer
revenues tied to a single product
reliance on a single supplier?
High percentage of business is generated
overseas?
What is the competitive situation?
What products are in the pipeline?
What are the legal and regulatory issues?
54