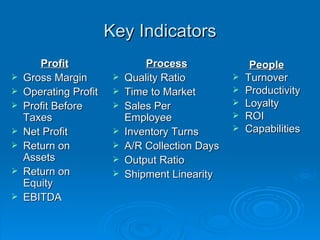
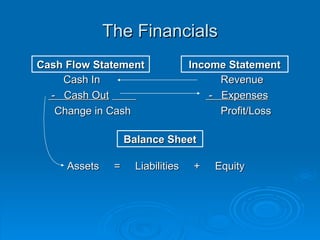
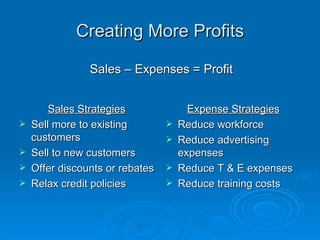
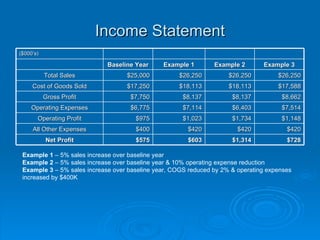
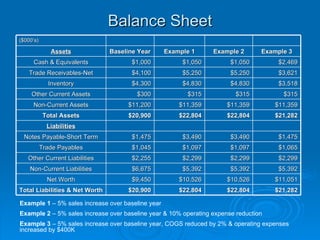
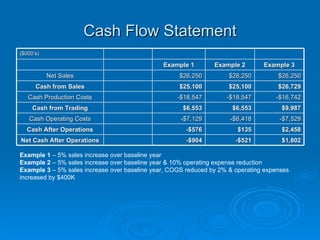
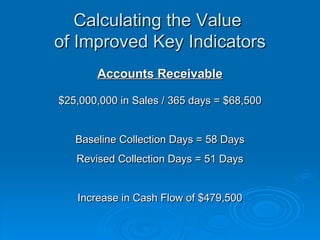
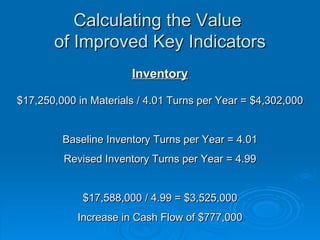
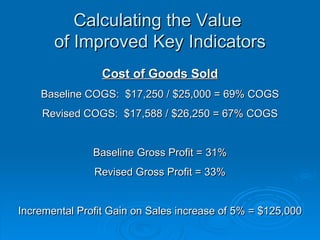
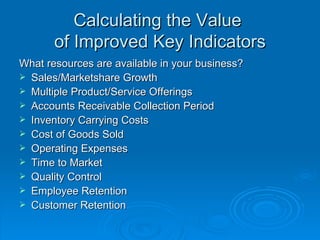
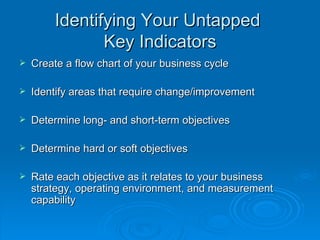
Increasing the  Enterprise Value  of Your Business Bob Dawson, Founder The Business Group
Program Objectives Identify key indicators that can add value to your business Develop tools to measure your key indicators Create strategies to optimize your key indicators
Key Indicators Profit Gross Margin Operating Profit Profit Before Taxes Net Profit Return on Assets Return on Equity EBITDA Process Quality Ratio Time to Market Sales Per Employee Inventory Turns A/R Collection Days Output Ratio Shipment Linearity People Turnover Productivity Loyalty ROI Capabilities
The Financials Cash Flow Statement Income Statement Balance Sheet Revenue -  Expenses Profit/Loss Cash In -  Cash Out   Change in Cash Assets  =  Liabilities  +  Equity
Creating More Profits Sales Strategies Sell more to existing customers Sell to new customers Offer discounts or rebates Relax credit policies Expense Strategies Reduce workforce Reduce advertising expenses Reduce T & E expenses Reduce training costs Sales – Expenses = Profit
Income Statement Example 1  – 5% sales increase over baseline year  Example 2  – 5% sales increase over baseline year & 10% operating expense reduction  Example 3  – 5% sales increase over baseline year, COGS reduced by 2% & operating expenses increased by $400K ($000’s) Baseline Year Example 1 Example 2 Example 3 Total Sales $25,000 $26,250 $26,250 $26,250 Cost of Goods Sold $17,250 $18,113 $18,113 $17,588 Gross Profit $7,750 $8,137 $8,137 $8,662 Operating Expenses $6,775 $7,114 $6,403 $7,514 Operating Profit $975 $1,023 $1,734 $1,148 All Other Expenses $400 $420 $420 $420 Net Profit $575 $603 $1,314 $728
Balance Sheet Example 1  – 5% sales increase over baseline year  Example 2  – 5% sales increase over baseline year & 10% operating expense reduction  Example 3  – 5% sales increase over baseline year, COGS reduced by 2% & operating expenses increased by $400K ($000’s) Assets Baseline Year Example 1 Example 2 Example 3 Cash & Equivalents $1,000 $1,050 $1,050 $2,469 Trade Receivables-Net $4,100 $5,250 $5,250 $3,621 Inventory $4,300 $4,830 $4,830 $3,518 Other Current Assets $300 $315 $315 $315 Non-Current Assets $11,200 $11,359 $11,359 $11,359 Total Assets $20,900 $22,804 $22,804 $21,282 Liabilities Notes Payable-Short Term $1,475 $3,490 $3,490 $1,475 Trade Payables $1,045 $1,097 $1,097 $1,065 Other Current Liabilities $2,255 $2,299 $2,299 $2,299 Non-Current Liabilities $6,675 $5,392 $5,392 $5,392 Net Worth $9,450 $10,526 $10,526 $11,051 Total Liabilities & Net Worth $20,900 $22,804 $22,804 $21,282
Cash Flow Statement Example 1  – 5% sales increase over baseline year  Example 2  – 5% sales increase over baseline year & 10% operating expense reduction  Example 3  – 5% sales increase over baseline year, COGS reduced by 2% & operating expenses increased by $400K ($000’s) Example 1 Example 2 Example 3 Net Sales $26,250 $26,250 $26,250 Cash from Sales $25,100 $25,100 $26,729 Cash Production Costs -$18,547 -$18,547 -$16,742 Cash from Trading $6,553 $6,553 $9,987 Cash Operating Costs -$7,129 -$6,418 -$7,529 Cash After Operations -$576 $135 $2,458 Net Cash After Operations -$904 -$521 $1,802
Calculating the Value  of Improved Key Indicators Accounts Receivable $25,000,000 in Sales  / 365 days = $68,500 Baseline Collection Days = 58 Days Revised Collection Days = 51 Days Increase in Cash Flow of $479,500
Calculating the Value  of Improved Key Indicators Inventory $17,250,000 in Materials  / 4.01 Turns per Year = $4,302,000 Baseline Inventory Turns per Year = 4.01 Revised Inventory Turns per Year = 4.99 $17,588,000 / 4.99 = $3,525,000 Increase in Cash Flow of $777,000
Calculating the Value  of Improved Key Indicators Cost of Goods Sold Baseline COGS:  $17,250 / $25,000 = 69% COGS Revised COGS:  $17,588 / $26,250 = 67% COGS Baseline Gross Profit = 31% Revised Gross Profit = 33% Incremental Profit Gain on Sales increase of 5% = $125,000
What resources are available in your business? Sales/Marketshare Growth Multiple Product/Service Offerings Accounts Receivable Collection Period Inventory Carrying Costs Cost of Goods Sold Operating Expenses Time to Market Quality Control Employee Retention Customer Retention Calculating the Value  of Improved Key Indicators
Identifying Your Untapped  Key Indicators Create a flow chart of your business cycle Identify areas that require change/improvement Determine long- and short-term objectives Determine hard or soft objectives Rate each objective as it relates to your business strategy, operating environment, and measurement capability
Forecasting the Impact of Change Identify the environment of your business Identify the potential impact of achievement of your objectives on your Internal and External environments Identify the target audience that will be responsible for completing the objectives
Determining Your Investment Posture Establish a baseline Calculate incremental revenues and expenses Measure your investment ROI against other historical investments
Making It Happen Create the right environment for change Track your investment on a monthly basis Remain flexible – Respond to changes in your environment Focus on the returns, not the awards
Will it Work for My Business? It is NOT a question of WILL it work in your business But rather a question of HOW WELL it WILL WORK!!

Enterprise Value Presentation

  • 1.
    Increasing the Enterprise Value of Your Business Bob Dawson, Founder The Business Group
  • 2.
    Program Objectives Identifykey indicators that can add value to your business Develop tools to measure your key indicators Create strategies to optimize your key indicators
  • 3.
    Key Indicators ProfitGross Margin Operating Profit Profit Before Taxes Net Profit Return on Assets Return on Equity EBITDA Process Quality Ratio Time to Market Sales Per Employee Inventory Turns A/R Collection Days Output Ratio Shipment Linearity People Turnover Productivity Loyalty ROI Capabilities
  • 4.
    The Financials CashFlow Statement Income Statement Balance Sheet Revenue - Expenses Profit/Loss Cash In - Cash Out Change in Cash Assets = Liabilities + Equity
  • 5.
    Creating More ProfitsSales Strategies Sell more to existing customers Sell to new customers Offer discounts or rebates Relax credit policies Expense Strategies Reduce workforce Reduce advertising expenses Reduce T & E expenses Reduce training costs Sales – Expenses = Profit
  • 6.
    Income Statement Example1 – 5% sales increase over baseline year Example 2 – 5% sales increase over baseline year & 10% operating expense reduction Example 3 – 5% sales increase over baseline year, COGS reduced by 2% & operating expenses increased by $400K ($000’s) Baseline Year Example 1 Example 2 Example 3 Total Sales $25,000 $26,250 $26,250 $26,250 Cost of Goods Sold $17,250 $18,113 $18,113 $17,588 Gross Profit $7,750 $8,137 $8,137 $8,662 Operating Expenses $6,775 $7,114 $6,403 $7,514 Operating Profit $975 $1,023 $1,734 $1,148 All Other Expenses $400 $420 $420 $420 Net Profit $575 $603 $1,314 $728
  • 7.
    Balance Sheet Example1 – 5% sales increase over baseline year Example 2 – 5% sales increase over baseline year & 10% operating expense reduction Example 3 – 5% sales increase over baseline year, COGS reduced by 2% & operating expenses increased by $400K ($000’s) Assets Baseline Year Example 1 Example 2 Example 3 Cash & Equivalents $1,000 $1,050 $1,050 $2,469 Trade Receivables-Net $4,100 $5,250 $5,250 $3,621 Inventory $4,300 $4,830 $4,830 $3,518 Other Current Assets $300 $315 $315 $315 Non-Current Assets $11,200 $11,359 $11,359 $11,359 Total Assets $20,900 $22,804 $22,804 $21,282 Liabilities Notes Payable-Short Term $1,475 $3,490 $3,490 $1,475 Trade Payables $1,045 $1,097 $1,097 $1,065 Other Current Liabilities $2,255 $2,299 $2,299 $2,299 Non-Current Liabilities $6,675 $5,392 $5,392 $5,392 Net Worth $9,450 $10,526 $10,526 $11,051 Total Liabilities & Net Worth $20,900 $22,804 $22,804 $21,282
  • 8.
    Cash Flow StatementExample 1 – 5% sales increase over baseline year Example 2 – 5% sales increase over baseline year & 10% operating expense reduction Example 3 – 5% sales increase over baseline year, COGS reduced by 2% & operating expenses increased by $400K ($000’s) Example 1 Example 2 Example 3 Net Sales $26,250 $26,250 $26,250 Cash from Sales $25,100 $25,100 $26,729 Cash Production Costs -$18,547 -$18,547 -$16,742 Cash from Trading $6,553 $6,553 $9,987 Cash Operating Costs -$7,129 -$6,418 -$7,529 Cash After Operations -$576 $135 $2,458 Net Cash After Operations -$904 -$521 $1,802
  • 9.
    Calculating the Value of Improved Key Indicators Accounts Receivable $25,000,000 in Sales / 365 days = $68,500 Baseline Collection Days = 58 Days Revised Collection Days = 51 Days Increase in Cash Flow of $479,500
  • 10.
    Calculating the Value of Improved Key Indicators Inventory $17,250,000 in Materials / 4.01 Turns per Year = $4,302,000 Baseline Inventory Turns per Year = 4.01 Revised Inventory Turns per Year = 4.99 $17,588,000 / 4.99 = $3,525,000 Increase in Cash Flow of $777,000
  • 11.
    Calculating the Value of Improved Key Indicators Cost of Goods Sold Baseline COGS: $17,250 / $25,000 = 69% COGS Revised COGS: $17,588 / $26,250 = 67% COGS Baseline Gross Profit = 31% Revised Gross Profit = 33% Incremental Profit Gain on Sales increase of 5% = $125,000
  • 12.
    What resources areavailable in your business? Sales/Marketshare Growth Multiple Product/Service Offerings Accounts Receivable Collection Period Inventory Carrying Costs Cost of Goods Sold Operating Expenses Time to Market Quality Control Employee Retention Customer Retention Calculating the Value of Improved Key Indicators
  • 13.
    Identifying Your Untapped Key Indicators Create a flow chart of your business cycle Identify areas that require change/improvement Determine long- and short-term objectives Determine hard or soft objectives Rate each objective as it relates to your business strategy, operating environment, and measurement capability
  • 14.
    Forecasting the Impactof Change Identify the environment of your business Identify the potential impact of achievement of your objectives on your Internal and External environments Identify the target audience that will be responsible for completing the objectives
  • 15.
    Determining Your InvestmentPosture Establish a baseline Calculate incremental revenues and expenses Measure your investment ROI against other historical investments
  • 16.
    Making It HappenCreate the right environment for change Track your investment on a monthly basis Remain flexible – Respond to changes in your environment Focus on the returns, not the awards
  • 17.
    Will it Workfor My Business? It is NOT a question of WILL it work in your business But rather a question of HOW WELL it WILL WORK!!