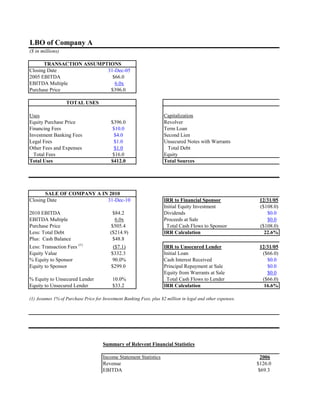
LBO of Company A
($ in millions)
TRANSACTION ASSUMPTIONS
Closing Date 31-Dec-05
2005 EBITDA $66.0
EBITDA Multiple 6.0x
Purchase Price $396.0
TOTAL USES TOTAL SOUR
Uses Capitalization
Equity Purchase Price $396.0 Revolver
Financing Fees $10.0 Term Loan
Investment Banking Fees $4.0 Second Lien
Legal Fees $1.0 Unsecured Notes with Warrants
Other Fees and Expenses $1.0 Total Debt
Total Fees $16.0 Equity
Total Uses $412.0 Total Sources
SALE OF COMPANY A IN 2010
Closing Date 31-Dec-10 IRR to Financial Sponsor 12/31/05
Initial Equity Investment ($108.0)
2010 EBITDA $84.2 Dividends $0.0
EBITDA Multiple 6.0x Proceeds at Sale $0.0
Purchase Price $505.4 Total Cash Flows to Sponsor ($108.0)
Less: Total Debt ($214.9) IRR Calculation 22.6%
Plus: Cash Balance $48.8
Less: Transaction Fees (1)
($7.1) IRR to Unsecured Lender 12/31/05
Equity Value $332.3 Initial Loan ($66.0)
% Equity to Sponsor 90.0% Cash Interest Received $0.0
Equity to Sponsor $299.0 Principal Repayment at Sale $0.0
Equity from Warrants at Sale $0.0
% Equity to Unsecured Lender 10.0% Total Cash Flows to Lender ($66.0)
Equity to Unsecured Lender $33.2 IRR Calculation 16.6%
(1) Assumes 1% of Purchase Price for Investment Banking Fees, plus $2 million in legal and other expenses.
Summary of Relevent Financial Statistics
Income Statement Statistics 2006
Revenue $126.0
EBITDA $69.3
Net Income $24.2
Net Interest Expense $21.0
Cash Interest Expense $14.1
Taxes $16.1
Revenue Growth na
EBITDA Margin 55%
EBITDA Growth na
Net Income Growth na
Net Income Margin 17%
Balance Sheet / Cash Flow Statistics
Cash $0.0
Total Debt $280.2
Net Debt $280.2
Secured Debt $207.2
Capex $8.8
Increase (Decrease) in W/C ($0.6)
Leverage Ratios
Total Debt / EBITDA 4.0x
Net Debt / EBITDA 4.0x
Secured Debt / EBITDA 3.0x
EBITDA / Net Interest Expense 3.3x
EBITDA / Cash Interest Expense 4.9x
Interest Coverage Statistics
EBITDA / Net Interest Expense 3.3x
EBITDA / Cash Interest 4.9x
EBITDA - Capex / Net Interest Expense 2.9x
EBITDA - Capex / Cash Interest Expense 4.3x
EBITDA - Capex - ∆ W/C / Net Interest Expense 2.9x
EBITDA - Capex - ∆ W/C / Cash Interest Expense 4.3x
EBITDA - Capex - ∆ W/C - Taxes/ Net Interest Expense 2.1x
EBITDA - Capex - ∆ W/C - Taxes/ Cash Interest Expense 3.2x
TOTAL SOURCES
Amount EBITDA % of Interest Rate % of Fully
Funded Multiple Capitalization Cash Pay PIK Diluted Equity
$7.0 0.1x 1.7% 5.0% 0.0% na
$132.0 2.0x 32.0% 5.0% 0.0% na
$99.0 1.5x 24.0% 8.0% 0.0% na
$66.0 1.0x 16.0% 0.0% 10.0% 10%
$304.0 4.6x 73.8%
$108.0 1.6x 26.2%
$412.0 6.2x 100.0%
12/31/06 12/31/07 12/31/08 12/31/09 12/31/10
$0.0 $0.0 $0.0 $0.0 $0.0
$0.0 $0.0 $0.0 $0.0 $0.0
$0.0 $0.0 $0.0 $0.0 $299.0
$0.0 $0.0 $0.0 $0.0 $299.0
12/31/06 12/31/07 12/31/08 12/31/09 12/31/10
$0.0 $0.0 $0.0 $0.0 $0.0
$0.0 $0.0 $0.0 $0.0 $0.0
$0.0 $0.0 $0.0 $0.0 $108.9
$0.0 $0.0 $0.0 $0.0 $33.2
$0.0 $0.0 $0.0 $0.0 $142.1
2007 2008 2009 2010
$132.3 $138.9 $145.9 $153.2
$72.8 $76.4 $80.2 $84.2
$26.7 $29.2 $31.8 $34.6
$20.3 $19.6 $18.8 $18.0
$12.7 $11.4 $10.1 $8.9
$17.8 $19.4 $21.2 $23.0
5% 5% 5% 5%
55% 55% 55% 55%
5% 5% 5% 5%
10% 9% 9% 9%
15% 14% 13% 12%
$6.6 $17.3 $31.3 $48.8
$261.6 $245.1 $229.5 $214.9
$255.1 $227.8 $198.2 $166.1
$181.0 $156.0 $131.0 $106.0
$9.3 $9.7 $10.2 $10.7
$0.4 $0.4 $0.4 $0.4
3.6x 3.2x 2.9x 2.6x
3.5x 3.0x 2.5x 2.0x
2.5x 2.0x 1.6x 1.3x
3.6x 3.9x 4.3x 4.7x
5.7x 6.7x 7.9x 9.5x
3.6x 3.9x 4.3x 4.7x
5.7x 6.7x 7.9x 9.5x
3.1x 3.4x 3.7x 4.1x
5.0x 5.9x 6.9x 8.3x
3.1x 3.4x 3.7x 4.1x
5.0x 5.8x 6.9x 8.2x
2.2x 2.4x 2.6x 2.8x
3.6x 4.1x 4.8x 5.6x
#REF!
Proforma Balance Sheet
($ in millions)
Adjustments Proforma Proforma
Balance Sheet Dec. 31 By the Seller Before New Adjustments Dec. 31
Assets 2005 Pre-Transaction Financing Financing Transaction 2005
Cash $76.9 ($76.9) $0.0 $0.0 $0.0 $0.0
Accounts Receivable $9.9 $0.0 $9.9 $0.0 $0.0 $9.9
Inventory $3.0 $0.0 $3.0 $0.0 $0.0 $3.0
Other Current Assets $1.0 $0.0 $1.0 $0.0 $0.0 $1.0
Total Current Assets $90.7 ($76.9) $13.9 $0.0 $0.0 $13.9
Gross PP&E $345.1 $0.0 $345.1 $0.0 $0.0 $345.1
Cumulative Depreciation $45.0 $0.0 $45.0 $0.0 $0.0 $45.0
Net PP&E $300.1 $0.0 $300.1 $0.0 $0.0 $300.1
Amortizable Intangibles $0.0 $0.0 $0.0 $0.0 $16.0 $16.0
Goodwill $5.0 $0.0 $5.0 $0.0 $84.7 $89.7
Total Assets $395.9 ($76.9) $319.0 $0.0 $100.7 $419.7
Liabilities
Accounts Payable $3.3 $0.0 $3.3 $0.0 $0.0 $3.3
Accrued Liabilities $2.4 $0.0 $2.4 $0.0 $0.0 $2.4
Other Current Liabilities $0.0 $0.0 $0.0 $0.0 $0.0 $0.0
Total Current Liabilities $5.7 $0.0 $5.7 $0.0 $0.0 $5.7
Revolving Credit Facility $10.6 ($10.6) $0.0 $7.0 $0.0 $7.0
Term Loan $200.0 ($200.0) $0.0 $132.0 $0.0 $132.0
Second Lien $0.0 $0.0 $0.0 $99.0 $0.0 $99.0
Unsecured Debt $100.0 ($100.0) $0.0 $66.0 $0.0 $66.0
Other Liabilities $2.0 $0.0 $2.0 $0.0 $0.0 $2.0
Total Liabilities $318.3 ($310.6) $7.7 $304.0 $0.0 $311.7
Shareholders Equity
Retainined Earnings $77.6 $0.0 $77.6 $0.0 ($77.6) $0.0
Other (Plug / Balance) $0.0 $233.8 $233.8 $0.0 ($125.8) $108.0
Total Shareholders Equity $77.6 $233.8 $311.3 $0.0 ($203.3) $108.0
Total Liabilities and Equity $395.9 ($76.9) $319.0 $304.0 ($203.3) $419.7
Check $0.0 $0.0 $0.0 $304.0 ($304.0) $0.0
Goodwill Calculation
Equity Purchase Price $396.0
– Book Value of Equity ($311.3)
+ Existing Goodwill $5.0
= Resulting Goodwill Balance $89.7
Intangibles Assets
Intangible Assets $0.0
+ Financing Fees $10.0
+ M&A Fees $4.0
+ Legal Fees $1.0
+ Other Fees $1.0
= Resulting Intangibles Balance $16.0
COMPANY A FINANCIAL MODEL
HISTORICAL FINANCIAL STATEMENTS PROJECTED FINANCIAL STATEMENTS
($ in millions) Fiscal Year Ending December 31, Pro Forma Fiscal Year Ending December 31,
2001A 2002A 2003A 2004A 2005A 2005P 2006P 2007P 2008P 2009P 2010P
Income Statement
Revenue $100.0 $105.0 $110.0 $115.0 $120.0 $126.0 $132.3 $138.9 $145.9 $153.2
% Growth na 5.0% 4.8% 4.5% 4.3% 5.0% 5.0% 5.0% 5.0% 5.0%
Cost of Goods Sold
(1)
$20.0 $21.0 $22.0 $23.0 $24.0 $25.2 $26.5 $27.8 $29.2 $30.6
COGS as % of Revenue 20.0% 20.0% 20.0% 20.0% 20.0% 20.0% 20.0% 20.0% 20.0% 20.0%
Depreciation $5.0 $5.0 $5.0 $5.0 $5.0 $7.1 $7.3 $7.5 $7.7 $7.9
Amortization $0.0 $0.0 $0.0 $0.0 $0.0 $0.8 $0.8 $0.8 $0.8 $0.8
Gross Profit $75.0 $79.0 $83.0 $87.0 $91.0 $92.9 $97.8 $102.9 $108.2 $113.8
Gross Profit 75.0% 75.2% 75.5% 75.7% 75.8% 73.7% 73.9% 74.1% 74.2% 74.3%
SG&A Expenses $25.0 $26.3 $27.5 $28.8 $30.0 $31.5 $33.1 $34.7 $36.5 $38.3
SG&A as % of Revenue 25.0% 25.0% 25.0% 25.0% 25.0% 25.0% 25.0% 25.0% 25.0% 25.0%
Operating Income / EBIT $50.0 $52.8 $55.5 $58.3 $61.0 $61.4 $64.7 $68.1 $71.8 $75.6
Operating Income / EBIT Margin 50.0% 50.2% 50.5% 50.7% 50.8% 48.7% 48.9% 49.1% 49.2% 49.3%
EBITDA $55.0 $57.8 $60.5 $63.3 $66.0 $69.3 $72.8 $76.4 $80.2 $84.2
EBITDA Margin 55.0% 55.0% 55.0% 55.0% 55.0% 55.0% 55.0% 55.0% 55.0% 55.0%
EBITDA Growth na 5.0% 4.8% 4.5% 4.3% 5.0% 5.0% 5.0% 5.0% 5.0%
Interest Expense $25.0 $24.5 $24.6 $24.6 $24.6 $21.0 $20.4 $19.9 $19.5 $19.3
Interest Income $0.2 $0.2 $0.5 $0.7 $1.0 $0.0 $0.1 $0.3 $0.7 $1.3
Net Interest Expense $24.8 $24.3 $24.1 $23.9 $23.6 $21.0 $20.3 $19.6 $18.8 $18.0
Other Income / (Expense) $2.0 $0.0 ($2.0) $1.0 $0.0 $0.0 $0.0 $0.0 $0.0 $0.0
Pretax Income $27.2 $28.4 $29.4 $35.4 $37.4 $40.4 $44.4 $48.6 $53.0 $57.6
Taxes $10.9 $11.4 $11.8 $14.2 $15.0 $16.1 $17.8 $19.4 $21.2 $23.0
Tax Rate 40.0% 40.0% 40.0% 40.0% 40.0% 40.0% 40.0% 40.0% 40.0% 40.0%
Net Income $16.3 $17.1 $17.6 $21.2 $22.4 $24.2 $26.7 $29.2 $31.8 $34.6
Net Margin 16.3% 16.2% 16.0% 18.5% 18.7% 19.2% 20.1% 21.0% 21.8% 22.6%
Net Income Growth na 4.5% 3.4% 20.4% 5.7% 8.0% 10.0% 9.4% 9.0% 8.7%
(1) Excludes depreciation and amortization
Page 61
COMPANY A FINANCIAL MODEL
HISTORICAL FINANCIAL STATEMENTS PROJECTED FINANCIAL STATEMENTS
($ in millions) Fiscal Year Ending December 31, Pro Forma Fiscal Year Ending December 31,
2001A 2002A 2003A 2004A 2005A 2005P 2006P 2007P 2008P 2009P 2010P
Balance Sheet
Assets
Cash $5.0 $21.3 $39.9 $57.4 $76.9 $0.0 $0.0 $6.6 $17.3 $31.3 $48.8
Accounts Receivable $8.2 $8.6 $9.0 $9.5 $9.9 $9.9 $10.5 $11.0 $11.6 $12.2 $12.8
Inventory $2.5 $2.6 $2.8 $2.9 $3.0 $3.0 $3.2 $3.3 $3.5 $3.6 $3.8
Other Current Assets $1.0 $1.0 $1.0 $1.0 $1.0 $1.0 $1.0 $1.0 $1.0 $1.0 $1.0
Total Current Assets $16.7 $33.6 $52.6 $70.7 $90.7 $13.9 $14.7 $21.9 $33.4 $48.1 $66.4
`
Gross PP&E $318.9 $324.9 $329.9 $336.1 $345.1 $345.1 $353.9 $363.2 $372.9 $383.1 $393.9
Cumulative Depreciation $25.0 $30.0 $35.0 $40.0 $45.0 $45.0 $52.1 $59.3 $66.8 $74.5 $82.3
Net PP&E $293.9 $294.9 $294.9 $296.1 $300.1 $300.1 $301.9 $303.9 $306.1 $308.7 $311.5
Intangibles $16.0 $15.2 $14.4 $13.6 $12.8 $12.0
Goodwill $5.0 $5.0 $5.0 $5.0 $5.0 $89.7 $89.7 $89.7 $89.7 $89.7 $89.7
Total Assets $315.6 $333.5 $352.6 $371.9 $395.9 $419.7 $421.4 $429.8 $442.8 $459.3 $479.6
Liabilities
Accounts Payable $2.8 $3.0 $2.9 $3.3 $3.3 $3.3 $3.5 $3.7 $3.9 $4.1 $4.3
Accrued Liabilities $2.0 $2.1 $2.2 $2.3 $2.4 $2.4 $2.5 $2.6 $2.8 $2.9 $3.1
Other Current Liabilities $1.0 $0.0 $2.0 $1.0 $0.0 $0.0 $1.0 $1.0 $1.0 $1.0 $1.0
Total Current Liabilities $5.8 $5.1 $7.1 $6.6 $5.7 $5.7 $7.0 $7.3 $7.6 $8.0 $8.3
Revolving Credit Facility $8.9 $9.3 $9.7 $10.2 $10.6 $7.0 $1.2 $0.0 $0.0 $0.0 $0.0
Term Loan $200.0 $200.0 $200.0 $200.0 $200.0 $132.0 $107.0 $82.0 $57.0 $32.0 $7.0
Second Lien Debt $99.0 $99.0 $99.0 $99.0 $99.0 $99.0
Unsecured Debt $100.0 $100.0 $100.0 $100.0 $100.0 $66.0 $72.9 $80.6 $89.1 $98.5 $108.9
Other Liabilities $1.0 $2.0 $1.0 $0.0 $2.0 $2.0 $2.0 $2.0 $2.0 $2.0 $2.0
Total Liabilities $315.6 $316.4 $317.9 $316.7 $318.3 $311.7 $289.2 $270.9 $254.8 $239.5 $225.2
$6.9 $7.7 $8.5 $9.4 $10.4
Shareholders Equity
Retainined Earnings $0.0 $17.1 $34.7 $55.1 $77.6 $0.0 $24.2 $50.9 $80.0 $111.8 $146.4
Other (Plug / Balance) $0.0 $0.0 $0.0 $0.0 $0.0 $108.0 $108.0 $108.0 $108.0 $108.0 $108.0
Total Shareholders Equity $0.0 $17.1 $34.7 $55.1 $77.6 $108.0 $132.2 $158.9 $188.0 $219.8 $254.4
Total Liabilities and Equity $315.6 $333.5 $352.6 $371.9 $395.9 $419.7 $421.4 $429.8 $442.8 $459.3 $479.6
Check $0.0 $0.0 $0.0 $0.0 $0.0 $0.0 $0.0 $0.0 $0.0 $0.0 $0.0
Page 62
COMPANY A FINANCIAL MODEL
HISTORICAL FINANCIAL STATEMENTS PROJECTED FINANCIAL STATEMENTS
($ in millions) Fiscal Year Ending December 31, Pro Forma Fiscal Year Ending December 31,
2001A 2002A 2003A 2004A 2005A 2005P 2006P 2007P 2008P 2009P 2010P
Cash Flow
Net Income na $17.1 $17.6 $21.2 $22.4 $24.2 $26.7 $29.2 $31.8 $34.6
Plus / (minus):
Depreciation and Amortization na $5 $5 $5 $5 $8 $8 $8 $8 $9
Changes in Working Capital
Accounts Receivable na ($0.4) ($0.4) ($0.4) ($0.4) ($0.6) ($0.5) ($0.6) ($0.6) ($0.6)
Inventory na ($0.1) ($0.1) ($0.1) ($0.1) ($0.2) ($0.2) ($0.2) ($0.2) ($0.2)
Other Current Assets na $0.0 $0.0 $0.0 $0.0 $0.0 $0.0 $0.0 $0.0 $0.0
Accounts Payable na $0.3 ($0.1) $0.3 $0.0 $0.2 $0.2 $0.2 $0.2 $0.2
Accrued Liabilities na $0.1 $0.1 $0.1 $0.1 $0.1 $0.1 $0.1 $0.1 $0.1
Other Current Liabilities na ($1.0) $2.0 ($1.0) ($1.0) $1.0 $0.0 $0.0 $0.0 $0.0
Change in Other Liabilities na $1 ($1) ($1) $2 $0 $0 $0 $0 $0
Cash Flows from Operations na $21.9 $23.1 $24.1 $28.0 $32.7 $34.3 $37.0 $39.8 $42.8
Cash Flows from Investing
Capital Expenditures na ($6.0) ($7.0) ($8.0) ($9.0) ($8.8) ($9.3) ($9.7) ($10.2) ($10.7)
Asset Dispostions na $0.0 $2.0 $1.0 $0.0 $0.0 $0.0 $0.0 $0.0 $0.0
Cash Flows from Investing na ($6.0) ($5.0) ($7.0) ($9.0) ($8.8) ($9.3) ($9.7) ($10.2) ($10.7)
Cash Flows from Financing
Change in Revolver na $0.4 $0.4 $0.4 $0.4 ($5.8) ($1.2) $0.0 $0.0 $0.0
Change in Term Loan na $0.0 $0.0 $0.0 $0.0 ($25.0) ($25.0) ($25.0) ($25.0) ($25.0)
Change in Second Lien $0.0 $0.0 $0.0 $0.0 $0.0
Change in Unsecured Debt na $0.0 $0.0 $0.0 $0.0 $6.9 $7.7 $8.5 $9.4 $10.4
Total Cash Flows from Financing na $0.4 $0.4 $0.4 $0.4 ($23.8) ($18.5) ($16.5) ($15.6) ($14.6)
Total Cash Flow na $16.3 $18.5 $17.6 $19.5 $0.0 $6.6 $10.8 $14.0 $17.4
Beginning Cash Position na $5.0 $21.3 $39.9 $57.4 $0.0 $0.0 $6.6 $17.3 $31.3
Change in Cash Position na $16.3 $18.5 $17.6 $19.5 $0.0 $6.6 $10.8 $14.0 $17.4
Ending Cash Position na $21.3 $39.9 $57.4 $76.9 $0.0 $6.6 $17.3 $31.3 $48.8
Page 63
COMPANY A FINANCIAL MODEL
HISTORICAL FINANCIAL STATEMENTS PROJECTED FINANCIAL STATEMENTS
($ in millions) Fiscal Year Ending December 31, Pro Forma Fiscal Year Ending December 31,
2001A 2002A 2003A 2004A 2005A 2005P 2006P 2007P 2008P 2009P 2010P
Cash flow before Revolver $5.8 $7.8 $17.3 $31.3 $48.8
Debt and Interest Schedule
Revolver
Beginning Revolver Balance $8.9 $9.3 $9.7 $10.2 $7.0 $1.2 $0.0 $0.0 $0.0
(Paydown) / Drawdown $0.4 $0.4 $0.4 $0.4 ($5.8) ($1.2) $0.0 $0.0 $0.0
Ending Revolver Balance $9.3 $9.7 $10.2 $10.6 $1.2 $0.0 $0.0 $0.0 $0.0
Interest Rate 6.0% 6.0% 6.0% 6.0% 5.00% 5.00% 5.00% 5.00% 5.00%
Cash Pay Interest Expense $0.54 $0.57 $0.60 $0.62 $0.21 $0.03 $0.00 $0.00 $0.00
Term Loan
Term Loan Beginning Balance $200.0 $200.0 $200.0 $200.0 $132.0 $107.0 $82.0 $57.0 $32.0
(Paydown) / Drawdown $0.0 $0.0 $0.0 $0.0 ($25.0) ($25.0) ($25.0) ($25.0) ($25.0)
Term Loan Ending Balance $200.0 $200.0 $200.0 $200.0 $107.0 $82.0 $57.0 $32.0 $7.0
Interest Rate 6.00% 6.00% 6.00% 6.00% 5.00% 5.00% 5.00% 5.00% 5.00%
Cash Pay Interest Expense $12.0 $12.0 $12.0 $12.0 $6.0 $4.7 $3.5 $2.2 $1.0
Second Lien Debt
Second Lien Debt Beginning Balance $99.0 $99.0 $99.0 $99.0 $99.0
(Paydown) / Drawdown $0.0 $0.0 $0.0 $0.0 $0.0
Second Lien Debt Ending Balance $99.0 $99.0 $99.0 $99.0 $99.0
Cash Pay Interest Rate 8.00% 8.00% 8.00% 8.00% 8.00%
Cash Pay Interest Expense $7.9 $7.9 $7.9 $7.9 $7.9
PIK Interest Rate 0% 0% 0% 0% 0%
PIK Interest Expense $0.0 $0.0 $0.0 $0.0 $0.0
Unsecured Debt
Unsecured Debt Beginning Balance $100.0 $100.0 $100.0 $100.0 $66.0 $72.9 $80.6 $89.1 $98.5
(Paydown) / Drawdown $0.0 $0.0 $0.0 $0.0 $0.0 $0.0 $0.0 $0.0 $0.0
Unsecured Debt Ending Balance $100.0 $100.0 $100.0 $100.0 $72.9 $80.6 $89.1 $98.5 $108.9
Cash Pay Interest Rate 12% 12% 12% 12% 0% 0% 0% 0% 0%
Cash Pay Interest Expense $12.0 $12.0 $12.0 $12.0 $0.0 $0.0 $0.0 $0.0 $0.0
PIK Interest Rate 10% 10% 10% 10% 10%
PIK Interest Expense $6.9 $7.7 $8.5 $9.4 $10.4
Total Interest Expense $24.5 $24.6 $24.6 $24.6 $21.0 $20.4 $19.9 $19.5 $19.3
Total Cash Pay Interest Rate Expense $14.1 $12.7 $11.4 $10.1 $8.9
Total PIK Interest Rate Expense $6.9 $7.7 $8.5 $9.4 $10.4
Interest Earned on Cash $0.2 $0.5 $0.7 $1.0 $0.0 $0.1 $0.3 $0.7 $1.3
Page 64
COMPANY A FINANCIAL MODEL
HISTORIC VARIABLES AND ASSUMPTIONS FOR PROJECTIONS
HISTORICAL VARIABLES AND DRIVERS ASSUMPTIONS FOR PROJECTIONS
Fiscal Year Ending December 31, Fiscal Year Ending December 31,
2001A 2002A 2003A 2004A 2005A 2006P 2007P 2008P 2009P 2010P
Income Statement Drivers / Assumptions
Revenue Growth Rate na 5.0% 4.8% 4.5% 4.3% 5.0% 5.0% 5.0% 5.0% 5.0%
COGS as % of Revenue 20.0% 20.0% 20.0% 20.0% 20.0% 20.0% 20.0% 20.0% 20.0% 20.0%
Depreciation as % of Gross PP&E 1.6% 1.5% 1.5% 1.5% 1.4% 2.0% 2.0% 2.0% 2.0% 2.0%
Goodwill Amortization
Intangible Amortization Per Year 20
Intangible Amortization $0.8 $0.8 $0.8 $0.8 $0.8
SG&A as % of Sales 25.0% 25.0% 25.0% 25.0% 25.0% 25.0% 25.0% 25.0% 25.0% 25.0%
Other Income / (Expense) $2.0 $0.0 ($2.0) $1.0 $0.0 $0.0 $0.0 $0.0 $0.0 $0.0
Tax Rate 40.0% 40.0% 40.0% 40.0% 40.0% 40.0% 40.0% 40.0% 40.0% 40.0%
Balance Sheet Drivers / Assumptions
Days Accounts Receivable 30 30 30 30 30 30 30 30 30 30
Days Inventory 45 45 45 45 45 45 45 45 45 45
Other Current Assets $1.0 $1.0 $1.0 $1.0 $1.0 $1.0 $1.0 $1.0 $1.0 $1.0
Amortize Goodwill? (yes or no) $0.0 $0.0 $0.0 $0.0 $0.0
Capex as % of Sales na 5.7% 6.4% 7.0% 7.5% 7.0% 7.0% 7.0% 7.0% 7.0%
Asset Disposition na $0.0 $2.0 $1.0 $0.0 $0.0 $0.0 $0.0 $0.0 $0.0
Days Payable 50 52 48 51 49 50 50 50 50 50
Accrued Liabilities as % of COGS 10.0% 10.0% 10.0% 10.0% 10.0% 10.0% 10.0% 10.0% 10.0% 10.0%
Other Current Liabilities $1.0 $0.0 $2.0 $1.0 $0.0 $1.0 $1.0 $1.0 $1.0 $1.0
Other Liailities $1.0 $2.0 $1.0 $0.0 $2.0 $2.0 $2.0 $2.0 $2.0 $2.0
Interest Rates
Revolver 2.0%+li 6.00% 6.00% 6.00% 6.00% 6.00% 5.00% 5.00% 5.00% 5.00% 5.00%
Term Loan 2.0%+li 6.00% 6.00% 6.00% 6.00% 6.00% 5.00% 5.00% 5.00% 5.00% 5.00%
Second Lien Debt (Cash) 8.00% 8.00% 8.00% 8.00% 8.00%
Second Lien Debt (PIK) 0.00% 0.00% 0.00% 0.00% 0.00%
Unsecured Debt (Cash) 12.0% 12.00% 12.00% 12.00% 12.00% 12.00% 0.00% 0.00% 0.00% 0.00% 0.00%
Unsecured Debt (PIK) 10.00% 10.00% 10.00% 10.00% 10.00%
LIBOR 4.00% 4.00% 4.00% 4.00% 4.00% 4.25% 4.50% 4.75% 5.00% 5.25%
Interest earned on cash 2% 2.00% 2.00% 2.00% 2.00% 2.00% 2.25% 2.50% 2.75% 3.00% 3.25%
Page 65
COMPANY A FINANCIAL MODEL
SENSITIVITIES
($ in millions) 2010 EBITDA FOR RANGE OF REVENUE GROWTH RATES AND COGS
Annual Revenue Growth Rate
$84.2 -20% -15% -10% -5% 0% 5% 10% 15% 20%
14% $24.0 $32.5 $43.2 $56.6 $73.2 $93.4 $117.9 $147.2 $182.1
16% $23.2 $31.4 $41.8 $54.8 $70.8 $90.4 $114.0 $142.4 $176.2
18% $22.4 $30.3 $40.4 $52.9 $68.4 $87.3 $110.2 $137.6 $170.2
20% $21.6 $29.3 $39.0 $51.1 $66.0 $84.2 $106.3 $132.7 $164.2
22% $20.8 $28.2 $37.6 $49.2 $63.6 $81.2 $102.4 $127.9 $158.3
24% $20.1 $27.2 $36.1 $47.4 $61.2 $78.1 $98.6 $123.1 $152.3
26% $19.3 $26.1 $34.7 $45.5 $58.8 $75.0 $94.7 $118.3 $146.3
Shading indicates base case scenario
COGSas%of
Sales
Page 66

Sample LBO Model Template – 2

  • 1.
    LBO of CompanyA ($ in millions) TRANSACTION ASSUMPTIONS Closing Date 31-Dec-05 2005 EBITDA $66.0 EBITDA Multiple 6.0x Purchase Price $396.0 TOTAL USES TOTAL SOUR Uses Capitalization Equity Purchase Price $396.0 Revolver Financing Fees $10.0 Term Loan Investment Banking Fees $4.0 Second Lien Legal Fees $1.0 Unsecured Notes with Warrants Other Fees and Expenses $1.0 Total Debt Total Fees $16.0 Equity Total Uses $412.0 Total Sources SALE OF COMPANY A IN 2010 Closing Date 31-Dec-10 IRR to Financial Sponsor 12/31/05 Initial Equity Investment ($108.0) 2010 EBITDA $84.2 Dividends $0.0 EBITDA Multiple 6.0x Proceeds at Sale $0.0 Purchase Price $505.4 Total Cash Flows to Sponsor ($108.0) Less: Total Debt ($214.9) IRR Calculation 22.6% Plus: Cash Balance $48.8 Less: Transaction Fees (1) ($7.1) IRR to Unsecured Lender 12/31/05 Equity Value $332.3 Initial Loan ($66.0) % Equity to Sponsor 90.0% Cash Interest Received $0.0 Equity to Sponsor $299.0 Principal Repayment at Sale $0.0 Equity from Warrants at Sale $0.0 % Equity to Unsecured Lender 10.0% Total Cash Flows to Lender ($66.0) Equity to Unsecured Lender $33.2 IRR Calculation 16.6% (1) Assumes 1% of Purchase Price for Investment Banking Fees, plus $2 million in legal and other expenses. Summary of Relevent Financial Statistics Income Statement Statistics 2006 Revenue $126.0 EBITDA $69.3
  • 2.
    Net Income $24.2 NetInterest Expense $21.0 Cash Interest Expense $14.1 Taxes $16.1 Revenue Growth na EBITDA Margin 55% EBITDA Growth na Net Income Growth na Net Income Margin 17% Balance Sheet / Cash Flow Statistics Cash $0.0 Total Debt $280.2 Net Debt $280.2 Secured Debt $207.2 Capex $8.8 Increase (Decrease) in W/C ($0.6) Leverage Ratios Total Debt / EBITDA 4.0x Net Debt / EBITDA 4.0x Secured Debt / EBITDA 3.0x EBITDA / Net Interest Expense 3.3x EBITDA / Cash Interest Expense 4.9x Interest Coverage Statistics EBITDA / Net Interest Expense 3.3x EBITDA / Cash Interest 4.9x EBITDA - Capex / Net Interest Expense 2.9x EBITDA - Capex / Cash Interest Expense 4.3x EBITDA - Capex - ∆ W/C / Net Interest Expense 2.9x EBITDA - Capex - ∆ W/C / Cash Interest Expense 4.3x EBITDA - Capex - ∆ W/C - Taxes/ Net Interest Expense 2.1x EBITDA - Capex - ∆ W/C - Taxes/ Cash Interest Expense 3.2x
  • 3.
    TOTAL SOURCES Amount EBITDA% of Interest Rate % of Fully Funded Multiple Capitalization Cash Pay PIK Diluted Equity $7.0 0.1x 1.7% 5.0% 0.0% na $132.0 2.0x 32.0% 5.0% 0.0% na $99.0 1.5x 24.0% 8.0% 0.0% na $66.0 1.0x 16.0% 0.0% 10.0% 10% $304.0 4.6x 73.8% $108.0 1.6x 26.2% $412.0 6.2x 100.0% 12/31/06 12/31/07 12/31/08 12/31/09 12/31/10 $0.0 $0.0 $0.0 $0.0 $0.0 $0.0 $0.0 $0.0 $0.0 $0.0 $0.0 $0.0 $0.0 $0.0 $299.0 $0.0 $0.0 $0.0 $0.0 $299.0 12/31/06 12/31/07 12/31/08 12/31/09 12/31/10 $0.0 $0.0 $0.0 $0.0 $0.0 $0.0 $0.0 $0.0 $0.0 $0.0 $0.0 $0.0 $0.0 $0.0 $108.9 $0.0 $0.0 $0.0 $0.0 $33.2 $0.0 $0.0 $0.0 $0.0 $142.1 2007 2008 2009 2010 $132.3 $138.9 $145.9 $153.2 $72.8 $76.4 $80.2 $84.2
  • 4.
    $26.7 $29.2 $31.8$34.6 $20.3 $19.6 $18.8 $18.0 $12.7 $11.4 $10.1 $8.9 $17.8 $19.4 $21.2 $23.0 5% 5% 5% 5% 55% 55% 55% 55% 5% 5% 5% 5% 10% 9% 9% 9% 15% 14% 13% 12% $6.6 $17.3 $31.3 $48.8 $261.6 $245.1 $229.5 $214.9 $255.1 $227.8 $198.2 $166.1 $181.0 $156.0 $131.0 $106.0 $9.3 $9.7 $10.2 $10.7 $0.4 $0.4 $0.4 $0.4 3.6x 3.2x 2.9x 2.6x 3.5x 3.0x 2.5x 2.0x 2.5x 2.0x 1.6x 1.3x 3.6x 3.9x 4.3x 4.7x 5.7x 6.7x 7.9x 9.5x 3.6x 3.9x 4.3x 4.7x 5.7x 6.7x 7.9x 9.5x 3.1x 3.4x 3.7x 4.1x 5.0x 5.9x 6.9x 8.3x 3.1x 3.4x 3.7x 4.1x 5.0x 5.8x 6.9x 8.2x 2.2x 2.4x 2.6x 2.8x 3.6x 4.1x 4.8x 5.6x
  • 58.
  • 59.
    Proforma Balance Sheet ($in millions) Adjustments Proforma Proforma Balance Sheet Dec. 31 By the Seller Before New Adjustments Dec. 31 Assets 2005 Pre-Transaction Financing Financing Transaction 2005 Cash $76.9 ($76.9) $0.0 $0.0 $0.0 $0.0 Accounts Receivable $9.9 $0.0 $9.9 $0.0 $0.0 $9.9 Inventory $3.0 $0.0 $3.0 $0.0 $0.0 $3.0 Other Current Assets $1.0 $0.0 $1.0 $0.0 $0.0 $1.0 Total Current Assets $90.7 ($76.9) $13.9 $0.0 $0.0 $13.9 Gross PP&E $345.1 $0.0 $345.1 $0.0 $0.0 $345.1 Cumulative Depreciation $45.0 $0.0 $45.0 $0.0 $0.0 $45.0 Net PP&E $300.1 $0.0 $300.1 $0.0 $0.0 $300.1 Amortizable Intangibles $0.0 $0.0 $0.0 $0.0 $16.0 $16.0 Goodwill $5.0 $0.0 $5.0 $0.0 $84.7 $89.7 Total Assets $395.9 ($76.9) $319.0 $0.0 $100.7 $419.7 Liabilities Accounts Payable $3.3 $0.0 $3.3 $0.0 $0.0 $3.3 Accrued Liabilities $2.4 $0.0 $2.4 $0.0 $0.0 $2.4 Other Current Liabilities $0.0 $0.0 $0.0 $0.0 $0.0 $0.0 Total Current Liabilities $5.7 $0.0 $5.7 $0.0 $0.0 $5.7 Revolving Credit Facility $10.6 ($10.6) $0.0 $7.0 $0.0 $7.0 Term Loan $200.0 ($200.0) $0.0 $132.0 $0.0 $132.0 Second Lien $0.0 $0.0 $0.0 $99.0 $0.0 $99.0 Unsecured Debt $100.0 ($100.0) $0.0 $66.0 $0.0 $66.0 Other Liabilities $2.0 $0.0 $2.0 $0.0 $0.0 $2.0 Total Liabilities $318.3 ($310.6) $7.7 $304.0 $0.0 $311.7 Shareholders Equity Retainined Earnings $77.6 $0.0 $77.6 $0.0 ($77.6) $0.0 Other (Plug / Balance) $0.0 $233.8 $233.8 $0.0 ($125.8) $108.0 Total Shareholders Equity $77.6 $233.8 $311.3 $0.0 ($203.3) $108.0 Total Liabilities and Equity $395.9 ($76.9) $319.0 $304.0 ($203.3) $419.7 Check $0.0 $0.0 $0.0 $304.0 ($304.0) $0.0
  • 60.
    Goodwill Calculation Equity PurchasePrice $396.0 – Book Value of Equity ($311.3) + Existing Goodwill $5.0 = Resulting Goodwill Balance $89.7 Intangibles Assets Intangible Assets $0.0 + Financing Fees $10.0 + M&A Fees $4.0 + Legal Fees $1.0 + Other Fees $1.0 = Resulting Intangibles Balance $16.0
  • 61.
    COMPANY A FINANCIALMODEL HISTORICAL FINANCIAL STATEMENTS PROJECTED FINANCIAL STATEMENTS ($ in millions) Fiscal Year Ending December 31, Pro Forma Fiscal Year Ending December 31, 2001A 2002A 2003A 2004A 2005A 2005P 2006P 2007P 2008P 2009P 2010P Income Statement Revenue $100.0 $105.0 $110.0 $115.0 $120.0 $126.0 $132.3 $138.9 $145.9 $153.2 % Growth na 5.0% 4.8% 4.5% 4.3% 5.0% 5.0% 5.0% 5.0% 5.0% Cost of Goods Sold (1) $20.0 $21.0 $22.0 $23.0 $24.0 $25.2 $26.5 $27.8 $29.2 $30.6 COGS as % of Revenue 20.0% 20.0% 20.0% 20.0% 20.0% 20.0% 20.0% 20.0% 20.0% 20.0% Depreciation $5.0 $5.0 $5.0 $5.0 $5.0 $7.1 $7.3 $7.5 $7.7 $7.9 Amortization $0.0 $0.0 $0.0 $0.0 $0.0 $0.8 $0.8 $0.8 $0.8 $0.8 Gross Profit $75.0 $79.0 $83.0 $87.0 $91.0 $92.9 $97.8 $102.9 $108.2 $113.8 Gross Profit 75.0% 75.2% 75.5% 75.7% 75.8% 73.7% 73.9% 74.1% 74.2% 74.3% SG&A Expenses $25.0 $26.3 $27.5 $28.8 $30.0 $31.5 $33.1 $34.7 $36.5 $38.3 SG&A as % of Revenue 25.0% 25.0% 25.0% 25.0% 25.0% 25.0% 25.0% 25.0% 25.0% 25.0% Operating Income / EBIT $50.0 $52.8 $55.5 $58.3 $61.0 $61.4 $64.7 $68.1 $71.8 $75.6 Operating Income / EBIT Margin 50.0% 50.2% 50.5% 50.7% 50.8% 48.7% 48.9% 49.1% 49.2% 49.3% EBITDA $55.0 $57.8 $60.5 $63.3 $66.0 $69.3 $72.8 $76.4 $80.2 $84.2 EBITDA Margin 55.0% 55.0% 55.0% 55.0% 55.0% 55.0% 55.0% 55.0% 55.0% 55.0% EBITDA Growth na 5.0% 4.8% 4.5% 4.3% 5.0% 5.0% 5.0% 5.0% 5.0% Interest Expense $25.0 $24.5 $24.6 $24.6 $24.6 $21.0 $20.4 $19.9 $19.5 $19.3 Interest Income $0.2 $0.2 $0.5 $0.7 $1.0 $0.0 $0.1 $0.3 $0.7 $1.3 Net Interest Expense $24.8 $24.3 $24.1 $23.9 $23.6 $21.0 $20.3 $19.6 $18.8 $18.0 Other Income / (Expense) $2.0 $0.0 ($2.0) $1.0 $0.0 $0.0 $0.0 $0.0 $0.0 $0.0 Pretax Income $27.2 $28.4 $29.4 $35.4 $37.4 $40.4 $44.4 $48.6 $53.0 $57.6 Taxes $10.9 $11.4 $11.8 $14.2 $15.0 $16.1 $17.8 $19.4 $21.2 $23.0 Tax Rate 40.0% 40.0% 40.0% 40.0% 40.0% 40.0% 40.0% 40.0% 40.0% 40.0% Net Income $16.3 $17.1 $17.6 $21.2 $22.4 $24.2 $26.7 $29.2 $31.8 $34.6 Net Margin 16.3% 16.2% 16.0% 18.5% 18.7% 19.2% 20.1% 21.0% 21.8% 22.6% Net Income Growth na 4.5% 3.4% 20.4% 5.7% 8.0% 10.0% 9.4% 9.0% 8.7% (1) Excludes depreciation and amortization Page 61
  • 62.
    COMPANY A FINANCIALMODEL HISTORICAL FINANCIAL STATEMENTS PROJECTED FINANCIAL STATEMENTS ($ in millions) Fiscal Year Ending December 31, Pro Forma Fiscal Year Ending December 31, 2001A 2002A 2003A 2004A 2005A 2005P 2006P 2007P 2008P 2009P 2010P Balance Sheet Assets Cash $5.0 $21.3 $39.9 $57.4 $76.9 $0.0 $0.0 $6.6 $17.3 $31.3 $48.8 Accounts Receivable $8.2 $8.6 $9.0 $9.5 $9.9 $9.9 $10.5 $11.0 $11.6 $12.2 $12.8 Inventory $2.5 $2.6 $2.8 $2.9 $3.0 $3.0 $3.2 $3.3 $3.5 $3.6 $3.8 Other Current Assets $1.0 $1.0 $1.0 $1.0 $1.0 $1.0 $1.0 $1.0 $1.0 $1.0 $1.0 Total Current Assets $16.7 $33.6 $52.6 $70.7 $90.7 $13.9 $14.7 $21.9 $33.4 $48.1 $66.4 ` Gross PP&E $318.9 $324.9 $329.9 $336.1 $345.1 $345.1 $353.9 $363.2 $372.9 $383.1 $393.9 Cumulative Depreciation $25.0 $30.0 $35.0 $40.0 $45.0 $45.0 $52.1 $59.3 $66.8 $74.5 $82.3 Net PP&E $293.9 $294.9 $294.9 $296.1 $300.1 $300.1 $301.9 $303.9 $306.1 $308.7 $311.5 Intangibles $16.0 $15.2 $14.4 $13.6 $12.8 $12.0 Goodwill $5.0 $5.0 $5.0 $5.0 $5.0 $89.7 $89.7 $89.7 $89.7 $89.7 $89.7 Total Assets $315.6 $333.5 $352.6 $371.9 $395.9 $419.7 $421.4 $429.8 $442.8 $459.3 $479.6 Liabilities Accounts Payable $2.8 $3.0 $2.9 $3.3 $3.3 $3.3 $3.5 $3.7 $3.9 $4.1 $4.3 Accrued Liabilities $2.0 $2.1 $2.2 $2.3 $2.4 $2.4 $2.5 $2.6 $2.8 $2.9 $3.1 Other Current Liabilities $1.0 $0.0 $2.0 $1.0 $0.0 $0.0 $1.0 $1.0 $1.0 $1.0 $1.0 Total Current Liabilities $5.8 $5.1 $7.1 $6.6 $5.7 $5.7 $7.0 $7.3 $7.6 $8.0 $8.3 Revolving Credit Facility $8.9 $9.3 $9.7 $10.2 $10.6 $7.0 $1.2 $0.0 $0.0 $0.0 $0.0 Term Loan $200.0 $200.0 $200.0 $200.0 $200.0 $132.0 $107.0 $82.0 $57.0 $32.0 $7.0 Second Lien Debt $99.0 $99.0 $99.0 $99.0 $99.0 $99.0 Unsecured Debt $100.0 $100.0 $100.0 $100.0 $100.0 $66.0 $72.9 $80.6 $89.1 $98.5 $108.9 Other Liabilities $1.0 $2.0 $1.0 $0.0 $2.0 $2.0 $2.0 $2.0 $2.0 $2.0 $2.0 Total Liabilities $315.6 $316.4 $317.9 $316.7 $318.3 $311.7 $289.2 $270.9 $254.8 $239.5 $225.2 $6.9 $7.7 $8.5 $9.4 $10.4 Shareholders Equity Retainined Earnings $0.0 $17.1 $34.7 $55.1 $77.6 $0.0 $24.2 $50.9 $80.0 $111.8 $146.4 Other (Plug / Balance) $0.0 $0.0 $0.0 $0.0 $0.0 $108.0 $108.0 $108.0 $108.0 $108.0 $108.0 Total Shareholders Equity $0.0 $17.1 $34.7 $55.1 $77.6 $108.0 $132.2 $158.9 $188.0 $219.8 $254.4 Total Liabilities and Equity $315.6 $333.5 $352.6 $371.9 $395.9 $419.7 $421.4 $429.8 $442.8 $459.3 $479.6 Check $0.0 $0.0 $0.0 $0.0 $0.0 $0.0 $0.0 $0.0 $0.0 $0.0 $0.0 Page 62
  • 63.
    COMPANY A FINANCIALMODEL HISTORICAL FINANCIAL STATEMENTS PROJECTED FINANCIAL STATEMENTS ($ in millions) Fiscal Year Ending December 31, Pro Forma Fiscal Year Ending December 31, 2001A 2002A 2003A 2004A 2005A 2005P 2006P 2007P 2008P 2009P 2010P Cash Flow Net Income na $17.1 $17.6 $21.2 $22.4 $24.2 $26.7 $29.2 $31.8 $34.6 Plus / (minus): Depreciation and Amortization na $5 $5 $5 $5 $8 $8 $8 $8 $9 Changes in Working Capital Accounts Receivable na ($0.4) ($0.4) ($0.4) ($0.4) ($0.6) ($0.5) ($0.6) ($0.6) ($0.6) Inventory na ($0.1) ($0.1) ($0.1) ($0.1) ($0.2) ($0.2) ($0.2) ($0.2) ($0.2) Other Current Assets na $0.0 $0.0 $0.0 $0.0 $0.0 $0.0 $0.0 $0.0 $0.0 Accounts Payable na $0.3 ($0.1) $0.3 $0.0 $0.2 $0.2 $0.2 $0.2 $0.2 Accrued Liabilities na $0.1 $0.1 $0.1 $0.1 $0.1 $0.1 $0.1 $0.1 $0.1 Other Current Liabilities na ($1.0) $2.0 ($1.0) ($1.0) $1.0 $0.0 $0.0 $0.0 $0.0 Change in Other Liabilities na $1 ($1) ($1) $2 $0 $0 $0 $0 $0 Cash Flows from Operations na $21.9 $23.1 $24.1 $28.0 $32.7 $34.3 $37.0 $39.8 $42.8 Cash Flows from Investing Capital Expenditures na ($6.0) ($7.0) ($8.0) ($9.0) ($8.8) ($9.3) ($9.7) ($10.2) ($10.7) Asset Dispostions na $0.0 $2.0 $1.0 $0.0 $0.0 $0.0 $0.0 $0.0 $0.0 Cash Flows from Investing na ($6.0) ($5.0) ($7.0) ($9.0) ($8.8) ($9.3) ($9.7) ($10.2) ($10.7) Cash Flows from Financing Change in Revolver na $0.4 $0.4 $0.4 $0.4 ($5.8) ($1.2) $0.0 $0.0 $0.0 Change in Term Loan na $0.0 $0.0 $0.0 $0.0 ($25.0) ($25.0) ($25.0) ($25.0) ($25.0) Change in Second Lien $0.0 $0.0 $0.0 $0.0 $0.0 Change in Unsecured Debt na $0.0 $0.0 $0.0 $0.0 $6.9 $7.7 $8.5 $9.4 $10.4 Total Cash Flows from Financing na $0.4 $0.4 $0.4 $0.4 ($23.8) ($18.5) ($16.5) ($15.6) ($14.6) Total Cash Flow na $16.3 $18.5 $17.6 $19.5 $0.0 $6.6 $10.8 $14.0 $17.4 Beginning Cash Position na $5.0 $21.3 $39.9 $57.4 $0.0 $0.0 $6.6 $17.3 $31.3 Change in Cash Position na $16.3 $18.5 $17.6 $19.5 $0.0 $6.6 $10.8 $14.0 $17.4 Ending Cash Position na $21.3 $39.9 $57.4 $76.9 $0.0 $6.6 $17.3 $31.3 $48.8 Page 63
  • 64.
    COMPANY A FINANCIALMODEL HISTORICAL FINANCIAL STATEMENTS PROJECTED FINANCIAL STATEMENTS ($ in millions) Fiscal Year Ending December 31, Pro Forma Fiscal Year Ending December 31, 2001A 2002A 2003A 2004A 2005A 2005P 2006P 2007P 2008P 2009P 2010P Cash flow before Revolver $5.8 $7.8 $17.3 $31.3 $48.8 Debt and Interest Schedule Revolver Beginning Revolver Balance $8.9 $9.3 $9.7 $10.2 $7.0 $1.2 $0.0 $0.0 $0.0 (Paydown) / Drawdown $0.4 $0.4 $0.4 $0.4 ($5.8) ($1.2) $0.0 $0.0 $0.0 Ending Revolver Balance $9.3 $9.7 $10.2 $10.6 $1.2 $0.0 $0.0 $0.0 $0.0 Interest Rate 6.0% 6.0% 6.0% 6.0% 5.00% 5.00% 5.00% 5.00% 5.00% Cash Pay Interest Expense $0.54 $0.57 $0.60 $0.62 $0.21 $0.03 $0.00 $0.00 $0.00 Term Loan Term Loan Beginning Balance $200.0 $200.0 $200.0 $200.0 $132.0 $107.0 $82.0 $57.0 $32.0 (Paydown) / Drawdown $0.0 $0.0 $0.0 $0.0 ($25.0) ($25.0) ($25.0) ($25.0) ($25.0) Term Loan Ending Balance $200.0 $200.0 $200.0 $200.0 $107.0 $82.0 $57.0 $32.0 $7.0 Interest Rate 6.00% 6.00% 6.00% 6.00% 5.00% 5.00% 5.00% 5.00% 5.00% Cash Pay Interest Expense $12.0 $12.0 $12.0 $12.0 $6.0 $4.7 $3.5 $2.2 $1.0 Second Lien Debt Second Lien Debt Beginning Balance $99.0 $99.0 $99.0 $99.0 $99.0 (Paydown) / Drawdown $0.0 $0.0 $0.0 $0.0 $0.0 Second Lien Debt Ending Balance $99.0 $99.0 $99.0 $99.0 $99.0 Cash Pay Interest Rate 8.00% 8.00% 8.00% 8.00% 8.00% Cash Pay Interest Expense $7.9 $7.9 $7.9 $7.9 $7.9 PIK Interest Rate 0% 0% 0% 0% 0% PIK Interest Expense $0.0 $0.0 $0.0 $0.0 $0.0 Unsecured Debt Unsecured Debt Beginning Balance $100.0 $100.0 $100.0 $100.0 $66.0 $72.9 $80.6 $89.1 $98.5 (Paydown) / Drawdown $0.0 $0.0 $0.0 $0.0 $0.0 $0.0 $0.0 $0.0 $0.0 Unsecured Debt Ending Balance $100.0 $100.0 $100.0 $100.0 $72.9 $80.6 $89.1 $98.5 $108.9 Cash Pay Interest Rate 12% 12% 12% 12% 0% 0% 0% 0% 0% Cash Pay Interest Expense $12.0 $12.0 $12.0 $12.0 $0.0 $0.0 $0.0 $0.0 $0.0 PIK Interest Rate 10% 10% 10% 10% 10% PIK Interest Expense $6.9 $7.7 $8.5 $9.4 $10.4 Total Interest Expense $24.5 $24.6 $24.6 $24.6 $21.0 $20.4 $19.9 $19.5 $19.3 Total Cash Pay Interest Rate Expense $14.1 $12.7 $11.4 $10.1 $8.9 Total PIK Interest Rate Expense $6.9 $7.7 $8.5 $9.4 $10.4 Interest Earned on Cash $0.2 $0.5 $0.7 $1.0 $0.0 $0.1 $0.3 $0.7 $1.3 Page 64
  • 65.
    COMPANY A FINANCIALMODEL HISTORIC VARIABLES AND ASSUMPTIONS FOR PROJECTIONS HISTORICAL VARIABLES AND DRIVERS ASSUMPTIONS FOR PROJECTIONS Fiscal Year Ending December 31, Fiscal Year Ending December 31, 2001A 2002A 2003A 2004A 2005A 2006P 2007P 2008P 2009P 2010P Income Statement Drivers / Assumptions Revenue Growth Rate na 5.0% 4.8% 4.5% 4.3% 5.0% 5.0% 5.0% 5.0% 5.0% COGS as % of Revenue 20.0% 20.0% 20.0% 20.0% 20.0% 20.0% 20.0% 20.0% 20.0% 20.0% Depreciation as % of Gross PP&E 1.6% 1.5% 1.5% 1.5% 1.4% 2.0% 2.0% 2.0% 2.0% 2.0% Goodwill Amortization Intangible Amortization Per Year 20 Intangible Amortization $0.8 $0.8 $0.8 $0.8 $0.8 SG&A as % of Sales 25.0% 25.0% 25.0% 25.0% 25.0% 25.0% 25.0% 25.0% 25.0% 25.0% Other Income / (Expense) $2.0 $0.0 ($2.0) $1.0 $0.0 $0.0 $0.0 $0.0 $0.0 $0.0 Tax Rate 40.0% 40.0% 40.0% 40.0% 40.0% 40.0% 40.0% 40.0% 40.0% 40.0% Balance Sheet Drivers / Assumptions Days Accounts Receivable 30 30 30 30 30 30 30 30 30 30 Days Inventory 45 45 45 45 45 45 45 45 45 45 Other Current Assets $1.0 $1.0 $1.0 $1.0 $1.0 $1.0 $1.0 $1.0 $1.0 $1.0 Amortize Goodwill? (yes or no) $0.0 $0.0 $0.0 $0.0 $0.0 Capex as % of Sales na 5.7% 6.4% 7.0% 7.5% 7.0% 7.0% 7.0% 7.0% 7.0% Asset Disposition na $0.0 $2.0 $1.0 $0.0 $0.0 $0.0 $0.0 $0.0 $0.0 Days Payable 50 52 48 51 49 50 50 50 50 50 Accrued Liabilities as % of COGS 10.0% 10.0% 10.0% 10.0% 10.0% 10.0% 10.0% 10.0% 10.0% 10.0% Other Current Liabilities $1.0 $0.0 $2.0 $1.0 $0.0 $1.0 $1.0 $1.0 $1.0 $1.0 Other Liailities $1.0 $2.0 $1.0 $0.0 $2.0 $2.0 $2.0 $2.0 $2.0 $2.0 Interest Rates Revolver 2.0%+li 6.00% 6.00% 6.00% 6.00% 6.00% 5.00% 5.00% 5.00% 5.00% 5.00% Term Loan 2.0%+li 6.00% 6.00% 6.00% 6.00% 6.00% 5.00% 5.00% 5.00% 5.00% 5.00% Second Lien Debt (Cash) 8.00% 8.00% 8.00% 8.00% 8.00% Second Lien Debt (PIK) 0.00% 0.00% 0.00% 0.00% 0.00% Unsecured Debt (Cash) 12.0% 12.00% 12.00% 12.00% 12.00% 12.00% 0.00% 0.00% 0.00% 0.00% 0.00% Unsecured Debt (PIK) 10.00% 10.00% 10.00% 10.00% 10.00% LIBOR 4.00% 4.00% 4.00% 4.00% 4.00% 4.25% 4.50% 4.75% 5.00% 5.25% Interest earned on cash 2% 2.00% 2.00% 2.00% 2.00% 2.00% 2.25% 2.50% 2.75% 3.00% 3.25% Page 65
  • 66.
    COMPANY A FINANCIALMODEL SENSITIVITIES ($ in millions) 2010 EBITDA FOR RANGE OF REVENUE GROWTH RATES AND COGS Annual Revenue Growth Rate $84.2 -20% -15% -10% -5% 0% 5% 10% 15% 20% 14% $24.0 $32.5 $43.2 $56.6 $73.2 $93.4 $117.9 $147.2 $182.1 16% $23.2 $31.4 $41.8 $54.8 $70.8 $90.4 $114.0 $142.4 $176.2 18% $22.4 $30.3 $40.4 $52.9 $68.4 $87.3 $110.2 $137.6 $170.2 20% $21.6 $29.3 $39.0 $51.1 $66.0 $84.2 $106.3 $132.7 $164.2 22% $20.8 $28.2 $37.6 $49.2 $63.6 $81.2 $102.4 $127.9 $158.3 24% $20.1 $27.2 $36.1 $47.4 $61.2 $78.1 $98.6 $123.1 $152.3 26% $19.3 $26.1 $34.7 $45.5 $58.8 $75.0 $94.7 $118.3 $146.3 Shading indicates base case scenario COGSas%of Sales Page 66