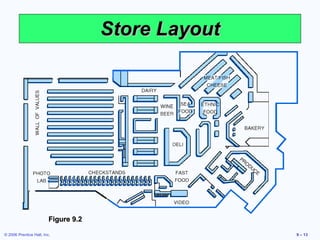
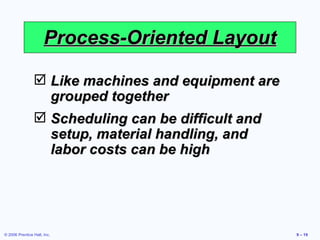
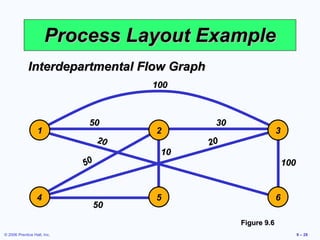
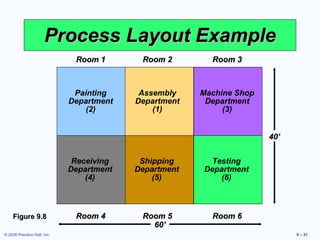
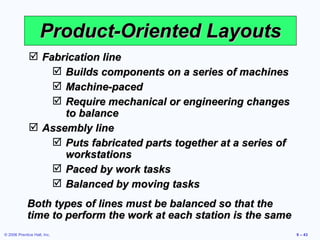
Operations Management Chapter 9 –  Layout Strategy © 2006 Prentice Hall, Inc.
Innovations at McDonald’s Indoor seating (1950s) Drive-through window  (1970s) Adding breakfast to the menu (1980s) Adding play areas (1990s) Three out of the four are layout decisions!
Strategic Importance of Layout Decisions The objective of  layout strategy is to develop an economic layout  that will meet the firm’s competitive requirements
Layout Design Considerations Higher  utilization of space , equipment, and people Improved  flow of information , materials, or people Improved  employee morale  and safer working conditions Improved  customer/client interaction Flexibility
Types of Layout Office layout  Retail layout  Warehouse layout Fixed-position layout Process-oriented layout Work cell layout  Product-oriented layout
Types of Layout Office layout - positions workers, their equipment, and spaces/offices to provide for movement of information Retail layout - allocates  shelf space  and responds to customer behavior  Warehouse layout - addresses trade-offs between space and material handling
Types of Layout Fixed-position layout - addresses the layout requirements of large, bulky  projects such as ships and buildings Process-oriented layout - deals with  low-volume, high-variety  production (also called job shop or intermittent production)
Types of Layout Work cell layout - a  special arrangement of machinery  and equipment to focus on production of  a single product or group of related products Product-oriented layout - seeks the best  personnel and machine  utilizations in repetitive or continuous production
Good Layouts Consider Material handling equipment Capacity and space requirements Environment and aesthetics Flows of information Cost of moving between various work areas
Office Layout Grouping of workers, their equipment, and spaces to provide comfort, safety, and movement of information Movement of information is main distinction Typically in state of flux due to frequent technological changes
Relationship Chart Figure 9.1 Not desirable X Unimportant U Ordinary OK O Important I Especially important E Absolutely necessary A Closeness Value President Chief Technology Officer Engineer’s area Secretary Office entrance Central files Equipment cabinet Photocopy equipment Storage room O U A X O U A I O A I O U A I I A U O A U O U X O I U O I I I E E E E E 1 2 3 4 5 6 7 8 9
Supermarket  Retail Layout Objective is to  maximize profitability per square foot of floor space Sales and profitability vary directly with  customer exposure Things at the counter have the most exposure.
Store Layout Figure 9.2
Retail Slotting Manufacturers pay fees to retailers to get the retailers to display (slot) their product Contributing factors Limited shelf space An increasing number of new products Better information about sales through POS data collection Closer control of inventory
Warehousing and Storage Layouts Objective is to optimize trade-offs between handling costs and costs associated with warehouse space Maximize the total “cube” of the warehouse –  utilize its full volume  while maintaining low material handling costs More location than layout decision.
Cross-Docking Materials are moved directly from receiving to shipping and are not placed in storage in the warehouse Requires tight scheduling and accurate shipments, typically with bar code identification
Fixed-Position Layout Product remains in one place  Workers and equipment come to site Complicating factors Limited space at site Different materials required at different stages of the project Volume of materials needed is dynamic
Alternative Strategy As much of the project as possible is completed off-site in a product-oriented facility This can significantly improve efficiency but is only possible when multiple similar units need to be created
Process-Oriented Layout Like machines and equipment are grouped together Scheduling can be difficult and setup, material handling, and labor costs can be high
Process-Oriented Layout Figure 9.3 Surgery Radiology ER triage room ER Beds Pharmacy Emergency room admissions Billing/exit Laboratories Patient A - broken leg Patient B - erratic heart pacemaker
Process-Oriented Layout Arrange work centers so as to  minimize the costs of material handling Basic cost elements are Number of loads (or people) moving between centers Distance loads (or people) move between centers
Layout at Arnold Palmer Hospital
Process-Oriented Layout where n = total number of work centers or departments i, j = individual departments X ij = number of loads moved from department i to department j C ij = cost to move a load between department i and department j Minimize cost =  ∑ ∑  X ij  C ij n i  = 1 n j  = 1
Process Layout Example Construct a “from-to matrix” Determine the space requirements Develop an initial schematic diagram Determine the cost of this layout  Try to improve the layout Prepare a detailed plan  Arrange six departments in a factory to minimize the material handling costs. Each department is 20 x 20 feet and the building is 60 feet long and 40 feet wide.
Process Layout Example 50 100 0 0 20 30 50 10 0 20 0 100 50 0 0 Figure 9.4 Department Assembly Painting Machine Receiving Shipping Testing (1) (2) Shop (3) (4) (5) (6) Assembly (1) Painting (2) Machine Shop (3) Receiving (4) Shipping (5) Testing (6) Number of loads per week
Process Layout Example Receiving Shipping Testing Department Department Department (4) (5) (6) Figure 9.5 Assembly Painting Machine Shop Department Department Department (1) (2) (3) Room 1 Room 2 Room 3 Room 4 Room 5 Room 6 60’ 40’
Process Layout Example Cost  = $50 + $200 + $40 (1 and 2) (1 and 3) (1 and 6) + $30 + $50 + $10 (2 and 3) (2 and 4) (2 and 5) + $40 + $100 + $50 (3 and 4) (3 and 6) (4 and 5) = $570 Cost =  ∑ ∑  X ij  C ij n i  = 1 n j  = 1
Process Layout Example Interdepartmental Flow Graph Figure 9.6 100 50 20 50 50 20 10 100 30 1 2 3 4 5 6
Process Layout Example Cost  = $50 + $100 + $20 (1 and 2) (1 and 3) (1 and 6) + $60 + $50 + $10 (2 and 3) (2 and 4) (2 and 5) + $40 + $100 + $50 (3 and 4) (3 and 6) (4 and 5) = $480 Cost =  ∑ ∑  X ij  C ij n i  = 1 n j  = 1
Process Layout Example Interdepartmental Flow Graph Figure 9.7 30 50 10 50 50 20 50 100 100 2 1 3 4 5 6
Process Layout Example Receiving Shipping Testing Department Department Department (4) (5) (6) Figure 9.8   Painting    Assembly  Machine Shop Department Department Department (2) (1) (3) Room 1 Room 2 Room 3 Room 4 Room 5 Room 6 60’ 40’
Computer Software Graphical approach only works for small problems Computer programs are available to solve bigger problems CRAFT ALDEP CORELAP Factory Flow
Work Cells Reorganizes people and machines into groups to focus on single products or product groups Group technology identifies products that have similar characteristics for particular cells Volume must justify cells Cells can be reconfigured as designs or volume changes
Improving Layouts Using Work Cells Current layout - straight lines make it hard to balance tasks because work may not be divided evenly Improved layout - in U shape, workers have better access. Four cross-trained workers were reduced. Figure 9.10 (b) U-shaped line may reduce employee movement and space requirements while enhancing communication, reducing the number of workers, and facilitating inspection
Requirements of Work Cells Identification of families of products A high level of training and flexibility on the part of employees Either staff support or flexible, imaginative employees to establish work cells initially Test (poka-yoke) at each station in the cell
Staffing and Balancing Work Cells Determine the takt time Takt time = total work time available units required Determine the number of operators required Workers required = total operation time required takt time
Staffing Work Cells Example 600  Mirrors per day required Mirror production scheduled for  8  hours per day From a work balance chart  total operation time  = 140  seconds Standard time required Operations Assemble Paint Test Label Pack for shipment 60 50 40 30 20 10 0
Staffing Work Cells Example 600  Mirrors per day required Mirror production scheduled for  8  hours per day From a work balance chart  total operation time =  140  seconds Takt time =  (8  hrs  x 60  mins ) / 600  units  = .8  mins  = 48  seconds Workers required = total operation time required takt time = 140 / 48 = 2.91
Work Balance Charts Used for evaluating operation times in work cells Can help identify bottleneck operations Flexible, cross-trained employees can help address labor bottlenecks Machine bottlenecks may require other approaches
Focused Work Center and Focused Factory Focused Work Center Identify a large family of similar products that have a large and stable demand Moves production from a general-purpose, process-oriented facility to a large work cell Focused Factory A focused work cell in a separate facility May be focused by product line, layout, quality, new product introduction, flexibility, or other requirements
Focused Work Center and Focused Factory Table 9.2 Example: A plant to produce window mechanism for automobiles. Example: Pipe bracket manufacturing at a shipyard. Example: A job shop with machinery and personnel; rearranged to produce 300 unique control panels. A focused factory is a permanent facility to produce a product or component in a product-oriented facility. Many focused factories currently being built were originally part of a process-oriented facility. A focused work center is a permanent product-oriented arrangement of machines and personnel in what is ordinarily a process-oriented facility. A work cell is a temporary product-oriented arrangement of machines and personnel in what is ordinarily a process-oriented facility. Focused Factory Focused Work Center Work Cell
Repetitive and Product-Oriented Layout Volume is adequate for high equipment utilization Product demand is stable enough to justify high investment in specialized equipment Product is standardized or approaching a phase of life cycle that justifies investment  Supplies of raw materials and components are adequate and of uniform quality Organized around products or families of similar high-volume, low-variety products
Product-Oriented Layouts Fabrication line Builds components on a series of machines Machine-paced Require mechanical or engineering changes to balance Assembly line Puts fabricated parts together at a series of workstations Paced by work tasks Balanced by moving tasks Both types of lines must be balanced so that the time to perform the work at each station is the same
Product-Oriented Layouts Low variable cost per unit Low material handling costs Reduced work-in-process inventories Easier training and supervision Rapid throughput Advantages High volume is required Work stoppage at any point ties up the whole operation Lack of flexibility in product or production rates Disadvantages
Assembly-Line Balancing Objective is to minimize the imbalance between machines or personnel while meeting required output Starts with the precedence relationships Determine cycle time Calculate theoretical minimum number of workstations Balance the line by assigning specific tasks to workstations
Copier Example This means that tasks B and E cannot be done until task A has been completed Performance Task Must Follow Time Task Listed Task (minutes) Below A 10 — B 11 A C 5 B D 4 B E 12 A F 3 C, D G 7 F H 11 E I 3 G, H Total time  66
Copier Example Figure 9.13 Performance Task Must Follow Time Task Listed Task (minutes) Below A 10 — B 11 A C 5 B D 4 B E 12 A F 3 C, D G 7 F H 11 E I 3 G, H Total time  66 I G F C D H B E A 10 11 12 5 4 3 7 11 3
Copier Example 480 available mins per day 40 units required I G F C D H B E A 10 11 12 5 4 3 7 11 3 Figure 9.13 Performance Task Must Follow Time Task Listed Task (minutes) Below A 10 — B 11 A C 5 B D 4 B E 12 A F 3 C, D G 7 F H 11 E I 3 G, H Total time  66 Cycle time = Production time available per day Units required per day = 480 / 40 = 12  minutes per unit Minimum number of workstations = ∑  Time for task i Cycle time n i = 1 = 66 / 12 = 5.5  or  6  stations
Copier Example Line-Balancing Heuristics Table 9.4 I G F C D H B E A 10 11 12 5 4 3 7 11 3 Figure 9.13 Performance Task Must Follow Time Task Listed Task (minutes) Below A 10 — B 11 A C 5 B D 4 B E 12 A F 3 C, D G 7 F H 11 E I 3 G, H Total time  66 480 available mins per day 40 units required Cycle time =  12  mins Minimum workstations = 5.5  or  6 Choose the available task with the least number of following tasks 5. Least number of following tasks Choose the available task with the shortest task time 4. Shortest task time Choose the available task for which the sum of following task times is the longest 3. Ranked positional weight Choose the available task with the largest number of following tasks 2. Most following tasks Choose the available task with the longest task time 1. Longest task time
Copier Example Figure 9.14 480 available mins per day 40 units required Cycle time =  12  mins Minimum workstations = 5.5  or  6 Performance Task Must Follow Time Task Listed Task (minutes) Below A 10 — B 11 A C 5 B D 4 B E 12 A F 3 C, D G 7 F H 11 E I 3 G, H Total time  66 I G F H C D B E A 10 11 12 5 4 3 7 11 3 Station 1 Station 2 Station 3 Station 5 Station 4 Station 6
Copier Example Performance Task Must Follow Time Task Listed Task (minutes) Below A 10 — B 11 A C 5 B D 4 B E 12 A F 3 C, D G 7 F H 11 E I 3 G, H Total time  66 480 available mins per day 40 units required Cycle time =  12  mins Minimum workstations = 5.5  or  6 Efficiency = ∑  Task times (actual number of workstations) x (largest cycle time) = 66  minutes  / (6  stations ) x (12  minutes ) = 91.7%

Layout strategies

  • 1.
    Operations Management Chapter9 – Layout Strategy © 2006 Prentice Hall, Inc.
  • 2.
    Innovations at McDonald’sIndoor seating (1950s) Drive-through window (1970s) Adding breakfast to the menu (1980s) Adding play areas (1990s) Three out of the four are layout decisions!
  • 3.
    Strategic Importance ofLayout Decisions The objective of layout strategy is to develop an economic layout that will meet the firm’s competitive requirements
  • 4.
    Layout Design ConsiderationsHigher utilization of space , equipment, and people Improved flow of information , materials, or people Improved employee morale and safer working conditions Improved customer/client interaction Flexibility
  • 5.
    Types of LayoutOffice layout Retail layout Warehouse layout Fixed-position layout Process-oriented layout Work cell layout Product-oriented layout
  • 6.
    Types of LayoutOffice layout - positions workers, their equipment, and spaces/offices to provide for movement of information Retail layout - allocates shelf space and responds to customer behavior Warehouse layout - addresses trade-offs between space and material handling
  • 7.
    Types of LayoutFixed-position layout - addresses the layout requirements of large, bulky projects such as ships and buildings Process-oriented layout - deals with low-volume, high-variety production (also called job shop or intermittent production)
  • 8.
    Types of LayoutWork cell layout - a special arrangement of machinery and equipment to focus on production of a single product or group of related products Product-oriented layout - seeks the best personnel and machine utilizations in repetitive or continuous production
  • 9.
    Good Layouts ConsiderMaterial handling equipment Capacity and space requirements Environment and aesthetics Flows of information Cost of moving between various work areas
  • 10.
    Office Layout Groupingof workers, their equipment, and spaces to provide comfort, safety, and movement of information Movement of information is main distinction Typically in state of flux due to frequent technological changes
  • 11.
    Relationship Chart Figure9.1 Not desirable X Unimportant U Ordinary OK O Important I Especially important E Absolutely necessary A Closeness Value President Chief Technology Officer Engineer’s area Secretary Office entrance Central files Equipment cabinet Photocopy equipment Storage room O U A X O U A I O A I O U A I I A U O A U O U X O I U O I I I E E E E E 1 2 3 4 5 6 7 8 9
  • 12.
    Supermarket RetailLayout Objective is to maximize profitability per square foot of floor space Sales and profitability vary directly with customer exposure Things at the counter have the most exposure.
  • 13.
  • 14.
    Retail Slotting Manufacturerspay fees to retailers to get the retailers to display (slot) their product Contributing factors Limited shelf space An increasing number of new products Better information about sales through POS data collection Closer control of inventory
  • 15.
    Warehousing and StorageLayouts Objective is to optimize trade-offs between handling costs and costs associated with warehouse space Maximize the total “cube” of the warehouse – utilize its full volume while maintaining low material handling costs More location than layout decision.
  • 16.
    Cross-Docking Materials aremoved directly from receiving to shipping and are not placed in storage in the warehouse Requires tight scheduling and accurate shipments, typically with bar code identification
  • 17.
    Fixed-Position Layout Productremains in one place Workers and equipment come to site Complicating factors Limited space at site Different materials required at different stages of the project Volume of materials needed is dynamic
  • 18.
    Alternative Strategy Asmuch of the project as possible is completed off-site in a product-oriented facility This can significantly improve efficiency but is only possible when multiple similar units need to be created
  • 19.
    Process-Oriented Layout Likemachines and equipment are grouped together Scheduling can be difficult and setup, material handling, and labor costs can be high
  • 20.
    Process-Oriented Layout Figure9.3 Surgery Radiology ER triage room ER Beds Pharmacy Emergency room admissions Billing/exit Laboratories Patient A - broken leg Patient B - erratic heart pacemaker
  • 21.
    Process-Oriented Layout Arrangework centers so as to minimize the costs of material handling Basic cost elements are Number of loads (or people) moving between centers Distance loads (or people) move between centers
  • 22.
    Layout at ArnoldPalmer Hospital
  • 23.
    Process-Oriented Layout wheren = total number of work centers or departments i, j = individual departments X ij = number of loads moved from department i to department j C ij = cost to move a load between department i and department j Minimize cost = ∑ ∑ X ij C ij n i = 1 n j = 1
  • 24.
    Process Layout ExampleConstruct a “from-to matrix” Determine the space requirements Develop an initial schematic diagram Determine the cost of this layout Try to improve the layout Prepare a detailed plan Arrange six departments in a factory to minimize the material handling costs. Each department is 20 x 20 feet and the building is 60 feet long and 40 feet wide.
  • 25.
    Process Layout Example50 100 0 0 20 30 50 10 0 20 0 100 50 0 0 Figure 9.4 Department Assembly Painting Machine Receiving Shipping Testing (1) (2) Shop (3) (4) (5) (6) Assembly (1) Painting (2) Machine Shop (3) Receiving (4) Shipping (5) Testing (6) Number of loads per week
  • 26.
    Process Layout ExampleReceiving Shipping Testing Department Department Department (4) (5) (6) Figure 9.5 Assembly Painting Machine Shop Department Department Department (1) (2) (3) Room 1 Room 2 Room 3 Room 4 Room 5 Room 6 60’ 40’
  • 27.
    Process Layout ExampleCost = $50 + $200 + $40 (1 and 2) (1 and 3) (1 and 6) + $30 + $50 + $10 (2 and 3) (2 and 4) (2 and 5) + $40 + $100 + $50 (3 and 4) (3 and 6) (4 and 5) = $570 Cost = ∑ ∑ X ij C ij n i = 1 n j = 1
  • 28.
    Process Layout ExampleInterdepartmental Flow Graph Figure 9.6 100 50 20 50 50 20 10 100 30 1 2 3 4 5 6
  • 29.
    Process Layout ExampleCost = $50 + $100 + $20 (1 and 2) (1 and 3) (1 and 6) + $60 + $50 + $10 (2 and 3) (2 and 4) (2 and 5) + $40 + $100 + $50 (3 and 4) (3 and 6) (4 and 5) = $480 Cost = ∑ ∑ X ij C ij n i = 1 n j = 1
  • 30.
    Process Layout ExampleInterdepartmental Flow Graph Figure 9.7 30 50 10 50 50 20 50 100 100 2 1 3 4 5 6
  • 31.
    Process Layout ExampleReceiving Shipping Testing Department Department Department (4) (5) (6) Figure 9.8 Painting Assembly Machine Shop Department Department Department (2) (1) (3) Room 1 Room 2 Room 3 Room 4 Room 5 Room 6 60’ 40’
  • 32.
    Computer Software Graphicalapproach only works for small problems Computer programs are available to solve bigger problems CRAFT ALDEP CORELAP Factory Flow
  • 33.
    Work Cells Reorganizespeople and machines into groups to focus on single products or product groups Group technology identifies products that have similar characteristics for particular cells Volume must justify cells Cells can be reconfigured as designs or volume changes
  • 34.
    Improving Layouts UsingWork Cells Current layout - straight lines make it hard to balance tasks because work may not be divided evenly Improved layout - in U shape, workers have better access. Four cross-trained workers were reduced. Figure 9.10 (b) U-shaped line may reduce employee movement and space requirements while enhancing communication, reducing the number of workers, and facilitating inspection
  • 35.
    Requirements of WorkCells Identification of families of products A high level of training and flexibility on the part of employees Either staff support or flexible, imaginative employees to establish work cells initially Test (poka-yoke) at each station in the cell
  • 36.
    Staffing and BalancingWork Cells Determine the takt time Takt time = total work time available units required Determine the number of operators required Workers required = total operation time required takt time
  • 37.
    Staffing Work CellsExample 600 Mirrors per day required Mirror production scheduled for 8 hours per day From a work balance chart total operation time = 140 seconds Standard time required Operations Assemble Paint Test Label Pack for shipment 60 50 40 30 20 10 0
  • 38.
    Staffing Work CellsExample 600 Mirrors per day required Mirror production scheduled for 8 hours per day From a work balance chart total operation time = 140 seconds Takt time = (8 hrs x 60 mins ) / 600 units = .8 mins = 48 seconds Workers required = total operation time required takt time = 140 / 48 = 2.91
  • 39.
    Work Balance ChartsUsed for evaluating operation times in work cells Can help identify bottleneck operations Flexible, cross-trained employees can help address labor bottlenecks Machine bottlenecks may require other approaches
  • 40.
    Focused Work Centerand Focused Factory Focused Work Center Identify a large family of similar products that have a large and stable demand Moves production from a general-purpose, process-oriented facility to a large work cell Focused Factory A focused work cell in a separate facility May be focused by product line, layout, quality, new product introduction, flexibility, or other requirements
  • 41.
    Focused Work Centerand Focused Factory Table 9.2 Example: A plant to produce window mechanism for automobiles. Example: Pipe bracket manufacturing at a shipyard. Example: A job shop with machinery and personnel; rearranged to produce 300 unique control panels. A focused factory is a permanent facility to produce a product or component in a product-oriented facility. Many focused factories currently being built were originally part of a process-oriented facility. A focused work center is a permanent product-oriented arrangement of machines and personnel in what is ordinarily a process-oriented facility. A work cell is a temporary product-oriented arrangement of machines and personnel in what is ordinarily a process-oriented facility. Focused Factory Focused Work Center Work Cell
  • 42.
    Repetitive and Product-OrientedLayout Volume is adequate for high equipment utilization Product demand is stable enough to justify high investment in specialized equipment Product is standardized or approaching a phase of life cycle that justifies investment Supplies of raw materials and components are adequate and of uniform quality Organized around products or families of similar high-volume, low-variety products
  • 43.
    Product-Oriented Layouts Fabricationline Builds components on a series of machines Machine-paced Require mechanical or engineering changes to balance Assembly line Puts fabricated parts together at a series of workstations Paced by work tasks Balanced by moving tasks Both types of lines must be balanced so that the time to perform the work at each station is the same
  • 44.
    Product-Oriented Layouts Lowvariable cost per unit Low material handling costs Reduced work-in-process inventories Easier training and supervision Rapid throughput Advantages High volume is required Work stoppage at any point ties up the whole operation Lack of flexibility in product or production rates Disadvantages
  • 45.
    Assembly-Line Balancing Objectiveis to minimize the imbalance between machines or personnel while meeting required output Starts with the precedence relationships Determine cycle time Calculate theoretical minimum number of workstations Balance the line by assigning specific tasks to workstations
  • 46.
    Copier Example Thismeans that tasks B and E cannot be done until task A has been completed Performance Task Must Follow Time Task Listed Task (minutes) Below A 10 — B 11 A C 5 B D 4 B E 12 A F 3 C, D G 7 F H 11 E I 3 G, H Total time 66
  • 47.
    Copier Example Figure9.13 Performance Task Must Follow Time Task Listed Task (minutes) Below A 10 — B 11 A C 5 B D 4 B E 12 A F 3 C, D G 7 F H 11 E I 3 G, H Total time 66 I G F C D H B E A 10 11 12 5 4 3 7 11 3
  • 48.
    Copier Example 480available mins per day 40 units required I G F C D H B E A 10 11 12 5 4 3 7 11 3 Figure 9.13 Performance Task Must Follow Time Task Listed Task (minutes) Below A 10 — B 11 A C 5 B D 4 B E 12 A F 3 C, D G 7 F H 11 E I 3 G, H Total time 66 Cycle time = Production time available per day Units required per day = 480 / 40 = 12 minutes per unit Minimum number of workstations = ∑ Time for task i Cycle time n i = 1 = 66 / 12 = 5.5 or 6 stations
  • 49.
    Copier Example Line-BalancingHeuristics Table 9.4 I G F C D H B E A 10 11 12 5 4 3 7 11 3 Figure 9.13 Performance Task Must Follow Time Task Listed Task (minutes) Below A 10 — B 11 A C 5 B D 4 B E 12 A F 3 C, D G 7 F H 11 E I 3 G, H Total time 66 480 available mins per day 40 units required Cycle time = 12 mins Minimum workstations = 5.5 or 6 Choose the available task with the least number of following tasks 5. Least number of following tasks Choose the available task with the shortest task time 4. Shortest task time Choose the available task for which the sum of following task times is the longest 3. Ranked positional weight Choose the available task with the largest number of following tasks 2. Most following tasks Choose the available task with the longest task time 1. Longest task time
  • 50.
    Copier Example Figure9.14 480 available mins per day 40 units required Cycle time = 12 mins Minimum workstations = 5.5 or 6 Performance Task Must Follow Time Task Listed Task (minutes) Below A 10 — B 11 A C 5 B D 4 B E 12 A F 3 C, D G 7 F H 11 E I 3 G, H Total time 66 I G F H C D B E A 10 11 12 5 4 3 7 11 3 Station 1 Station 2 Station 3 Station 5 Station 4 Station 6
  • 51.
    Copier Example PerformanceTask Must Follow Time Task Listed Task (minutes) Below A 10 — B 11 A C 5 B D 4 B E 12 A F 3 C, D G 7 F H 11 E I 3 G, H Total time 66 480 available mins per day 40 units required Cycle time = 12 mins Minimum workstations = 5.5 or 6 Efficiency = ∑ Task times (actual number of workstations) x (largest cycle time) = 66 minutes / (6 stations ) x (12 minutes ) = 91.7%