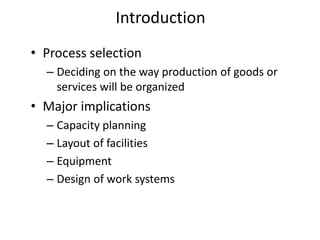
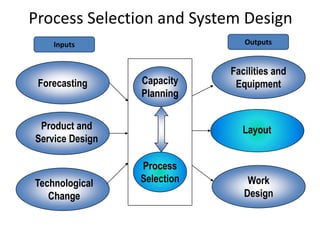
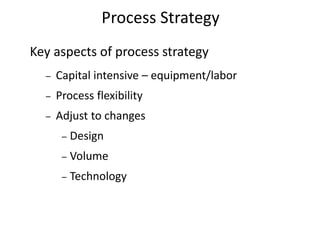
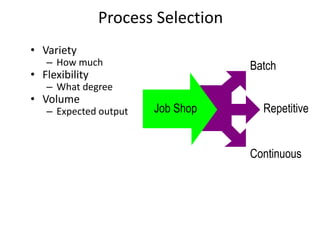
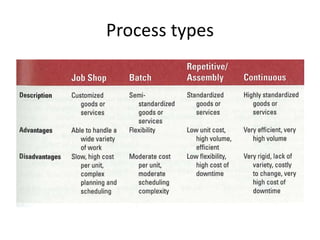
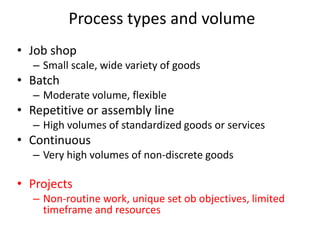
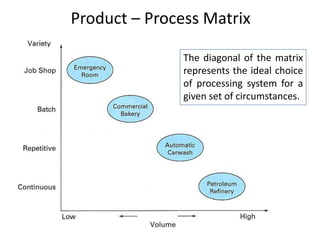
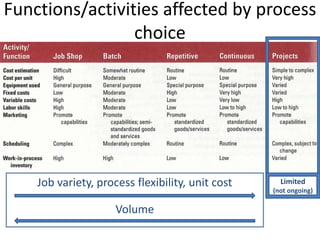
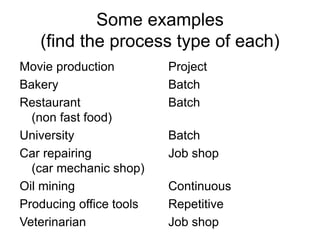
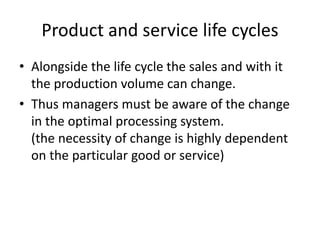
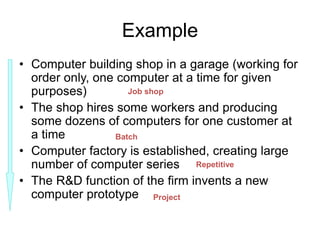
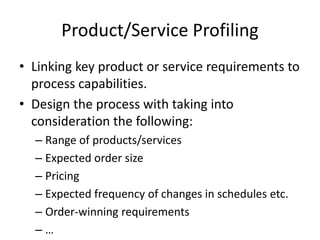
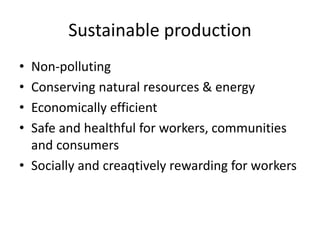
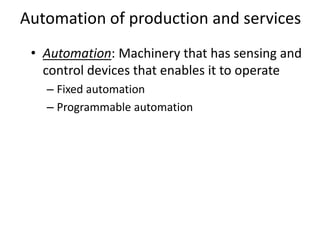
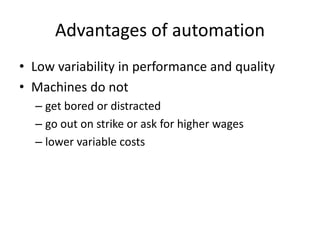
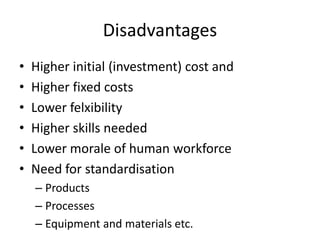
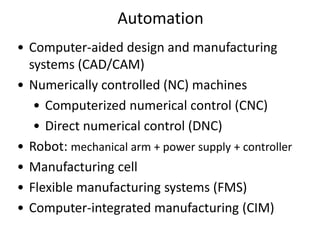
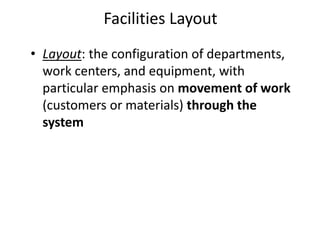
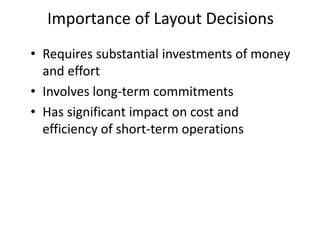
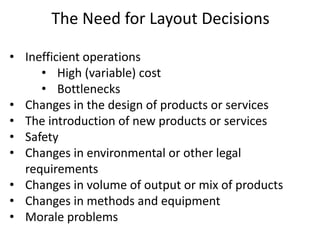
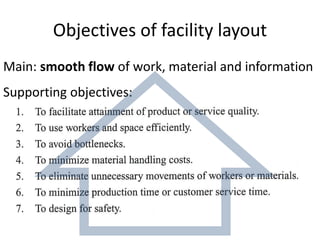
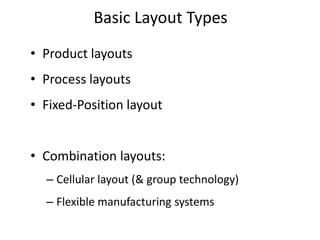
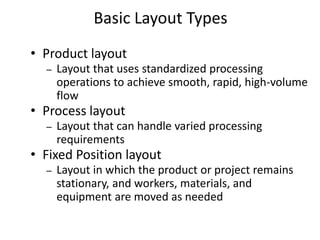
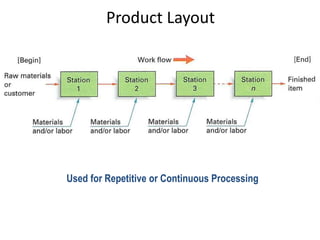
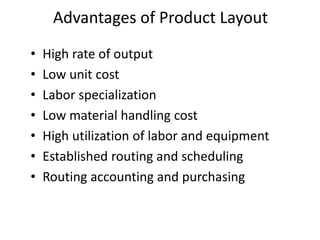
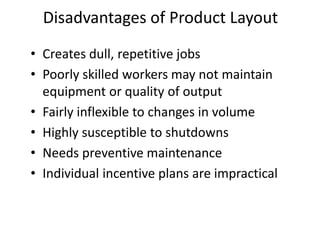
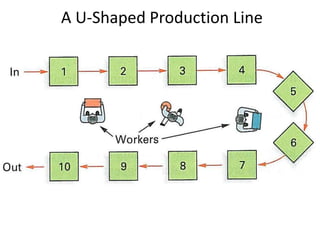
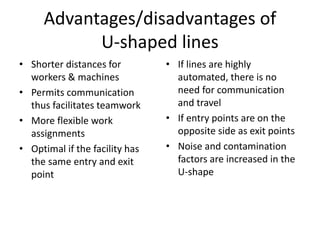
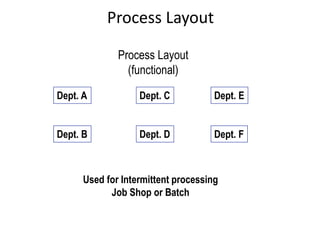
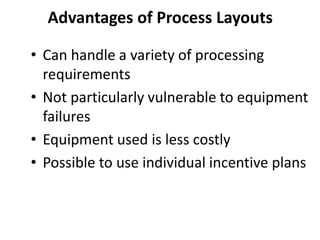
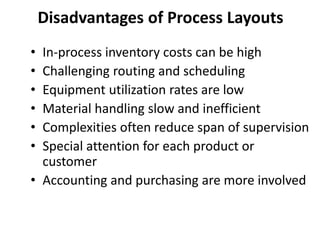
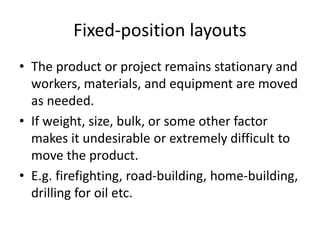
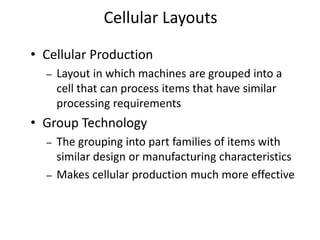
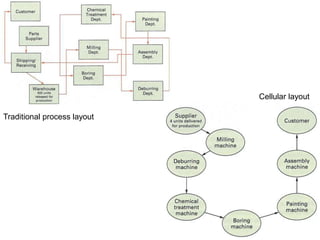
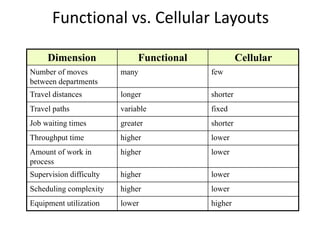
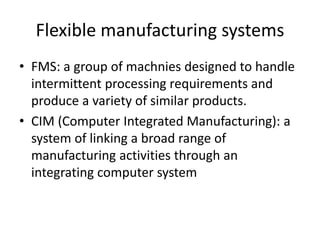
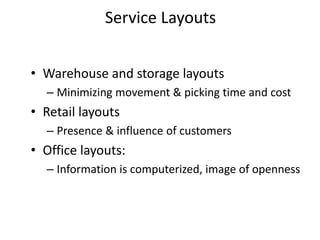
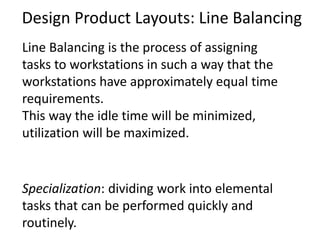
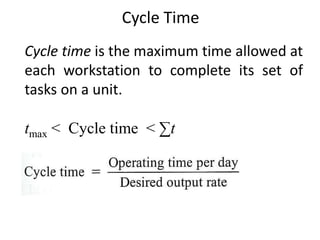
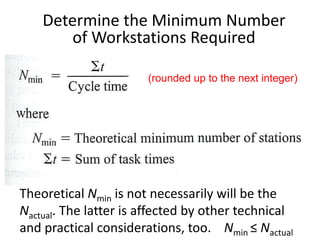
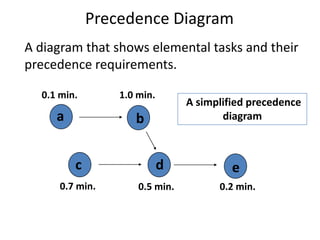
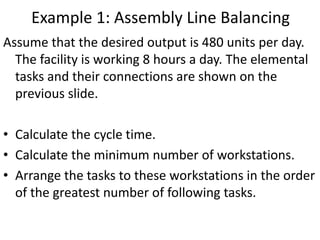
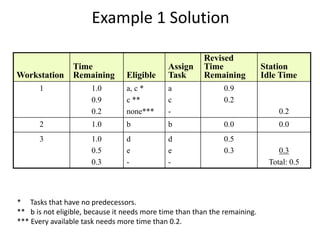
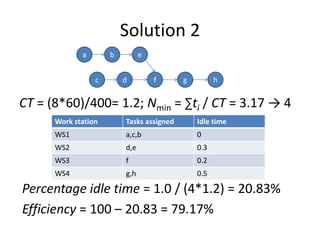
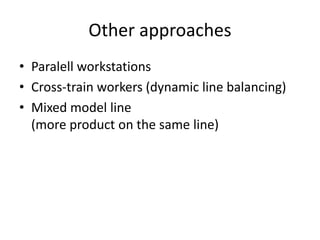
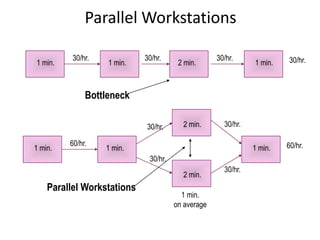
Process Selection
and Facility Layout
• Process selection
– Deciding on the way production of goods or
services will be organized
• Major implications
– Capacity planning
– Layout of facilities
– Equipment
– Design of work systems
Introduction
Forecasting
Product and
Service Design
Technological
Change
Capacity
Planning
Process
Selection
Facilities and
Equipment
Layout
Work
Design
Process Selection and System Design
Inputs Outputs
Key aspects of process strategy
– Capital intensive – equipment/labor
– Process flexibility
– Adjust to changes
– Design
– Volume
– Technology
Process Strategy
• Variety
– How much
• Flexibility
– What degree
• Volume
– Expected output Job Shop
Batch
Repetitive
Continuous
Process Selection
Process types
• Job shop
– Small scale, wide variety of goods
• Batch
– Moderate volume, flexible
• Repetitive or assembly line
– High volumes of standardized goods or services
• Continuous
– Very high volumes of non-discrete goods
• Projects
– Non-routine work, unique set ob objectives, limited
timeframe and resources
Process types and volume
Product – Process Matrix
The diagonal of the matrix
represents the ideal choice
of processing system for a
given set of circumstances.
Functions/activities affected by process
choice
Job variety, process flexibility, unit cost
Volume
Limited
(not ongoing)
Some examples
(find the process type of each)
Movie production
Bakery
Restaurant
(non fast food)
University
Car repairing
(car mechanic shop)
Oil mining
Producing office tools
Veterinarian
Project
Batch
Batch
Batch
Job shop
Continuous
Repetitive
Job shop
Product and service life cycles
• Alongside the life cycle the sales and with it
the production volume can change.
• Thus managers must be aware of the change
in the optimal processing system.
(the necessity of change is highly dependent
on the particular good or service)
Example
• Computer building shop in a garage (working for
order only, one computer at a time for given
purposes)
• The shop hires some workers and producing
some dozens of computers for one customer at
a time
• Computer factory is established, creating large
number of computer series
• The R&D function of the firm invents a new
computer prototype
Job shop
Batch
Repetitive
Project
Product/Service Profiling
• Linking key product or service requirements to
process capabilities.
• Design the process with taking into
consideration the following:
– Range of products/services
– Expected order size
– Pricing
– Expected frequency of changes in schedules etc.
– Order-winning requirements
– …
Sustainable production
• Non-polluting
• Conserving natural resources & energy
• Economically efficient
• Safe and healthful for workers, communities
and consumers
• Socially and creaqtively rewarding for workers
• Automation: Machinery that has sensing and
control devices that enables it to operate
– Fixed automation
– Programmable automation
Automation of production and services
Advantages of automation
• Low variability in performance and quality
• Machines do not
– get bored or distracted
– go out on strike or ask for higher wages
– lower variable costs
Disadvantages
• Higher initial (investment) cost and
• Higher fixed costs
• Lower felxibility
• Higher skills needed
• Lower morale of human workforce
• Need for standardisation
– Products
– Processes
– Equipment and materials etc.
• Computer-aided design and manufacturing
systems (CAD/CAM)
• Numerically controlled (NC) machines
• Computerized numerical control (CNC)
• Direct numerical control (DNC)
• Robot: mechanical arm + power supply + controller
• Manufacturing cell
• Flexible manufacturing systems (FMS)
• Computer-integrated manufacturing (CIM)
Automation
• Layout: the configuration of departments,
work centers, and equipment, with
particular emphasis on movement of work
(customers or materials) through the
system
Facilities Layout
• Requires substantial investments of money
and effort
• Involves long-term commitments
• Has significant impact on cost and
efficiency of short-term operations
Importance of Layout Decisions
The Need for Layout Decisions
• Inefficient operations
• High (variable) cost
• Bottlenecks
• Changes in the design of products or services
• The introduction of new products or services
• Safety
• Changes in environmental or other legal
requirements
• Changes in volume of output or mix of products
• Changes in methods and equipment
• Morale problems
Objectives of facility layout
Main: smooth flow of work, material and information
Supporting objectives:
• Product layouts
• Process layouts
• Fixed-Position layout
• Combination layouts:
– Cellular layout (& group technology)
– Flexible manufacturing systems
Basic Layout Types
• Product layout
– Layout that uses standardized processing
operations to achieve smooth, rapid, high-volume
flow
• Process layout
– Layout that can handle varied processing
requirements
• Fixed Position layout
– Layout in which the product or project remains
stationary, and workers, materials, and
equipment are moved as needed
Basic Layout Types
Used for Repetitive or Continuous Processing
Product Layout
• High rate of output
• Low unit cost
• Labor specialization
• Low material handling cost
• High utilization of labor and equipment
• Established routing and scheduling
• Routing accounting and purchasing
Advantages of Product Layout
• Creates dull, repetitive jobs
• Poorly skilled workers may not maintain
equipment or quality of output
• Fairly inflexible to changes in volume
• Highly susceptible to shutdowns
• Needs preventive maintenance
• Individual incentive plans are impractical
Disadvantages of Product Layout
A U-Shaped Production Line
Advantages/disadvantages of
U-shaped lines
• Shorter distances for
workers & machines
• Permits communication
thus facilitates teamwork
• More flexible work
assignments
• Optimal if the facility has
the same entry and exit
point
• If lines are highly
automated, there is no
need for communication
and travel
• If entry points are on the
opposite side as exit points
• Noise and contamination
factors are increased in the
U-shape
Dept. A
Dept. B Dept. D
Dept. C
Dept. F
Dept. E
Used for Intermittent processing
Job Shop or Batch
Process Layout
(functional)
Process Layout
• Can handle a variety of processing
requirements
• Not particularly vulnerable to equipment
failures
• Equipment used is less costly
• Possible to use individual incentive plans
Advantages of Process Layouts
• In-process inventory costs can be high
• Challenging routing and scheduling
• Equipment utilization rates are low
• Material handling slow and inefficient
• Complexities often reduce span of supervision
• Special attention for each product or
customer
• Accounting and purchasing are more involved
Disadvantages of Process Layouts
Fixed-position layouts
• The product or project remains stationary and
workers, materials, and equipment are moved
as needed.
• If weight, size, bulk, or some other factor
makes it undesirable or extremely difficult to
move the product.
• E.g. firefighting, road-building, home-building,
drilling for oil etc.
• Cellular Production
– Layout in which machines are grouped into a
cell that can process items that have similar
processing requirements
• Group Technology
– The grouping into part families of items with
similar design or manufacturing characteristics
– Makes cellular production much more effective
Cellular Layouts
Traditional process layout
Cellular layout
Dimension Functional Cellular
Number of moves
between departments
many few
Travel distances longer shorter
Travel paths variable fixed
Job waiting times greater shorter
Throughput time higher lower
Amount of work in
process
higher lower
Supervision difficulty higher lower
Scheduling complexity higher lower
Equipment utilization lower higher
Functional vs. Cellular Layouts
Flexible manufacturing systems
• FMS: a group of machnies designed to handle
intermittent processing requirements and
produce a variety of similar products.
• CIM (Computer Integrated Manufacturing): a
system of linking a broad range of
manufacturing activities through an
integrating computer system
• Warehouse and storage layouts
– Minimizing movement & picking time and cost
• Retail layouts
– Presence & influence of customers
• Office layouts:
– Information is computerized, image of openness
Service Layouts
Design Product Layouts: Line Balancing
Line Balancing is the process of assigning
tasks to workstations in such a way that the
workstations have approximately equal time
requirements.
This way the idle time will be minimized,
utilization will be maximized.
Specialization: dividing work into elemental
tasks that can be performed quickly and
routinely.
Cycle Time
Cycle time is the maximum time allowed at
each workstation to complete its set of
tasks on a unit.
tmax < Cycle time < ∑t
Determine the Minimum Number
of Workstations Required
Theoretical Nmin is not necessarily will be the
Nactual. The latter is affected by other technical
and practical considerations, too. Nmin ≤ Nactual
(rounded up to the next integer)
A diagram that shows elemental tasks and their
precedence requirements.
A simplified precedence
diagram
a b
c d e
0.1 min.
0.7 min.
1.0 min.
0.5 min. 0.2 min.
Precedence Diagram
Assume that the desired output is 480 units per day.
The facility is working 8 hours a day. The elemental
tasks and their connections are shown on the
previous slide.
• Calculate the cycle time.
• Calculate the minimum number of workstations.
• Arrange the tasks to these workstations in the order
of the greatest number of following tasks.
Example 1: Assembly Line Balancing
Workstation
Time
Remaining Eligible
Assign
Task
Revised
Time
Remaining
Station
Idle Time
1 1.0
0.9
0.2
a, c *
c **
none***
a
c
-
0.9
0.2
0.2
2 1.0 b b 0.0 0.0
3 1.0
0.5
0.3
d
e
-
d
e
-
0.5
0.3 0.3
Total: 0.5
Example 1 Solution
* Tasks that have no predecessors.
** b is not eligible, because it needs more time than than the remaining.
*** Every available task needs more time than 0.2.
Efficiency %= 100 x (1 – Percentage of idle time)
Calculate Percent Idle Time and efficiency
Line balancing procedure
• Assign tasks in order of most following
tasks.
– Count the number of tasks that follow
• Assign tasks in order of task time.
• Assign tasks in order of greatest positional
weight.
– Positional weight is the sum of each task’s time
plus the times of all following tasks.
Line Balancing Heuristics
Example 2
Working day is 8 hours and the desired output rate is 400 units per day.
Draw the precedence diagram.
Compute the cycle time & the minimum theoretical number of
workstations required.
Assign tasks to workstations according to the greatest number of
following tasks. Tiebreaker: longest processing time goes first.
Calculate Percent idle time & efficiency.
Solution 2
CT = (8*60)/400= 1.2; Nmin = ∑ti / CT = 3.17 → 4
a b e
c f
d h
g
Work station Tasks assigned Idle time
WS1 a,c,b 0
WS2 d,e 0.3
WS3 f 0.2
WS4 g,h 0.5
Percentage idle time = 1.0 / (4*1.2) = 20.83%
Efficiency = 100 – 20.83 = 79.17%
Other approaches
• Paralell workstations
• Cross-train workers (dynamic line balancing)
• Mixed model line
(more product on the same line)
1 min.
2 min.
1 min.
1 min.
30/hr. 30/hr. 30/hr. 30/hr.
1 min.
1 min.
on average
1 min.
1 min.
60/hr.
30/hr. 30/hr.
60/hr.
30/hr.
30/hr.
Bottleneck
Parallel Workstations
2 min.
2 min.
Thank you for your attention

Process Selection & Facility Layout.ppt

  • 1.
  • 2.
    • Process selection –Deciding on the way production of goods or services will be organized • Major implications – Capacity planning – Layout of facilities – Equipment – Design of work systems Introduction
  • 3.
    Forecasting Product and Service Design Technological Change Capacity Planning Process Selection Facilitiesand Equipment Layout Work Design Process Selection and System Design Inputs Outputs
  • 4.
    Key aspects ofprocess strategy – Capital intensive – equipment/labor – Process flexibility – Adjust to changes – Design – Volume – Technology Process Strategy
  • 5.
    • Variety – Howmuch • Flexibility – What degree • Volume – Expected output Job Shop Batch Repetitive Continuous Process Selection
  • 6.
  • 7.
    • Job shop –Small scale, wide variety of goods • Batch – Moderate volume, flexible • Repetitive or assembly line – High volumes of standardized goods or services • Continuous – Very high volumes of non-discrete goods • Projects – Non-routine work, unique set ob objectives, limited timeframe and resources Process types and volume
  • 8.
    Product – ProcessMatrix The diagonal of the matrix represents the ideal choice of processing system for a given set of circumstances.
  • 9.
    Functions/activities affected byprocess choice Job variety, process flexibility, unit cost Volume Limited (not ongoing)
  • 10.
    Some examples (find theprocess type of each) Movie production Bakery Restaurant (non fast food) University Car repairing (car mechanic shop) Oil mining Producing office tools Veterinarian Project Batch Batch Batch Job shop Continuous Repetitive Job shop
  • 11.
    Product and servicelife cycles • Alongside the life cycle the sales and with it the production volume can change. • Thus managers must be aware of the change in the optimal processing system. (the necessity of change is highly dependent on the particular good or service)
  • 12.
    Example • Computer buildingshop in a garage (working for order only, one computer at a time for given purposes) • The shop hires some workers and producing some dozens of computers for one customer at a time • Computer factory is established, creating large number of computer series • The R&D function of the firm invents a new computer prototype Job shop Batch Repetitive Project
  • 13.
    Product/Service Profiling • Linkingkey product or service requirements to process capabilities. • Design the process with taking into consideration the following: – Range of products/services – Expected order size – Pricing – Expected frequency of changes in schedules etc. – Order-winning requirements – …
  • 14.
    Sustainable production • Non-polluting •Conserving natural resources & energy • Economically efficient • Safe and healthful for workers, communities and consumers • Socially and creaqtively rewarding for workers
  • 15.
    • Automation: Machinerythat has sensing and control devices that enables it to operate – Fixed automation – Programmable automation Automation of production and services
  • 16.
    Advantages of automation •Low variability in performance and quality • Machines do not – get bored or distracted – go out on strike or ask for higher wages – lower variable costs
  • 17.
    Disadvantages • Higher initial(investment) cost and • Higher fixed costs • Lower felxibility • Higher skills needed • Lower morale of human workforce • Need for standardisation – Products – Processes – Equipment and materials etc.
  • 18.
    • Computer-aided designand manufacturing systems (CAD/CAM) • Numerically controlled (NC) machines • Computerized numerical control (CNC) • Direct numerical control (DNC) • Robot: mechanical arm + power supply + controller • Manufacturing cell • Flexible manufacturing systems (FMS) • Computer-integrated manufacturing (CIM) Automation
  • 19.
    • Layout: theconfiguration of departments, work centers, and equipment, with particular emphasis on movement of work (customers or materials) through the system Facilities Layout
  • 20.
    • Requires substantialinvestments of money and effort • Involves long-term commitments • Has significant impact on cost and efficiency of short-term operations Importance of Layout Decisions
  • 21.
    The Need forLayout Decisions • Inefficient operations • High (variable) cost • Bottlenecks • Changes in the design of products or services • The introduction of new products or services • Safety • Changes in environmental or other legal requirements • Changes in volume of output or mix of products • Changes in methods and equipment • Morale problems
  • 22.
    Objectives of facilitylayout Main: smooth flow of work, material and information Supporting objectives:
  • 23.
    • Product layouts •Process layouts • Fixed-Position layout • Combination layouts: – Cellular layout (& group technology) – Flexible manufacturing systems Basic Layout Types
  • 24.
    • Product layout –Layout that uses standardized processing operations to achieve smooth, rapid, high-volume flow • Process layout – Layout that can handle varied processing requirements • Fixed Position layout – Layout in which the product or project remains stationary, and workers, materials, and equipment are moved as needed Basic Layout Types
  • 25.
    Used for Repetitiveor Continuous Processing Product Layout
  • 26.
    • High rateof output • Low unit cost • Labor specialization • Low material handling cost • High utilization of labor and equipment • Established routing and scheduling • Routing accounting and purchasing Advantages of Product Layout
  • 27.
    • Creates dull,repetitive jobs • Poorly skilled workers may not maintain equipment or quality of output • Fairly inflexible to changes in volume • Highly susceptible to shutdowns • Needs preventive maintenance • Individual incentive plans are impractical Disadvantages of Product Layout
  • 28.
  • 29.
    Advantages/disadvantages of U-shaped lines •Shorter distances for workers & machines • Permits communication thus facilitates teamwork • More flexible work assignments • Optimal if the facility has the same entry and exit point • If lines are highly automated, there is no need for communication and travel • If entry points are on the opposite side as exit points • Noise and contamination factors are increased in the U-shape
  • 30.
    Dept. A Dept. BDept. D Dept. C Dept. F Dept. E Used for Intermittent processing Job Shop or Batch Process Layout (functional) Process Layout
  • 31.
    • Can handlea variety of processing requirements • Not particularly vulnerable to equipment failures • Equipment used is less costly • Possible to use individual incentive plans Advantages of Process Layouts
  • 32.
    • In-process inventorycosts can be high • Challenging routing and scheduling • Equipment utilization rates are low • Material handling slow and inefficient • Complexities often reduce span of supervision • Special attention for each product or customer • Accounting and purchasing are more involved Disadvantages of Process Layouts
  • 33.
    Fixed-position layouts • Theproduct or project remains stationary and workers, materials, and equipment are moved as needed. • If weight, size, bulk, or some other factor makes it undesirable or extremely difficult to move the product. • E.g. firefighting, road-building, home-building, drilling for oil etc.
  • 34.
    • Cellular Production –Layout in which machines are grouped into a cell that can process items that have similar processing requirements • Group Technology – The grouping into part families of items with similar design or manufacturing characteristics – Makes cellular production much more effective Cellular Layouts
  • 35.
  • 36.
    Dimension Functional Cellular Numberof moves between departments many few Travel distances longer shorter Travel paths variable fixed Job waiting times greater shorter Throughput time higher lower Amount of work in process higher lower Supervision difficulty higher lower Scheduling complexity higher lower Equipment utilization lower higher Functional vs. Cellular Layouts
  • 37.
    Flexible manufacturing systems •FMS: a group of machnies designed to handle intermittent processing requirements and produce a variety of similar products. • CIM (Computer Integrated Manufacturing): a system of linking a broad range of manufacturing activities through an integrating computer system
  • 38.
    • Warehouse andstorage layouts – Minimizing movement & picking time and cost • Retail layouts – Presence & influence of customers • Office layouts: – Information is computerized, image of openness Service Layouts
  • 39.
    Design Product Layouts:Line Balancing Line Balancing is the process of assigning tasks to workstations in such a way that the workstations have approximately equal time requirements. This way the idle time will be minimized, utilization will be maximized. Specialization: dividing work into elemental tasks that can be performed quickly and routinely.
  • 40.
    Cycle Time Cycle timeis the maximum time allowed at each workstation to complete its set of tasks on a unit. tmax < Cycle time < ∑t
  • 41.
    Determine the MinimumNumber of Workstations Required Theoretical Nmin is not necessarily will be the Nactual. The latter is affected by other technical and practical considerations, too. Nmin ≤ Nactual (rounded up to the next integer)
  • 42.
    A diagram thatshows elemental tasks and their precedence requirements. A simplified precedence diagram a b c d e 0.1 min. 0.7 min. 1.0 min. 0.5 min. 0.2 min. Precedence Diagram
  • 43.
    Assume that thedesired output is 480 units per day. The facility is working 8 hours a day. The elemental tasks and their connections are shown on the previous slide. • Calculate the cycle time. • Calculate the minimum number of workstations. • Arrange the tasks to these workstations in the order of the greatest number of following tasks. Example 1: Assembly Line Balancing
  • 44.
    Workstation Time Remaining Eligible Assign Task Revised Time Remaining Station Idle Time 11.0 0.9 0.2 a, c * c ** none*** a c - 0.9 0.2 0.2 2 1.0 b b 0.0 0.0 3 1.0 0.5 0.3 d e - d e - 0.5 0.3 0.3 Total: 0.5 Example 1 Solution * Tasks that have no predecessors. ** b is not eligible, because it needs more time than than the remaining. *** Every available task needs more time than 0.2.
  • 45.
    Efficiency %= 100x (1 – Percentage of idle time) Calculate Percent Idle Time and efficiency
  • 46.
  • 47.
    • Assign tasksin order of most following tasks. – Count the number of tasks that follow • Assign tasks in order of task time. • Assign tasks in order of greatest positional weight. – Positional weight is the sum of each task’s time plus the times of all following tasks. Line Balancing Heuristics
  • 48.
    Example 2 Working dayis 8 hours and the desired output rate is 400 units per day. Draw the precedence diagram. Compute the cycle time & the minimum theoretical number of workstations required. Assign tasks to workstations according to the greatest number of following tasks. Tiebreaker: longest processing time goes first. Calculate Percent idle time & efficiency.
  • 49.
    Solution 2 CT =(8*60)/400= 1.2; Nmin = ∑ti / CT = 3.17 → 4 a b e c f d h g Work station Tasks assigned Idle time WS1 a,c,b 0 WS2 d,e 0.3 WS3 f 0.2 WS4 g,h 0.5 Percentage idle time = 1.0 / (4*1.2) = 20.83% Efficiency = 100 – 20.83 = 79.17%
  • 50.
    Other approaches • Paralellworkstations • Cross-train workers (dynamic line balancing) • Mixed model line (more product on the same line)
  • 51.
    1 min. 2 min. 1min. 1 min. 30/hr. 30/hr. 30/hr. 30/hr. 1 min. 1 min. on average 1 min. 1 min. 60/hr. 30/hr. 30/hr. 60/hr. 30/hr. 30/hr. Bottleneck Parallel Workstations Parallel Workstations 2 min. 2 min.
  • 52.
    Thank you foryour attention