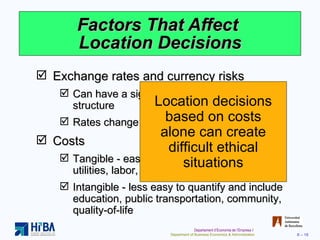
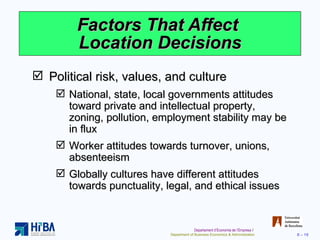
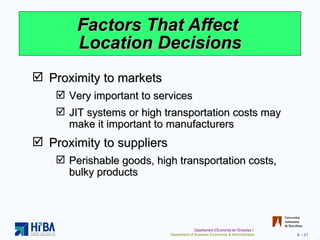
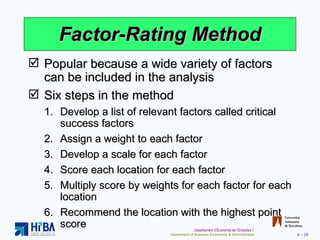
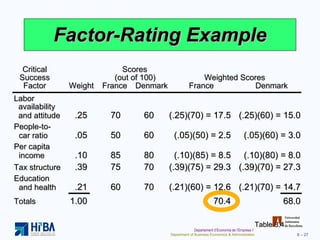
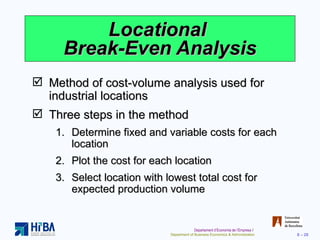
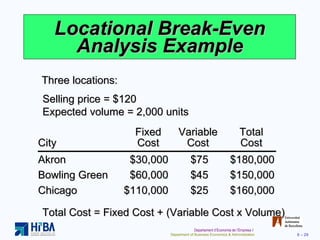
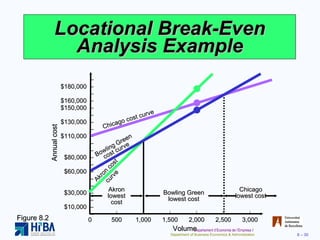
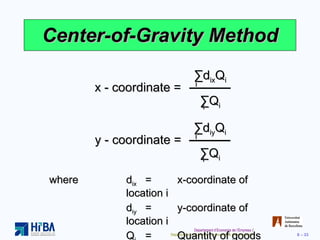
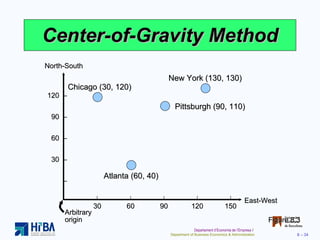
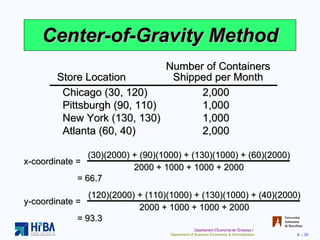
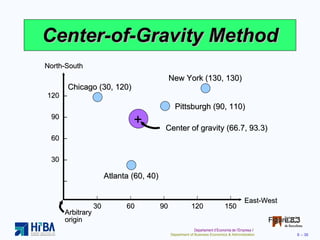
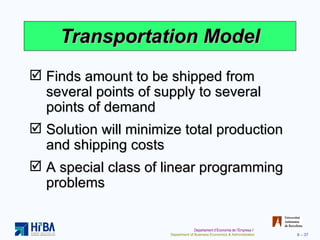
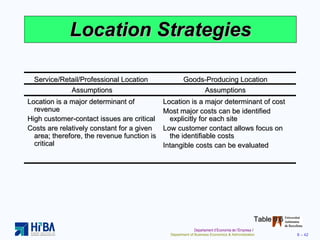
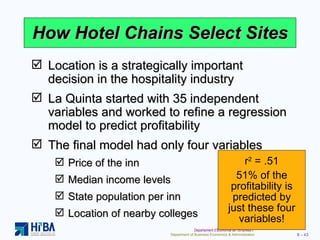
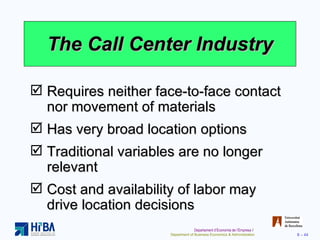
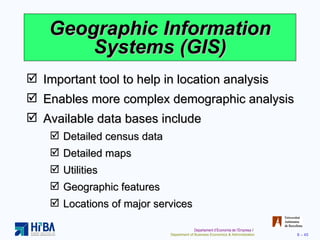
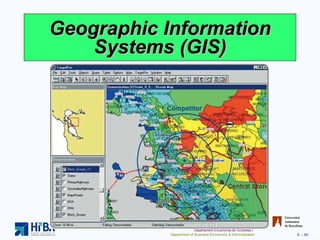
The document discusses various location strategy considerations for operations management. It covers factors that affect location decisions such as labor productivity, exchange rates, political risks, and proximity to markets/suppliers. Methods for evaluating location alternatives are described, including the factor-rating method, locational break-even analysis, and center-of-gravity method. Specific location strategies for different industries like hotels, call centers, and how companies use geographic information systems are also summarized.
Palestine last event orientationfvgnh .pptxRaedMohamed3
An EFL lesson about the current events in Palestine. It is intended to be for intermediate students who wish to increase their listening skills through a short lesson in power point.
Operation “Blue Star” is the only event in the history of Independent India where the state went into war with its own people. Even after about 40 years it is not clear if it was culmination of states anger over people of the region, a political game of power or start of dictatorial chapter in the democratic setup.
The people of Punjab felt alienated from main stream due to denial of their just demands during a long democratic struggle since independence. As it happen all over the word, it led to militant struggle with great loss of lives of military, police and civilian personnel. Killing of Indira Gandhi and massacre of innocent Sikhs in Delhi and other India cities was also associated with this movement.
The Art Pastor's Guide to Sabbath | Steve ThomasonSteve Thomason
What is the purpose of the Sabbath Law in the Torah. It is interesting to compare how the context of the law shifts from Exodus to Deuteronomy. Who gets to rest, and why?
Read| The latest issue of The Challenger is here! We are thrilled to announce that our school paper has qualified for the NATIONAL SCHOOLS PRESS CONFERENCE (NSPC) 2024. Thank you for your unwavering support and trust. Dive into the stories that made us stand out!
How to Make a Field invisible in Odoo 17Celine George
It is possible to hide or invisible some fields in odoo. Commonly using “invisible” attribute in the field definition to invisible the fields. This slide will show how to make a field invisible in odoo 17.
This is a presentation by Dada Robert in a Your Skill Boost masterclass organised by the Excellence Foundation for South Sudan (EFSS) on Saturday, the 25th and Sunday, the 26th of May 2024.
He discussed the concept of quality improvement, emphasizing its applicability to various aspects of life, including personal, project, and program improvements. He defined quality as doing the right thing at the right time in the right way to achieve the best possible results and discussed the concept of the "gap" between what we know and what we do, and how this gap represents the areas we need to improve. He explained the scientific approach to quality improvement, which involves systematic performance analysis, testing and learning, and implementing change ideas. He also highlighted the importance of client focus and a team approach to quality improvement.
Instructions for Submissions thorugh G- Classroom.pptxJheel Barad
This presentation provides a briefing on how to upload submissions and documents in Google Classroom. It was prepared as part of an orientation for new Sainik School in-service teacher trainees. As a training officer, my goal is to ensure that you are comfortable and proficient with this essential tool for managing assignments and fostering student engagement.
The French Revolution, which began in 1789, was a period of radical social and political upheaval in France. It marked the decline of absolute monarchies, the rise of secular and democratic republics, and the eventual rise of Napoleon Bonaparte. This revolutionary period is crucial in understanding the transition from feudalism to modernity in Europe.
For more information, visit-www.vavaclasses.com
15. Growth Competitiveness Index of Countries Table 8.1 Country 2006-2007 Rank 2005 Rank Switzerland 1 4 USA 6 1 Japan 7 10 Germany 8 6 UK 10 9 Israel 15 23 Canada 16 13 New Zealand 23 22 Italy 42 38 China 54 48 Mexico 58 59 Russia 62 53
16.
17.
18.
19.
20. Ranking Corruption Rank Country 2006 CPI Score (out of 10) 1 Finland 9.6 1 Iceland 9.6 1 New Zealand 9.6 5 Singapore 9.4 7 Switzerland 9.1 11 UK 8.6 14 Canada 8.5 15 Hong Kong 8.3 16 Germany 8.0 17 Japan 7.6 20 USA, Belgium 7.3 34 Israel, Taiwan 5.9 70 Brazil, China, Mexico 3.3 121 Russia 2.5 Table 8.2 Least Corrupt Most Corrupt
21.
22.
23. Clustering of Companies Table 8.3 Industry Locations Reason for clustering Wine making Napa Valley (US) Bordeaux region (France) Natural resources of land and climate Software firms Silicon Valley, Boston, Bangalore (India) Talent resources of bright graduates in scientific/technical areas, venture capitalists nearby Race car builders Huntington/North Hampton region (England) Critical mass of talent and information
24. Clustering of Companies Table 8.3 Industry Locations Reason for clustering Theme parks (Disney World, Universal Studios) Orlando, Florida A hot spot for entertainment, warm weather, tourists, and inexpensive labor Electronics firms Northern Mexico NAFTA, duty free export to US Computer hardware manufacturers Singapore, Taiwan High technological penetration rate and per capita GDP, skilled/educated workforce with large pool of engineers
25. Clustering of Companies Table 8.3 Industry Locations Reason for clustering Fast food chains (Wendy’s, McDonald’s, Burger King, and Pizza Hut) Sites within 1 mile of each other Stimulate food sales, high traffic flows General aviation aircraft (Cessna, Learjet, Boeing) Wichita, Kansas Mass of aviation skills Orthopedic devices Warsaw, Indiana Ready supply of skilled workers, strong U.S. market
26.
27. Factor-Rating Example Table 8.4 Critical Scores Success (out of 100) Weighted Scores Factor Weight France Denmark France Denmark Labor availability and attitude .25 70 60 (.25)(70) = 17.5 (.25)(60) = 15.0 People-to- car ratio .05 50 60 (.05)(50) = 2.5 (.05)(60) = 3.0 Per capita income .10 85 80 (.10)(85) = 8.5 (.10)(80) = 8.0 Tax structure .39 75 70 (.39)(75) = 29.3 (.39)(70) = 27.3 Education and health .21 60 70 (.21)(60) = 12.6 (.21)(70) = 14.7 Totals 1.00 70.4 68.0
28.
29. Locational Break-Even Analysis Example Three locations: Total Cost = Fixed Cost + (Variable Cost x Volume) Selling price = $120 Expected volume = 2,000 units Akron $30,000 $75 $180,000 Bowling Green $60,000 $45 $150,000 Chicago $110,000 $25 $160,000 Fixed Variable Total City Cost Cost Cost
33. Center-of-Gravity Method where d ix = x-coordinate of location i d iy = y-coordinate of location i Q i = Quantity of goods moved to or from location i x - coordinate = ∑ d ix Q i ∑ Q i i i ∑ d iy Q i ∑ Q i i i y - coordinate =
40. Location Strategies Table 8.6 Service/Retail/Professional Location Goods-Producing Location Revenue Focus Cost Focus Volume/revenue Drawing area; purchasing power Competition; advertising/pricing Physical quality Parking/access; security/lighting; appearance/image Cost determinants Rent Management caliber Operations policies (hours, wage rates) Tangible costs Transportation cost of raw material Shipment cost of finished goods Energy and utility cost; labor; raw material; taxes, and so on Intangible and future costs Attitude toward union Quality of life Education expenditures by state Quality of state and local government
41. Location Strategies Table 8.6 Service/Retail/Professional Location Goods-Producing Location Techniques Techniques Regression models to determine importance of various factors Factor-rating method Traffic counts Demographic analysis of drawing area Purchasing power analysis of area Center-of-gravity method Geographic information systems Transportation method Factor-rating method Locational break-even analysis Crossover charts
42. Location Strategies Table 8.6 Service/Retail/Professional Location Goods-Producing Location Assumptions Assumptions Location is a major determinant of revenue High customer-contact issues are critical Costs are relatively constant for a given area; therefore, the revenue function is critical Location is a major determinant of cost Most major costs can be identified explicitly for each site Low customer contact allows focus on the identifiable costs Intangible costs can be evaluated
CPI is the Corrupt Perceptions Index calculated by Transparency International, an organization dedicated to fighting business corruption. The Index is calculated from up to 13 different individual scores. For details and the methodology, see www.transparency.org. In case students are interested, the country with the lowest score in the 2006 survey was Haiti with a score of 1.8 out of 10.