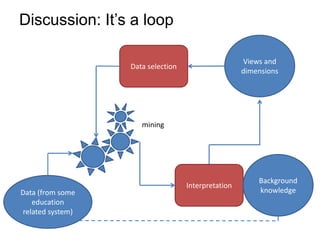
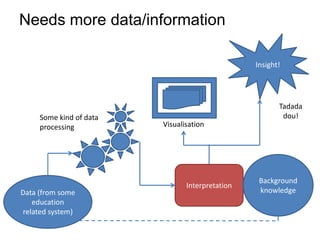
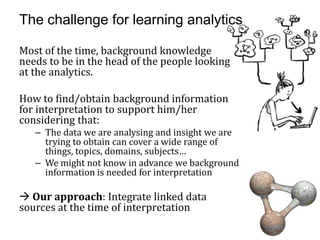
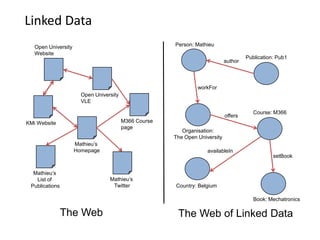
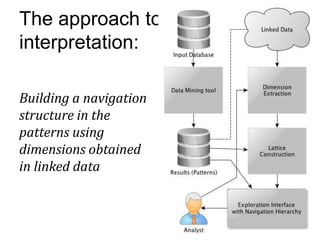
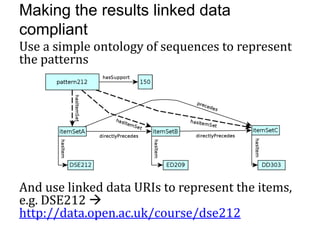
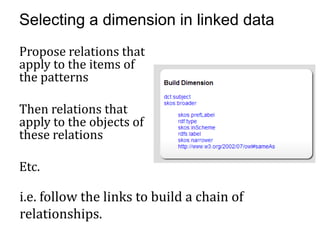
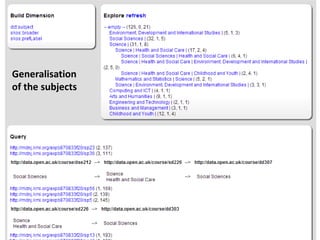
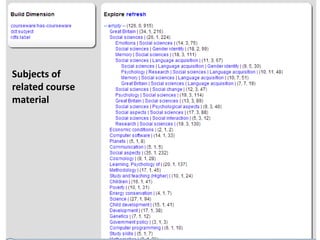
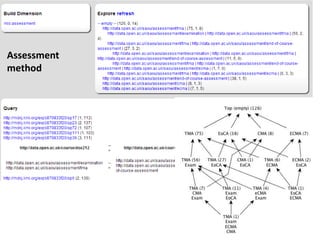
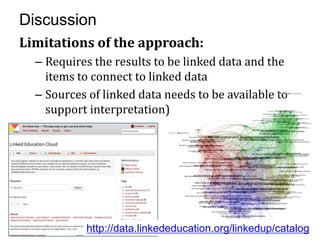
Interpreting Data Mining Results with Linked Data for Learning Analytics:Motivation, Case Study and Directions
Presentation at the LAK 2013 conference - 10-04-2013
Linking Universities - A broader look at the application of linked data and s...Mathieu d'Aquin
Presentation at the VIVO - International Research Network about Linked Universities, data.open.ac.uk, linkedup, linked data for universities, education and research.
Linking Universities - A broader look at the application of linked data and s...Mathieu d'Aquin
Presentation at the VIVO - International Research Network about Linked Universities, data.open.ac.uk, linkedup, linked data for universities, education and research.
Linked Data for Federation of OER Data & RepositoriesStefan Dietze
An overview over different alternatives and opportunities of using Linked Data principles and datasets for federated access to distributed OER repositories. The talk was held at the ARIADNE/GLOBE convening (http://ariadne-eu.org/content/open-federations-2013-open-knowledge-sharing-education) at LAK 2013, Leuven, Belgium on 8 April 2013
This slideset introduces the LAK Dataset and Challenge, held at the Learning Analytics & Knowledge (LAK) conference in Leuven, Belgium, April 2013. Further information about the dataset and submissions is available at http://ceur-ws.org/Vol-974/ as well as http://www.solaresearch.org/events/lak/lak-data-challenge/.
Mining and Understanding Activities and Resources on the WebStefan Dietze
Research Seminar at KMRC Tübingen, Germany, on mining and understanding of Web acivities and resources through knowledge discovery and machine learning approaches.
Two web analytics case studies presented to the Cincinnati Marketing Association B2B group. One case study looked at a retail/e-commerce site, defined the objective, identified the KPI\'s used in the methodology and showed results.
The other case study looked at a lead generation site where the objective was to decrease aquisition costs. Methodolgy used a conversion funnel.
Move from Business Intelligence to Advanced Analytics by Integrating IBM SPSS...Perficient, Inc.
Standard business intelligence reports and dashboards are effective tools to describe the state of your organization or department. However, there are many questions that these tools cannot address, such as:
Why is this happening?
How will my organization be impacted if these trends continue?
What will happen next?
How can we change the outcome of this situation?
Advanced analytics tools are necessary to accurately and quickly address these questions through statistical analysis, forecasting, predictive modeling and intelligent optimization. By integrating advanced analytics solutions with existing business intelligence platforms, your organization will be better positioned to extract actionable insight from your data to gain a true competitive advantage.
Learn how your organization can extend its business intelligence investments in IBM Cognos TM1 by integrating with IBM's leading advanced analytics platform, SPSS. We'll discuss the capabilities of TM1 and SPSS, integration methodologies and strategies, and demo an integrated analytics environment.
Identifying Safety Signals by Data Mining the FDA Adverse Event Reporting Sys...Perficient, Inc.
Ever since the European Union (EU) introduced new legislation that requires life sciences companies to proactively detect, prioritize, and evaluate safety signals, there has been an increased interest, not only from sponsors and CROs in the EU, but globally, in pharmacovigilance systems that can assist with the signal management process.
Perficient's Chris Wocosky, an expert in signal detection and management, shows how your organization can use Empirica Signal, Oracle's state-of-the-art signal detection system to data mine the existing FDA Adverse Event Reporting System (FAERS) to determine safety signals. This presentation and demonstration willhelp you bettter understand how this solution can be used in daily pharmacovigilance activities.
Application of Clustering in Data Science using Real-life Examples Edureka!
Clustering data into subsets is an important task for many data science applications. It is considered as one of the most important unsupervised learning technique. Keeping this in mind, we have come with a free webinar ‘Application of Cluster in Data Science using Real-life examples.’
In any single written message, one can count letters, words or sentences. One can categories phrases, describe the logical structure of expressions, ascertain associations, connotations, denotations, elocutionary forces, and one can also offer psychiatric, sociological, or political interpretations. All of these may be simultaneously valid. In short a message may convey a multitude of contents even to a single receiver.
Introductory presentation given at Future Learning Landscape Workshop held at EC-TEL 2009. Presents some introductory elements about the state of research in pervasive learning, Web 2.0/Social Software and Semantic Web/Linked Data before discussing convergence
Semantic Linking & Retrieval for Digital LibrariesStefan Dietze
An overview of recent works on entitiy linking and retrieval in large corpora, specifically bibliographic data. The works address both traditional Linked Data and knowledge graphs as well as data extracted from Web markup, such as the Web Data Commons.
Semantic Technologies in Learning EnvironmentsDragan Gasevic
Presentation give at the pre-conference workshop of the 1st International Conference on Learning Analytics and Knowledge, https://tekri.athabascau.ca/analytics/
Semantic Technologies in Learning AnalyticsDragan Gasevic
My presentation at the pre-conference workshop of the 1st International Conference on Learning Analytics and Knoweldge
https://tekri.athabascau.ca/analytics/
Bringing Teachers, Students and Learning Resources Contextually Closerfzablith
Traditionally, classrooms have been the major channels of interaction between teachers and students. With the advancements in internet, social media and mobile technologies, learning environments are becoming more enriched with sophisticated interaction and a wealth of online learning material. While this offers a range of improvements, it is posing a set of challenges for educators to accommodate such changes to the benefit of their students. One particular problem is that current teachers are not well equipped with tools to guide students towards the discovery of learning material relevant to the context of their course. For example while it is easy in a classroom to discuss how a video connects to a topic or learning activity within a course, it is much harder to infer such cognitive connections in an online environment. We believe that one of the major bottlenecks is the lack of explicit context alignment between teachers, students and learning resources. We propose using semantic technologies to elicit the contexts in learning environments, and provide the means for teachers to better orchestrate the delivery of their learning concepts in classrooms. We discuss in this seminar a plan to build semantic graphs (i.e. knowledge graphs or maps) to connect existing courses, learning material and other entities involved in leaning environments. This work contributes to enhancing personalized learning, and empowering educators to have better control over learning resources to support their teaching duties.
'Using Linked Data in Learning Analytics' is a tutorial targeting researchers in Learning Analytics interested in exploiting linked data resources, developers of Learning Analytics solutions that could benefit from Linked Data and data owners wanting to understand how linked data can help the analysis of their data in relation to other sources of information. The tutorial is described in more details at http://linkedu.eu/event/lak2013-linkeddata-tutorial/, where learning material related to the topic of the tutorial will also be disseminated.
http://portal.ou.nl/documents/363049/033208ab-9dba-43be-b1d8-80d6423c0654
http://creativecommons.org/licenses/by-nc-sa/3.0/
d'Aquin, M., Dietze, S., Herder, E., Drachsler, H. (Eds.) (2013). Tutorial: Using Linked Data in Learning Analytics. Tutorial given at LAK 2013, the Third Conference on Learning Analytics and Knowledge. Leuven, Belgium.
LUCERO - Building the Open University's Web of Linked DataMathieu d'Aquin
Seminar given at KMi, the Open University about the LUCERO project (http://lucero-project.info) and the process of building http://data.open.ac.uk.
Video available at
http://stadium.open.ac.uk/1570
Overview of C-SAP open educational resources projectCSAPOER
This presentation showcases, discusses and reflects upon the work of the C-SAP "Open Educational Resources" project. Our project, "Evaluating the Practice of Opening up Resources for Learning and Teaching in the Social Sciences", was part of a pilot programme (funded by the HEA and JISC), which sought to explore issues around the sharing of educational material from a disciplinary perspective. Whilst exploring, with our academic project partners, the principles and issues around releasing educational material (institutional, contractual, administrative), we have also sought to develop some insights into the processes of sharing practice, and look forward to discussing the findings in this forum.
Connector Corner: Automate dynamic content and events by pushing a buttonDianaGray10
Here is something new! In our next Connector Corner webinar, we will demonstrate how you can use a single workflow to:
Create a campaign using Mailchimp with merge tags/fields
Send an interactive Slack channel message (using buttons)
Have the message received by managers and peers along with a test email for review
But there’s more:
In a second workflow supporting the same use case, you’ll see:
Your campaign sent to target colleagues for approval
If the “Approve” button is clicked, a Jira/Zendesk ticket is created for the marketing design team
But—if the “Reject” button is pushed, colleagues will be alerted via Slack message
Join us to learn more about this new, human-in-the-loop capability, brought to you by Integration Service connectors.
And...
Speakers:
Akshay Agnihotri, Product Manager
Charlie Greenberg, Host
Dev Dives: Train smarter, not harder – active learning and UiPath LLMs for do...UiPathCommunity
💥 Speed, accuracy, and scaling – discover the superpowers of GenAI in action with UiPath Document Understanding and Communications Mining™:
See how to accelerate model training and optimize model performance with active learning
Learn about the latest enhancements to out-of-the-box document processing – with little to no training required
Get an exclusive demo of the new family of UiPath LLMs – GenAI models specialized for processing different types of documents and messages
This is a hands-on session specifically designed for automation developers and AI enthusiasts seeking to enhance their knowledge in leveraging the latest intelligent document processing capabilities offered by UiPath.
Speakers:
👨🏫 Andras Palfi, Senior Product Manager, UiPath
👩🏫 Lenka Dulovicova, Product Program Manager, UiPath
State of ICS and IoT Cyber Threat Landscape Report 2024 previewPrayukth K V
The IoT and OT threat landscape report has been prepared by the Threat Research Team at Sectrio using data from Sectrio, cyber threat intelligence farming facilities spread across over 85 cities around the world. In addition, Sectrio also runs AI-based advanced threat and payload engagement facilities that serve as sinks to attract and engage sophisticated threat actors, and newer malware including new variants and latent threats that are at an earlier stage of development.
The latest edition of the OT/ICS and IoT security Threat Landscape Report 2024 also covers:
State of global ICS asset and network exposure
Sectoral targets and attacks as well as the cost of ransom
Global APT activity, AI usage, actor and tactic profiles, and implications
Rise in volumes of AI-powered cyberattacks
Major cyber events in 2024
Malware and malicious payload trends
Cyberattack types and targets
Vulnerability exploit attempts on CVEs
Attacks on counties – USA
Expansion of bot farms – how, where, and why
In-depth analysis of the cyber threat landscape across North America, South America, Europe, APAC, and the Middle East
Why are attacks on smart factories rising?
Cyber risk predictions
Axis of attacks – Europe
Systemic attacks in the Middle East
Download the full report from here:
https://sectrio.com/resources/ot-threat-landscape-reports/sectrio-releases-ot-ics-and-iot-security-threat-landscape-report-2024/
UiPath Test Automation using UiPath Test Suite series, part 4DianaGray10
Welcome to UiPath Test Automation using UiPath Test Suite series part 4. In this session, we will cover Test Manager overview along with SAP heatmap.
The UiPath Test Manager overview with SAP heatmap webinar offers a concise yet comprehensive exploration of the role of a Test Manager within SAP environments, coupled with the utilization of heatmaps for effective testing strategies.
Participants will gain insights into the responsibilities, challenges, and best practices associated with test management in SAP projects. Additionally, the webinar delves into the significance of heatmaps as a visual aid for identifying testing priorities, areas of risk, and resource allocation within SAP landscapes. Through this session, attendees can expect to enhance their understanding of test management principles while learning practical approaches to optimize testing processes in SAP environments using heatmap visualization techniques
What will you get from this session?
1. Insights into SAP testing best practices
2. Heatmap utilization for testing
3. Optimization of testing processes
4. Demo
Topics covered:
Execution from the test manager
Orchestrator execution result
Defect reporting
SAP heatmap example with demo
Speaker:
Deepak Rai, Automation Practice Lead, Boundaryless Group and UiPath MVP
Builder.ai Founder Sachin Dev Duggal's Strategic Approach to Create an Innova...Ramesh Iyer
In today's fast-changing business world, Companies that adapt and embrace new ideas often need help to keep up with the competition. However, fostering a culture of innovation takes much work. It takes vision, leadership and willingness to take risks in the right proportion. Sachin Dev Duggal, co-founder of Builder.ai, has perfected the art of this balance, creating a company culture where creativity and growth are nurtured at each stage.
Epistemic Interaction - tuning interfaces to provide information for AI supportAlan Dix
Paper presented at SYNERGY workshop at AVI 2024, Genoa, Italy. 3rd June 2024
https://alandix.com/academic/papers/synergy2024-epistemic/
As machine learning integrates deeper into human-computer interactions, the concept of epistemic interaction emerges, aiming to refine these interactions to enhance system adaptability. This approach encourages minor, intentional adjustments in user behaviour to enrich the data available for system learning. This paper introduces epistemic interaction within the context of human-system communication, illustrating how deliberate interaction design can improve system understanding and adaptation. Through concrete examples, we demonstrate the potential of epistemic interaction to significantly advance human-computer interaction by leveraging intuitive human communication strategies to inform system design and functionality, offering a novel pathway for enriching user-system engagements.
Essentials of Automations: Optimizing FME Workflows with ParametersSafe Software
Are you looking to streamline your workflows and boost your projects’ efficiency? Do you find yourself searching for ways to add flexibility and control over your FME workflows? If so, you’re in the right place.
Join us for an insightful dive into the world of FME parameters, a critical element in optimizing workflow efficiency. This webinar marks the beginning of our three-part “Essentials of Automation” series. This first webinar is designed to equip you with the knowledge and skills to utilize parameters effectively: enhancing the flexibility, maintainability, and user control of your FME projects.
Here’s what you’ll gain:
- Essentials of FME Parameters: Understand the pivotal role of parameters, including Reader/Writer, Transformer, User, and FME Flow categories. Discover how they are the key to unlocking automation and optimization within your workflows.
- Practical Applications in FME Form: Delve into key user parameter types including choice, connections, and file URLs. Allow users to control how a workflow runs, making your workflows more reusable. Learn to import values and deliver the best user experience for your workflows while enhancing accuracy.
- Optimization Strategies in FME Flow: Explore the creation and strategic deployment of parameters in FME Flow, including the use of deployment and geometry parameters, to maximize workflow efficiency.
- Pro Tips for Success: Gain insights on parameterizing connections and leveraging new features like Conditional Visibility for clarity and simplicity.
We’ll wrap up with a glimpse into future webinars, followed by a Q&A session to address your specific questions surrounding this topic.
Don’t miss this opportunity to elevate your FME expertise and drive your projects to new heights of efficiency.
Kubernetes & AI - Beauty and the Beast !?! @KCD Istanbul 2024Tobias Schneck
As AI technology is pushing into IT I was wondering myself, as an “infrastructure container kubernetes guy”, how get this fancy AI technology get managed from an infrastructure operational view? Is it possible to apply our lovely cloud native principals as well? What benefit’s both technologies could bring to each other?
Let me take this questions and provide you a short journey through existing deployment models and use cases for AI software. On practical examples, we discuss what cloud/on-premise strategy we may need for applying it to our own infrastructure to get it to work from an enterprise perspective. I want to give an overview about infrastructure requirements and technologies, what could be beneficial or limiting your AI use cases in an enterprise environment. An interactive Demo will give you some insides, what approaches I got already working for real.
GraphRAG is All You need? LLM & Knowledge GraphGuy Korland
Guy Korland, CEO and Co-founder of FalkorDB, will review two articles on the integration of language models with knowledge graphs.
1. Unifying Large Language Models and Knowledge Graphs: A Roadmap.
https://arxiv.org/abs/2306.08302
2. Microsoft Research's GraphRAG paper and a review paper on various uses of knowledge graphs:
https://www.microsoft.com/en-us/research/blog/graphrag-unlocking-llm-discovery-on-narrative-private-data/
Neuro-symbolic is not enough, we need neuro-*semantic*Frank van Harmelen
Neuro-symbolic (NeSy) AI is on the rise. However, simply machine learning on just any symbolic structure is not sufficient to really harvest the gains of NeSy. These will only be gained when the symbolic structures have an actual semantics. I give an operational definition of semantics as “predictable inference”.
All of this illustrated with link prediction over knowledge graphs, but the argument is general.
Let's dive deeper into the world of ODC! Ricardo Alves (OutSystems) will join us to tell all about the new Data Fabric. After that, Sezen de Bruijn (OutSystems) will get into the details on how to best design a sturdy architecture within ODC.
UiPath Test Automation using UiPath Test Suite series, part 3DianaGray10
Welcome to UiPath Test Automation using UiPath Test Suite series part 3. In this session, we will cover desktop automation along with UI automation.
Topics covered:
UI automation Introduction,
UI automation Sample
Desktop automation flow
Pradeep Chinnala, Senior Consultant Automation Developer @WonderBotz and UiPath MVP
Deepak Rai, Automation Practice Lead, Boundaryless Group and UiPath MVP
UiPath Test Automation using UiPath Test Suite series, part 3
Interpreting Data Mining Results with Linked Data for Learning Analytics
1. Interpreting Data Mining Results with
Linked Data for Learning Analytics:
Motivation, Case Study and Directions
Mathieu d’Aquin
Knowledge Media Institute, The Open University
mdaquin.net - @mdaquin
mathieu.daquin@open.ac.uk
Nicolas Jay
Université de Lorraine, LORIA,
nicolas.jay@loria.fr
2. My super naïve view of learning
analytics
Insight!
Tada!
Some kind of data
processing Visualisation
Data (from some
education
related system)
3. But actually…
Insight!
Tadada!
Some kind of data
processing Visualisation
Interpretation
Data (from some
education
related system)
4. Needs more data/information
Insight!
Tadada
Some kind of data dou!
processing Visualisation
Background
Interpretation
Data (from some knowledge
education
related system)
5. The challenge for learning analytics
Most of the time, background knowledge
needs to be in the head of the people looking
at the analytics.
How to find/obtain background information
for interpretation to support him/her
considering that:
– The data we are analysing and insight we are
trying to obtain can cover a wide range of
things, topics, domains, subjects…
– We might not know in advance we background
information is needed for interpretation
Our approach: Integrate linked data
sources at the time of interpretation
6. What’s linked data
See the “Using Linked Data in Learning
Analytics” tutorial yesterday
http://linkedu.eu/event/lak2013-linkeddata-
tutorial/
7. Linked Data
Open University Person: Mathieu
Website
Publication: Pub1
author
workFor
Open University
VLE
Course: M366
offers
KMi Website M366 Course
page
Organisation:
The Open University
Mathieu’s
Homepage availableIn
setBook
Mathieu’s
List of Mathieu’s
Publications Twitter Country: Belgium
Book: Mechatronics
The Web The Web of Linked Data
8. rNews
Music
Ontology Geo
Ontology
SIOC Media
Ontology
Dublin
Core
DBPedia
FOAF
Ontology
DOAP
FMA BIBO
Ontology
LODE
Gene
Ontology
10. Use case: student enrolment data
From the
Open
University’s
Course Profile
Facebook
Application:
Examples:
Who enrolled
to what
Student ID Course Code Status Date
112 dse212 Studying 2007
course at 112 d315 Intend to study 2008
what time 109 a207 Completed 2005
11. Sequence mining
We can represent each student’s trajectory by a
sequence of courses, e.g.
(DD100) (D203, S180) (S283)
Applying sequence mining makes it possible to
find frequent patterns in these sequences, i.e.,
courses often taken together in a certain order.
12. The results
(and again, why they need background knowledge for
interpretation)
Out of 8,806 sequences (students), we obtained
126 different sequential patterns with a support
threshold of 100*
i.e. filtering out patterns included in less than 100 sequences.
Sequential pattern Support
(DD100) (DSE212) 232
Examples: (DSE212) (ED209) (DD303) 150
(B120) (B201) 122
How to know what that means?
We need background information about the
courses (DD100, DSE212, ED209 ,etc.)
14. Making the results linked data
compliant
Use a simple ontology of sequences to represent
the patterns
And use linked data URIs to represent the items,
e.g. DSE212
http://data.open.ac.uk/course/dse212
15.
16. Selecting a dimension in linked data
Propose relations that
apply to the items of
the patterns
Then relations that
apply to the objects of
these relations
Etc.
i.e. follow the links to build a chain of
relationships.
17. Building a hierarchy of patterns
The end-values of the
chain of relations built
out of following links
of linked data form
attributes of the
patterns
Build a lattice
(hierarchy) of
concepts representing
groupings of these
attributes, using
formal concept
analysis
20. Benefits
(see following examples)
Provides an overview of the patterns
obtained along a custom dimension
Helps identifying gaps and issues in
the original data/process
Helps identifying areas in need of
further exploration
Generic: can be straightforwardly
applied to other source data, other
linked data and other mining methods
24. Discussion
Limitations of the approach:
– Requires the results to be linked data and the
items to connect to linked data
– Sources of linked data needs to be available to
support interpretation)
http://data.linkededucation.org/linkedup/catalog
25. Discussion: It’s a loop
Views and
Data selection
dimensions
mining
Background
Interpretation
Data (from some knowledge
education
related system)
26. Conclusion
Linked data can be used to enrich and
bring some meaningful structure to
the patterns from an analytics/mining
process
Introducing linked data not only in
input of the process, but also in
support of more analytical tasks
Promising, considering the growth of
education-related linked data
Should become part of an iterative
process, where patterns and data get
refined through interpretation and the
introduction of background
information from linked data
27. Thank you!
More info at:
http://mdaquin.net @mdaquin
http://linkedup-project.eu
http://linkedup-challenge.org
http://linkedu.eu/event/lak2013-linkeddata-
tutorial/