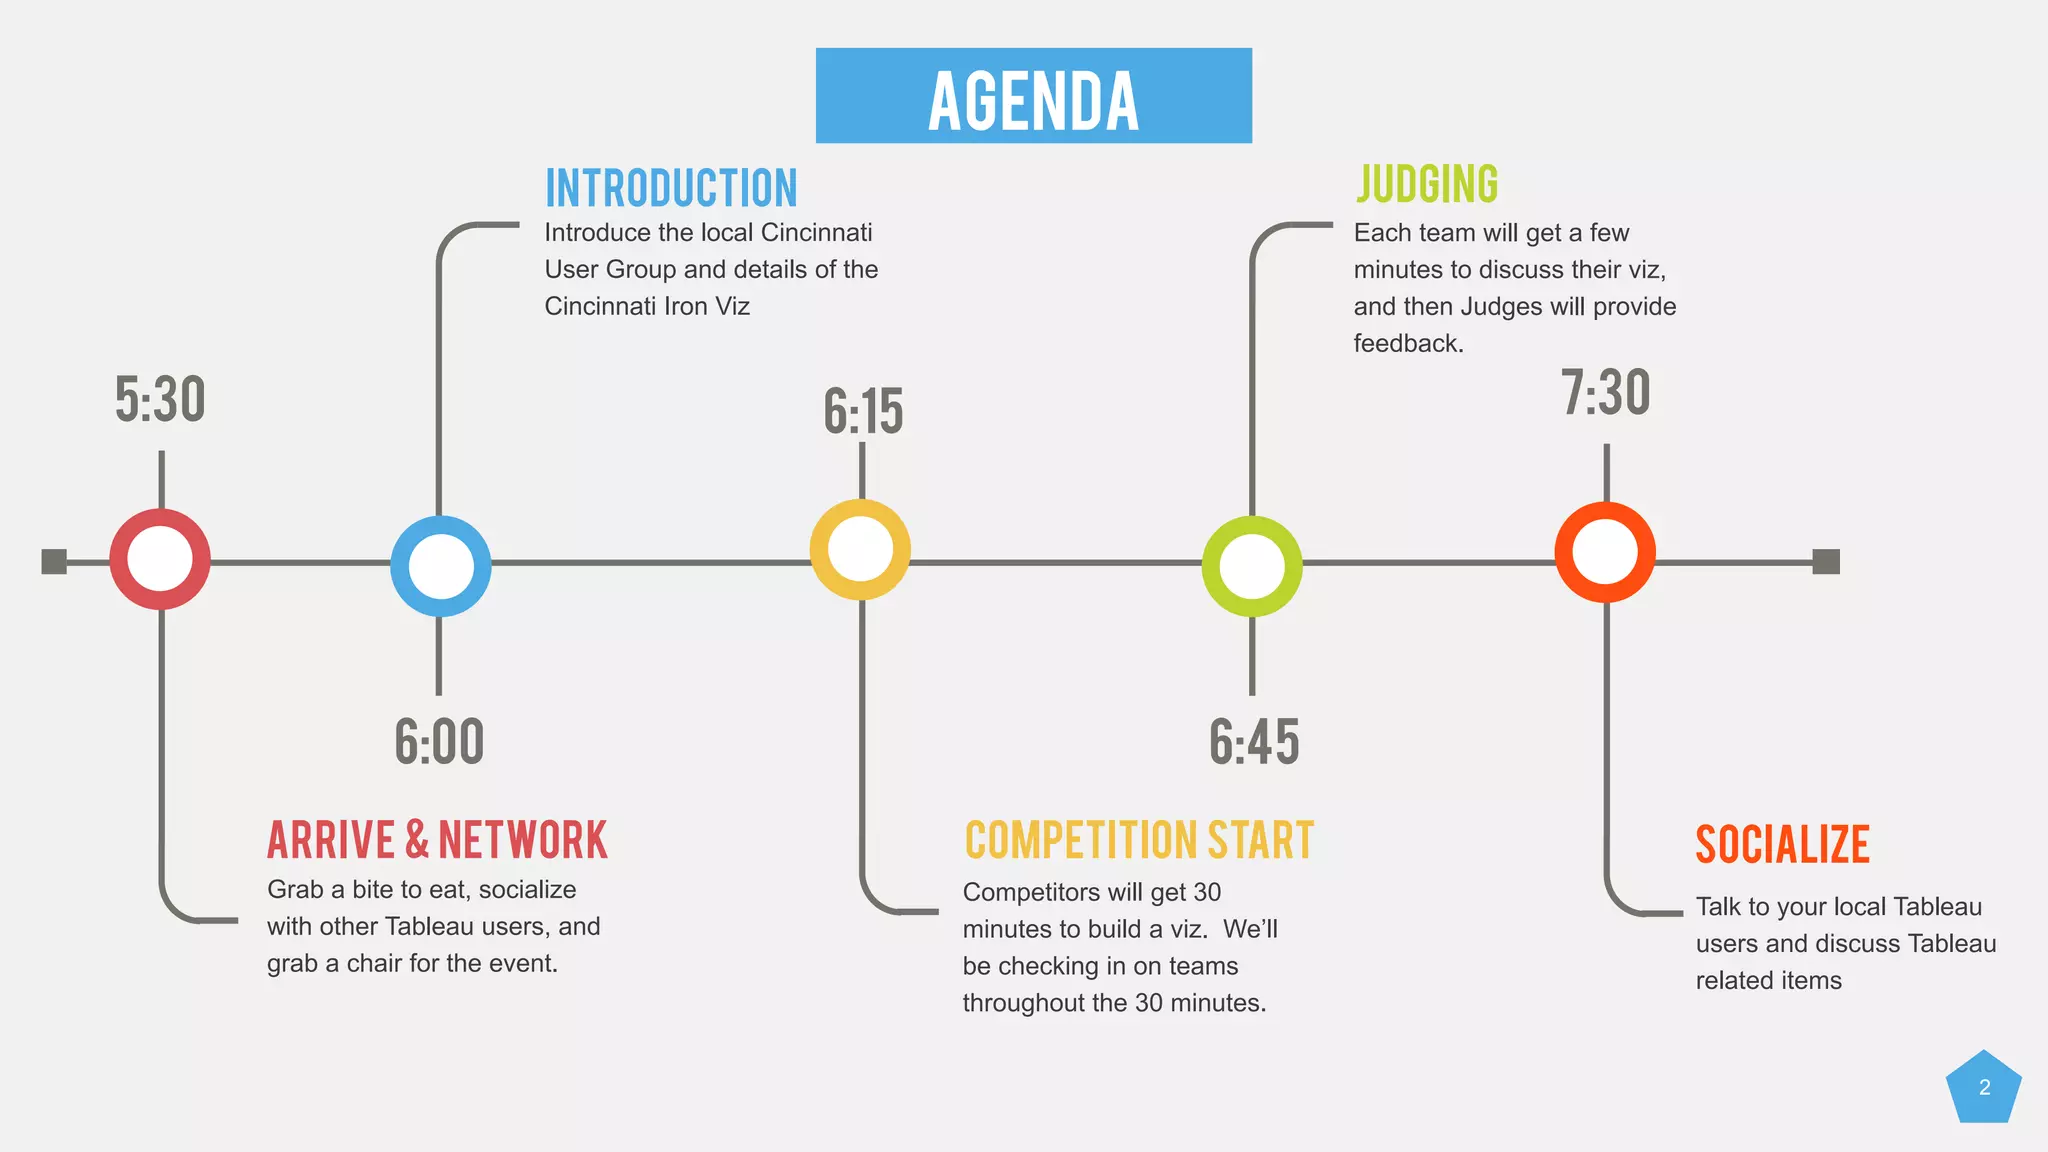
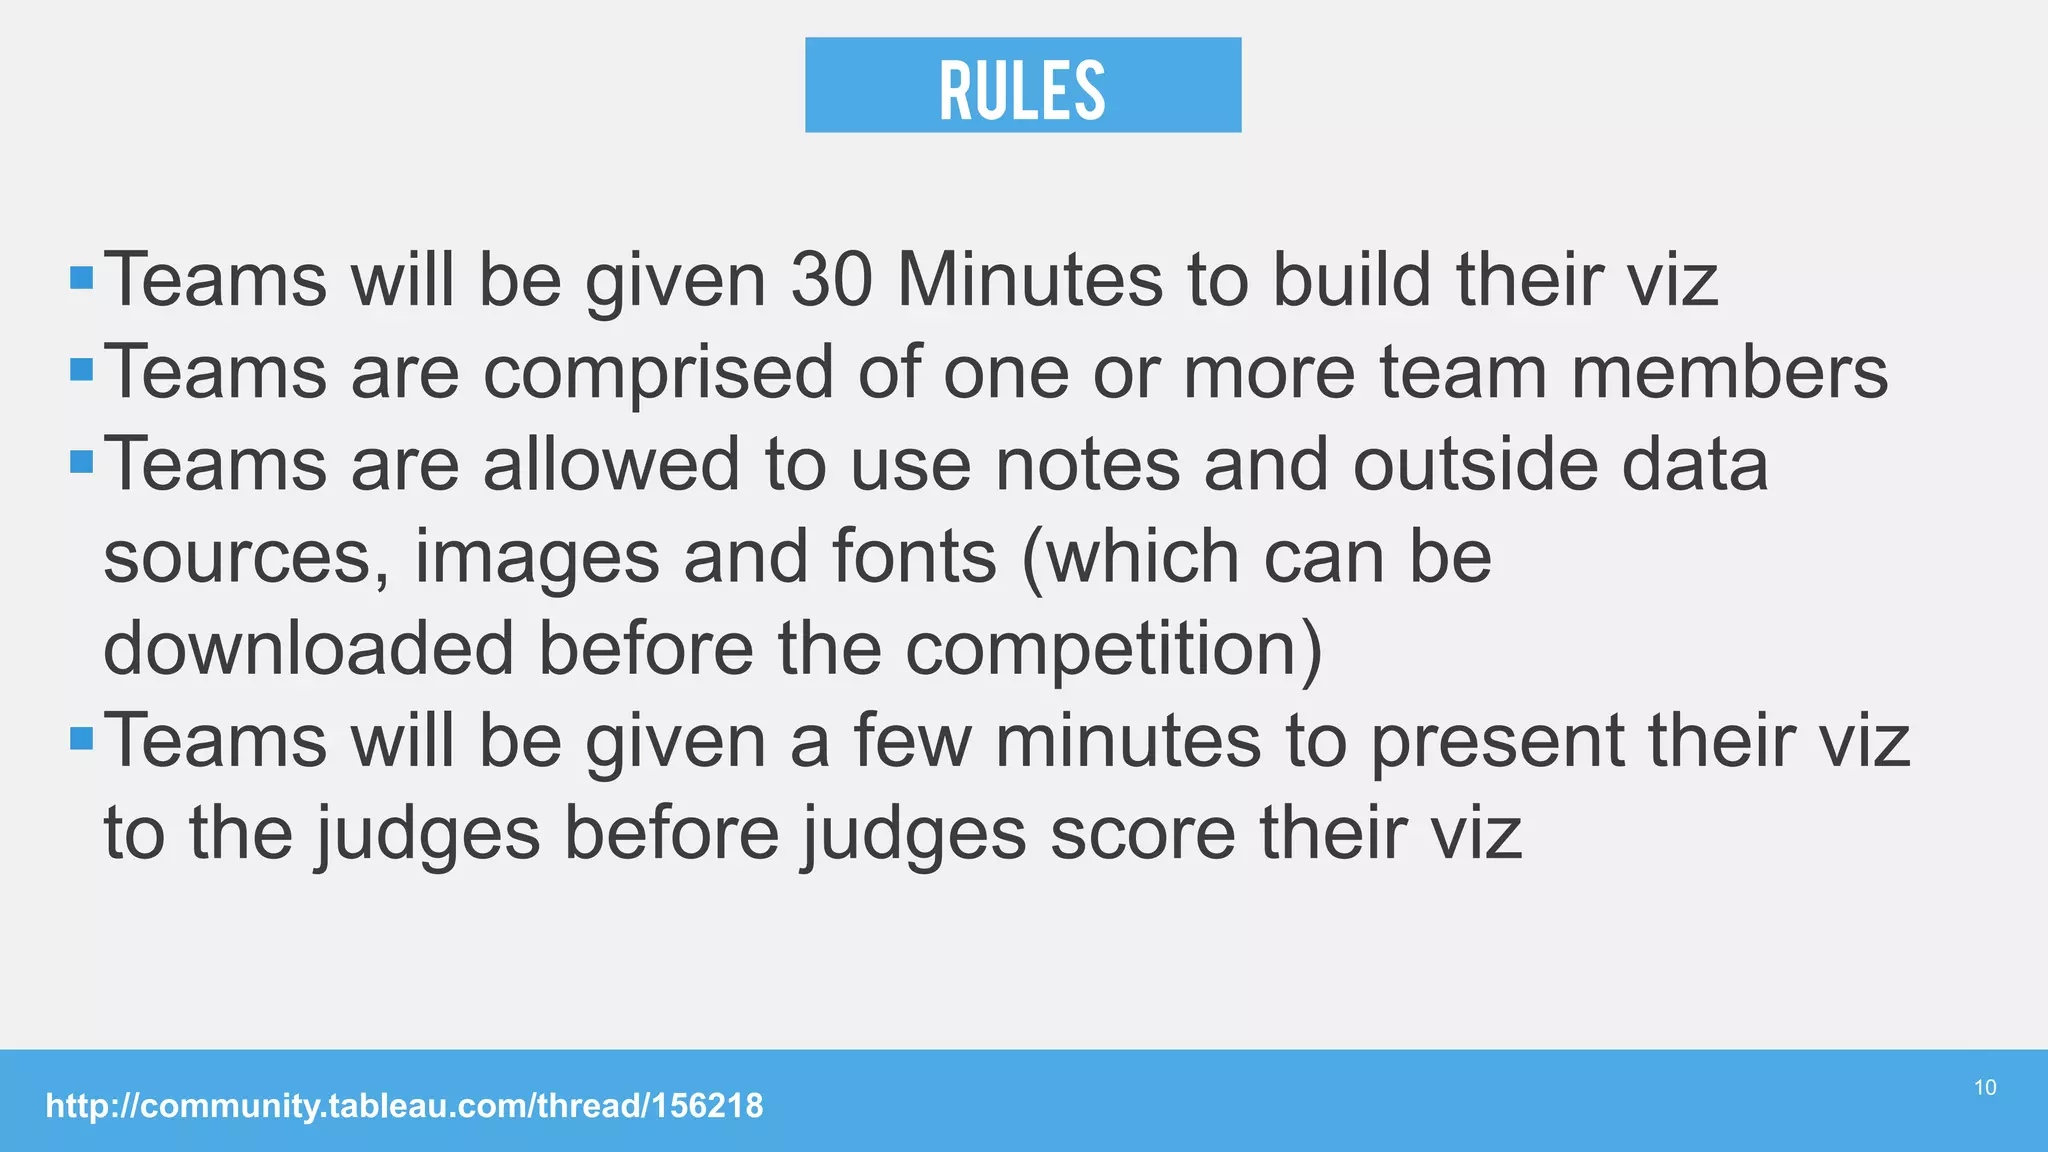
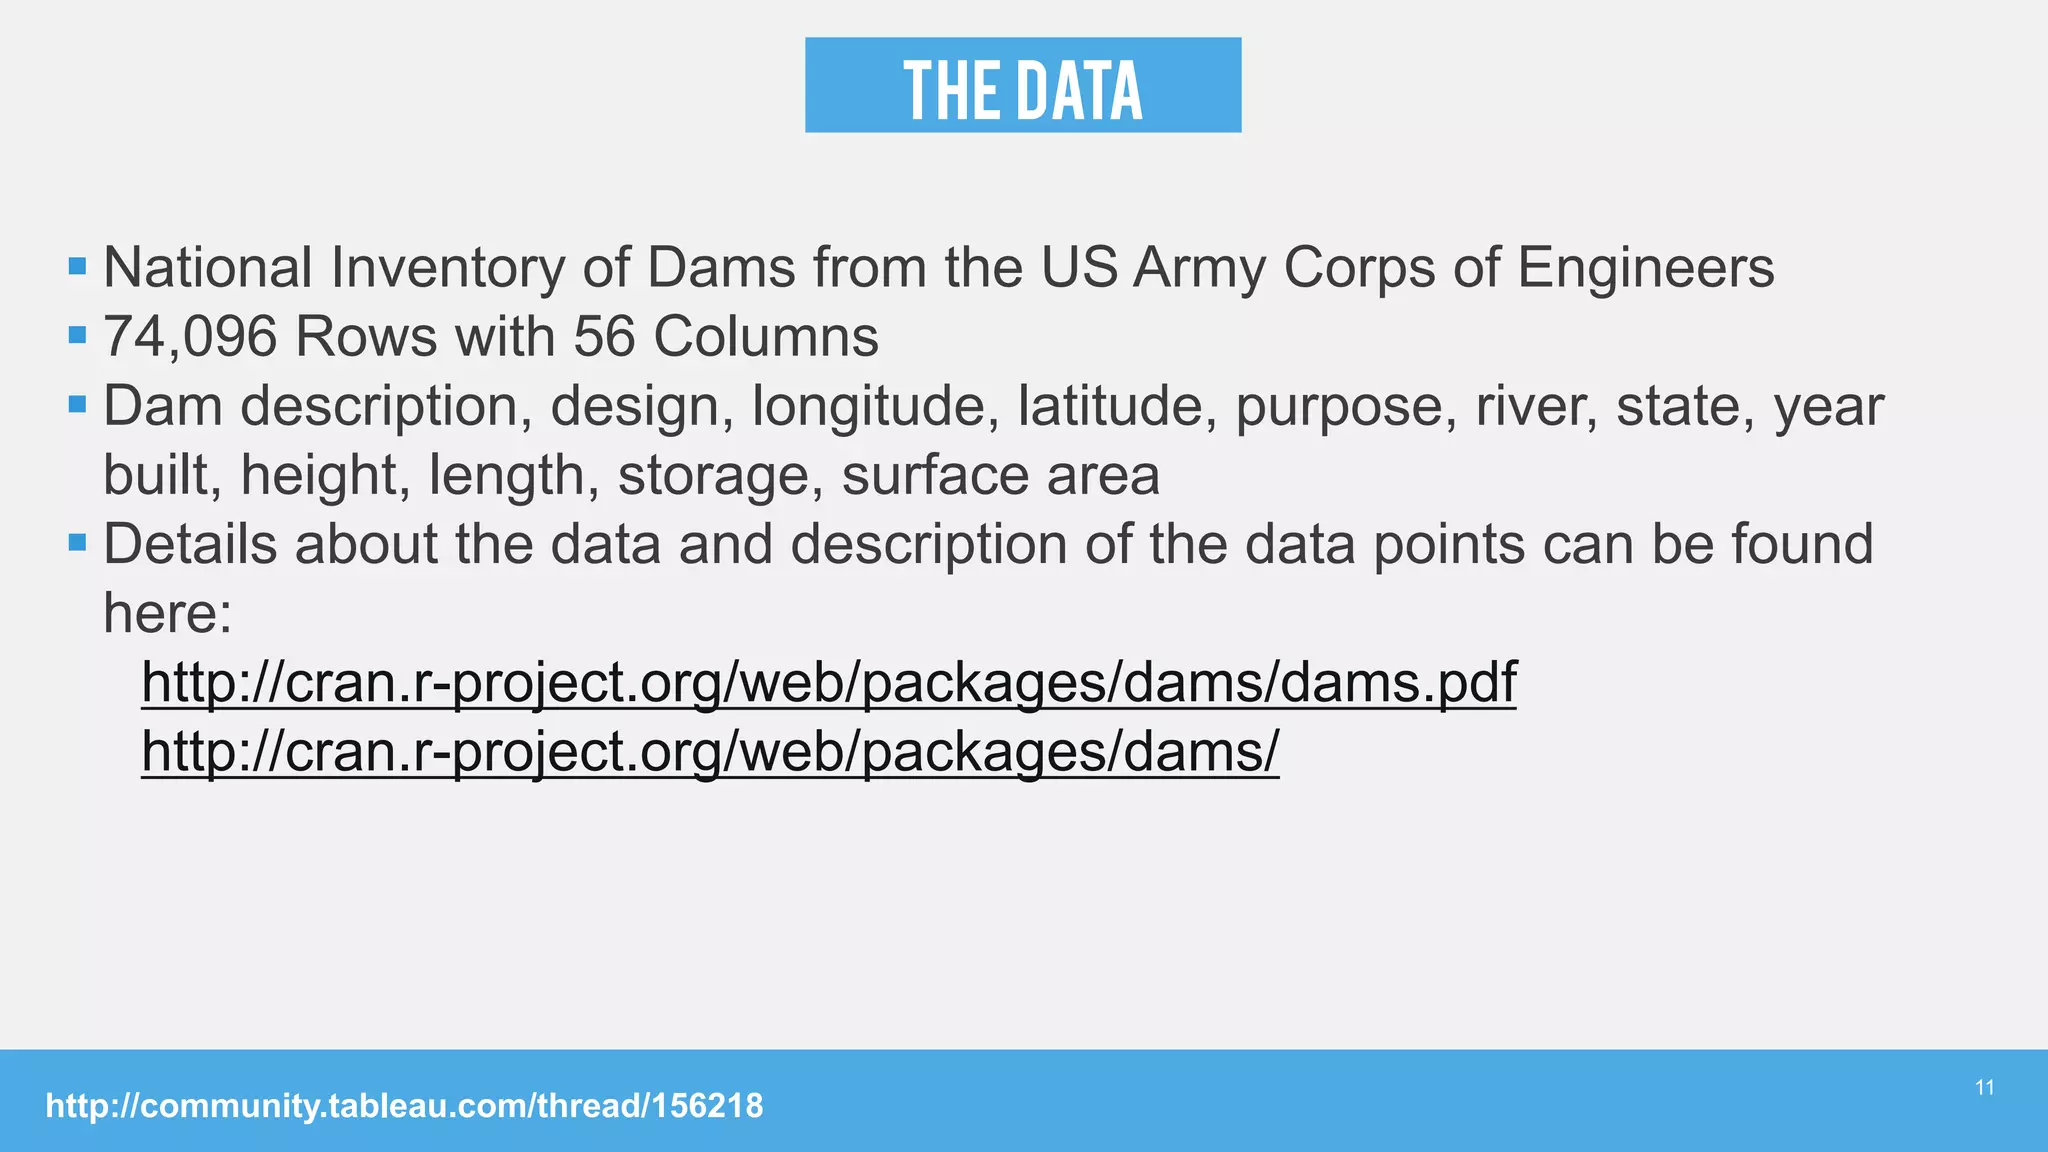
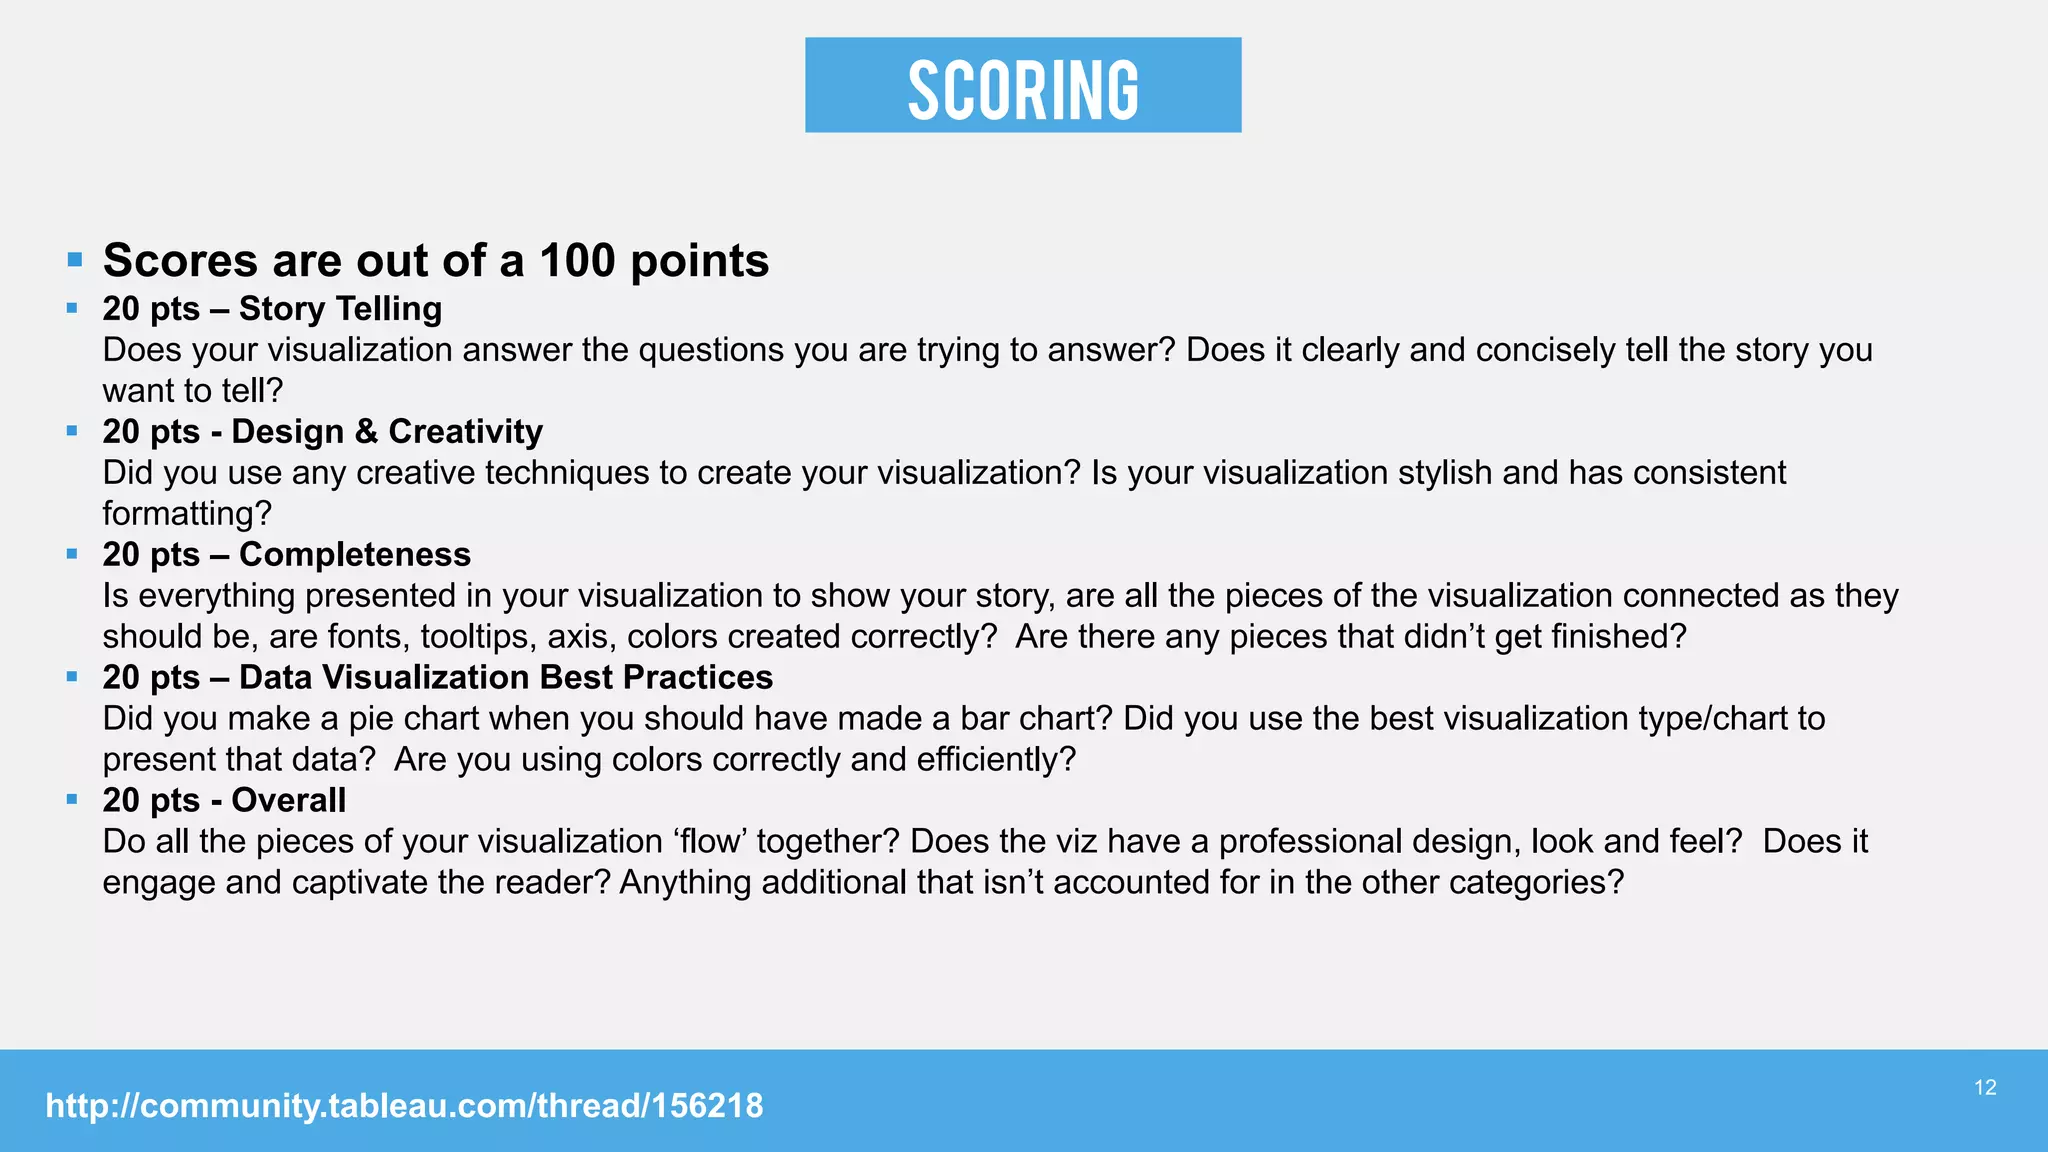
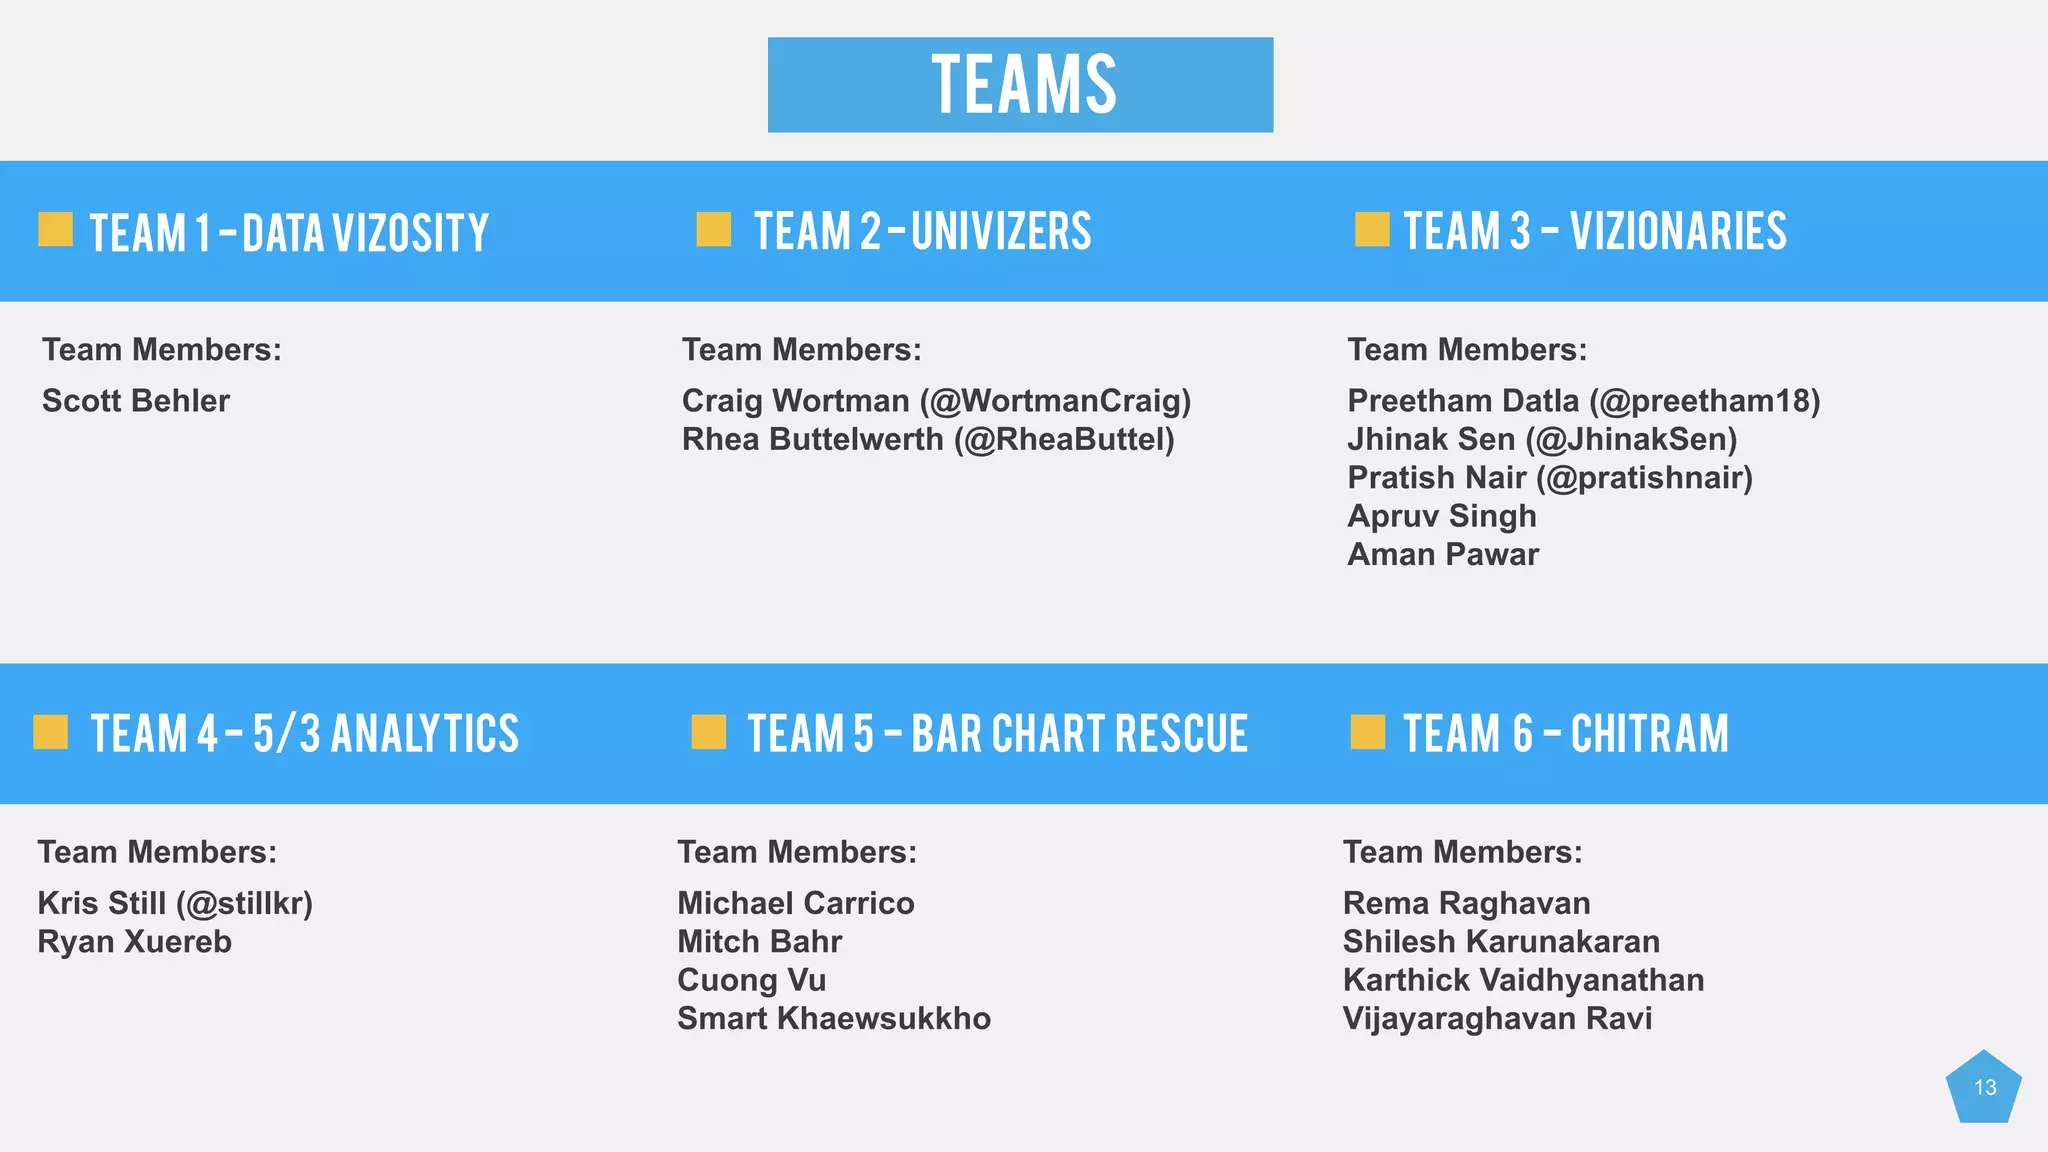
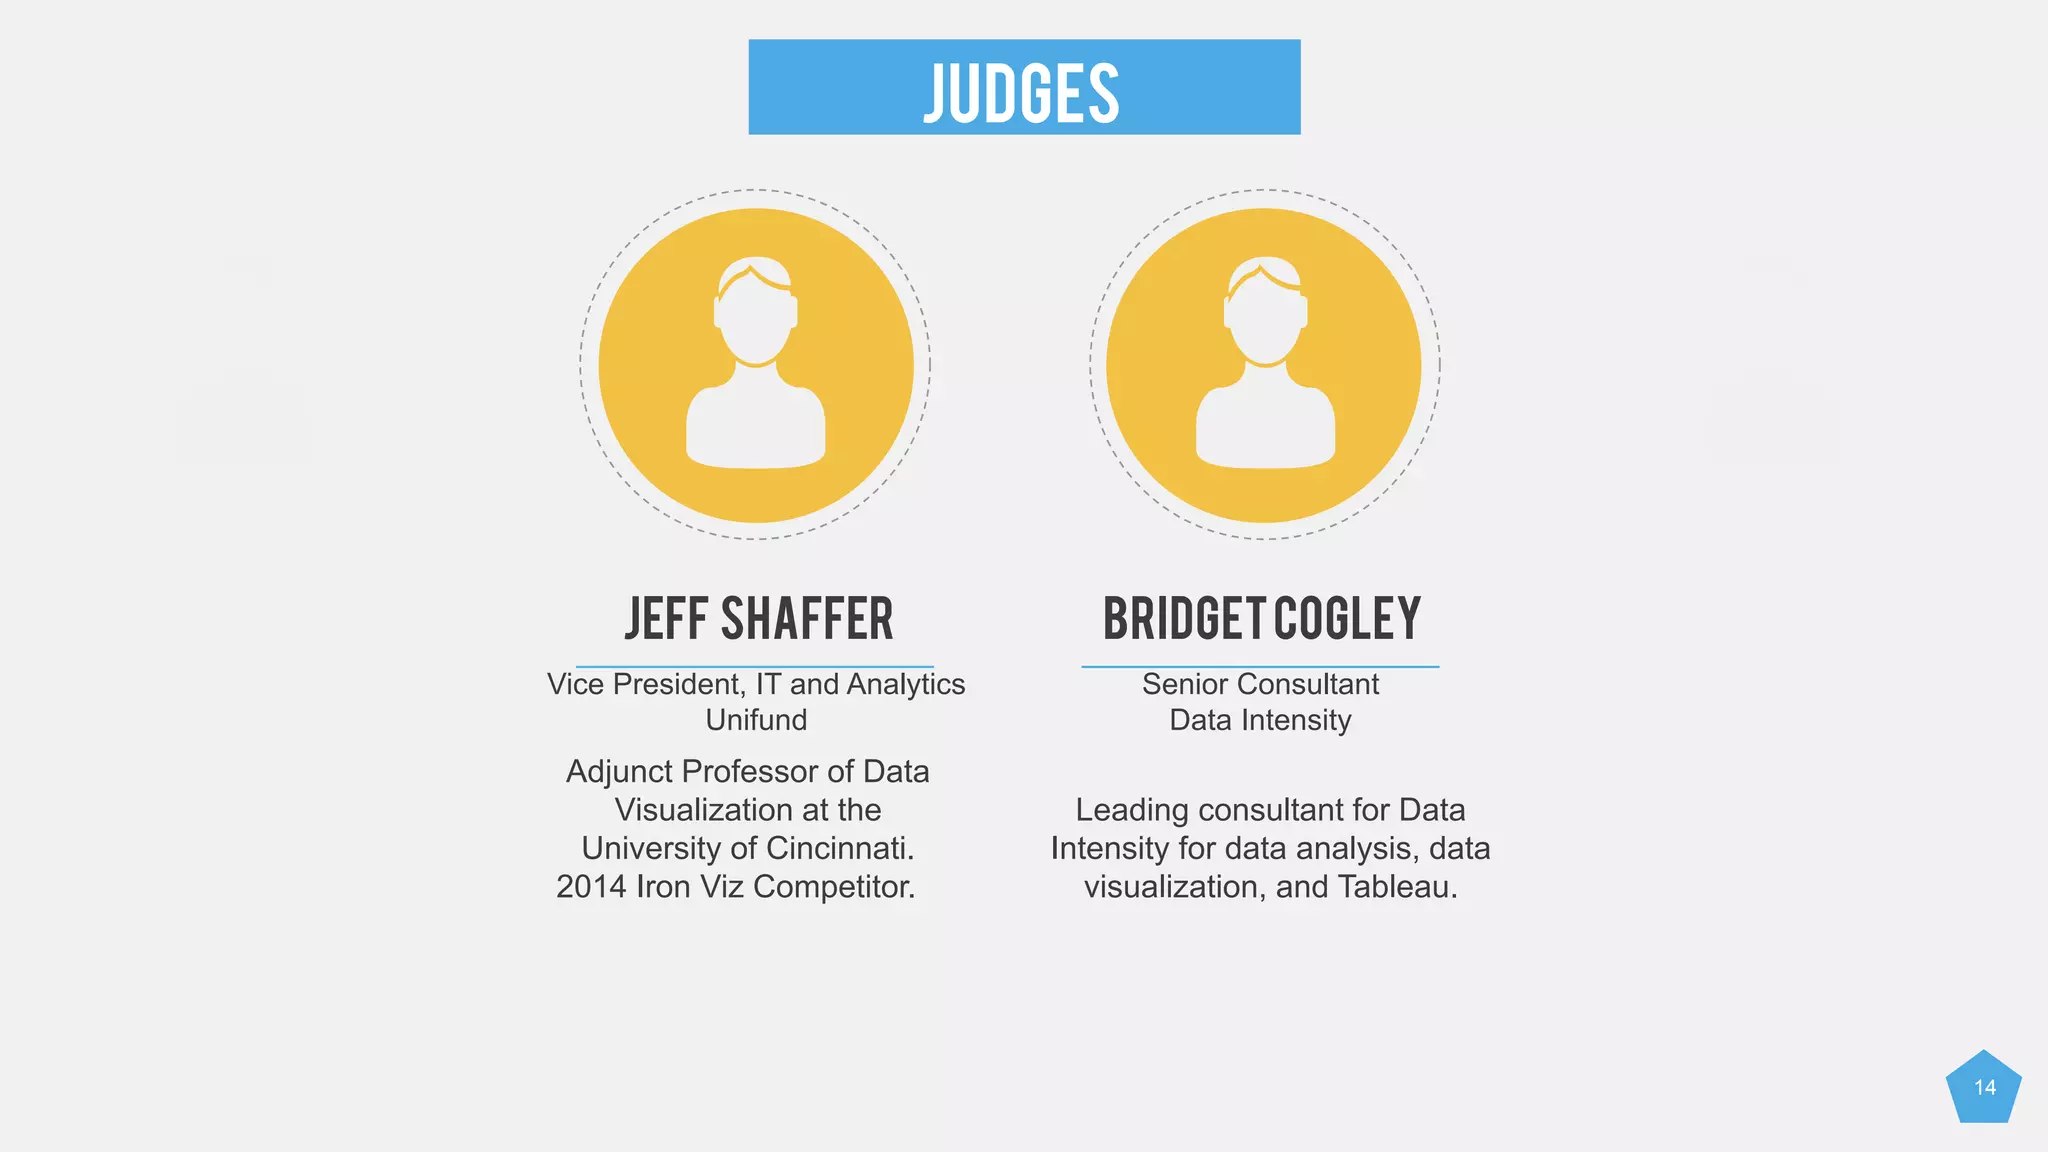
Tableau USER GROUP
CINCINNATI
Event #2 – Cincinnati Iron Viz
2
ARRIVE & NETWORK
Grab a bite to eat, socialize
with other Tableau users, and
grab a chair for the event.
COMPETITION START
Competitors will get 30
minutes to build a viz. We’ll
be checking in on teams
throughout the 30 minutes.
JUDGING
Each team will get a few
minutes to discuss their viz,
and then Judges will provide
feedback.
AGENDA
5:30
Introduce the local Cincinnati
User Group and details of the
Cincinnati Iron Viz
INTRODUCTION
6:00
6:15
6:45
7:30
SOCIALIZE
Talk to your local Tableau
users and discuss Tableau
related items
3
JOIN US
You Should Join The Cincinnati
Tableau User Group
- Biz Markie
Please Join The Cincinnati
User Group Page
http://community.tableau.
com/groups/midwest
4
Administrators
ERIC DUELL JEFF SHAFFER KRIS STILL CRAIG WORTMAN
VP of Analytics and Intelligence
E.W. Scripps Company
Vice President, IT and Analytics
Unifund
Human Capital Analytics Consultant
Fifth Third Bank
Data Analyst
Unifund
Adjunct Professor of Data
Visualization at the
University of Cincinnati.
Adjunct Professor of Data
Visualization at the
University of Cincinnati.
Lead Human Capital Analytics
Consultant at Fifth Third Bank.
Tableau Desktop and Server
user for four years.
Tableau Desktop and Server
user for four years.
@ericduell @HighVizAbility @WortmanCraig
www.DataPlusScience.com
5
GROUP LEADER
@russellspangler russellspangler@gmail.comwww.linkedin.com/in/russellspangler/
RUSSELL SPANGLER
Sr. BI Analyst
Senior Business Intelligence Analyst at
Unifund. Adjunct Professor for Data
Management at the University of Cincinnati.
Master of Science and Bachelor of Science in
Information Systems. Tableau Server
administrator and Tableau desktop user for
about 4 Years.
6
NEXT EVENT
Wednesday May 6th
University of Cincinnati
Carl H. Lindner College of
Business
More details will be posted
to the user group page.
7
OTHER EVENTS
University of Cincinnati Professional
Training Courses
Excel Analytics (March 26, 27)
http://business.uc.edu/centers/analytics-center/analytics-
training/analytics-in-excel.html
Introduction to Data Mining (April 2, 3)
http://business.uc.edu/centers/analytics-center/analytics-
training/introduction-to-data-mining.html
Advance Data Mining (April 23, 24)
http://business.uc.edu/centers/analytics-center/analytics-
training/advanced-data-mining.html
UC Analytics Summit 2015 (May 29)
http://business.uc.edu/centers/analytics-center/events.html
8
OfficialTableauTrain
Tableau Training coming to Cincinnati
Tableau Fundamentals 2-Day Class (Blue Ash)
Monday, April 13, 2015 - Tuesday, April 14, 2015
8:30 AM - 5:00 PM
bit.ly/1BU8kVK
Tableau Advanced 2-Day Class (Blue Ash)
Monday, April 13, 2015 - Tuesday, April 14, 2015
8:30 AM - 5:00 PM
bit.ly/1BPupnj
9CINCINNATI IRON VIZ
RULES
Teams will be given 30 Minutes to build their viz
Teams are comprised of one or more team members
Teams are allowed to use notes and outside data
sources, images and fonts (which can be
downloaded before the competition)
Teams will be given a few minutes to present their viz
to the judges before judges score their viz
http://community.tableau.com/thread/156218
10
THE Data
 National Inventory of Dams from the US Army Corps of Engineers
 74,096 Rows with 56 Columns
 Dam description, design, longitude, latitude, purpose, river, state, year
built, height, length, storage, surface area
 Details about the data and description of the data points can be found
here:
http://cran.r-project.org/web/packages/dams/dams.pdf
http://cran.r-project.org/web/packages/dams/
http://community.tableau.com/thread/156218
11
SCORING
 Scores are out of a 100 points
 20 pts – Story Telling
Does your visualization answer the questions you are trying to answer? Does it clearly and concisely tell the story you
want to tell?
 20 pts - Design & Creativity
Did you use any creative techniques to create your visualization? Is your visualization stylish and has consistent
formatting?
 20 pts – Completeness
Is everything presented in your visualization to show your story, are all the pieces of the visualization connected as they
should be, are fonts, tooltips, axis, colors created correctly? Are there any pieces that didn’t get finished?
 20 pts – Data Visualization Best Practices
Did you make a pie chart when you should have made a bar chart? Did you use the best visualization type/chart to
present that data? Are you using colors correctly and efficiently?
 20 pts - Overall
Do all the pieces of your visualization ‘flow’ together? Does the viz have a professional design, look and feel? Does it
engage and captivate the reader? Anything additional that isn’t accounted for in the other categories?
http://community.tableau.com/thread/156218
12
13
TEAMS
Team Members:
Scott Behler
Team Members:
Craig Wortman (@WortmanCraig)
Rhea Buttelwerth (@RheaButtel)
Team Members:
Preetham Datla (@preetham18)
Jhinak Sen (@JhinakSen)
Pratish Nair (@pratishnair)
Apruv Singh
Aman Pawar
TEAM 1 -DataVIZOSITY TEAM 2-UniVIZERS TEAM 3 - VIZIONARIES
Team Members:
Kris Still (@stillkr)
Ryan Xuereb
Team Members:
Michael Carrico
Mitch Bahr
Cuong Vu
Smart Khaewsukkho
Team Members:
Rema Raghavan
Shilesh Karunakaran
Karthick Vaidhyanathan
Vijayaraghavan Ravi
TEAM 4- 5/3 ANALYTICS TEAM 5 - BAR CHART RESCUE TEAM 6 - CHITRAM
14
JUDGES
JEFF SHAFFER BRIDGETCOGLEY
Vice President, IT and Analytics
Unifund
Senior Consultant
Data Intensity
Adjunct Professor of Data
Visualization at the
University of Cincinnati.
2014 Iron Viz Competitor.
Leading consultant for Data
Intensity for data analysis, data
visualization, and Tableau.
15
COMPETITORS READY
16

Cincinnati Tableau User Group Event #2

  • 1.
    Tableau USER GROUP CINCINNATI Event#2 – Cincinnati Iron Viz
  • 2.
    2 ARRIVE & NETWORK Graba bite to eat, socialize with other Tableau users, and grab a chair for the event. COMPETITION START Competitors will get 30 minutes to build a viz. We’ll be checking in on teams throughout the 30 minutes. JUDGING Each team will get a few minutes to discuss their viz, and then Judges will provide feedback. AGENDA 5:30 Introduce the local Cincinnati User Group and details of the Cincinnati Iron Viz INTRODUCTION 6:00 6:15 6:45 7:30 SOCIALIZE Talk to your local Tableau users and discuss Tableau related items
  • 3.
    3 JOIN US You ShouldJoin The Cincinnati Tableau User Group - Biz Markie Please Join The Cincinnati User Group Page http://community.tableau. com/groups/midwest
  • 4.
    4 Administrators ERIC DUELL JEFFSHAFFER KRIS STILL CRAIG WORTMAN VP of Analytics and Intelligence E.W. Scripps Company Vice President, IT and Analytics Unifund Human Capital Analytics Consultant Fifth Third Bank Data Analyst Unifund Adjunct Professor of Data Visualization at the University of Cincinnati. Adjunct Professor of Data Visualization at the University of Cincinnati. Lead Human Capital Analytics Consultant at Fifth Third Bank. Tableau Desktop and Server user for four years. Tableau Desktop and Server user for four years. @ericduell @HighVizAbility @WortmanCraig www.DataPlusScience.com
  • 5.
    5 GROUP LEADER @russellspangler russellspangler@gmail.comwww.linkedin.com/in/russellspangler/ RUSSELLSPANGLER Sr. BI Analyst Senior Business Intelligence Analyst at Unifund. Adjunct Professor for Data Management at the University of Cincinnati. Master of Science and Bachelor of Science in Information Systems. Tableau Server administrator and Tableau desktop user for about 4 Years.
  • 6.
    6 NEXT EVENT Wednesday May6th University of Cincinnati Carl H. Lindner College of Business More details will be posted to the user group page.
  • 7.
    7 OTHER EVENTS University ofCincinnati Professional Training Courses Excel Analytics (March 26, 27) http://business.uc.edu/centers/analytics-center/analytics- training/analytics-in-excel.html Introduction to Data Mining (April 2, 3) http://business.uc.edu/centers/analytics-center/analytics- training/introduction-to-data-mining.html Advance Data Mining (April 23, 24) http://business.uc.edu/centers/analytics-center/analytics- training/advanced-data-mining.html UC Analytics Summit 2015 (May 29) http://business.uc.edu/centers/analytics-center/events.html
  • 8.
    8 OfficialTableauTrain Tableau Training comingto Cincinnati Tableau Fundamentals 2-Day Class (Blue Ash) Monday, April 13, 2015 - Tuesday, April 14, 2015 8:30 AM - 5:00 PM bit.ly/1BU8kVK Tableau Advanced 2-Day Class (Blue Ash) Monday, April 13, 2015 - Tuesday, April 14, 2015 8:30 AM - 5:00 PM bit.ly/1BPupnj
  • 9.
  • 10.
    RULES Teams will begiven 30 Minutes to build their viz Teams are comprised of one or more team members Teams are allowed to use notes and outside data sources, images and fonts (which can be downloaded before the competition) Teams will be given a few minutes to present their viz to the judges before judges score their viz http://community.tableau.com/thread/156218 10
  • 11.
    THE Data  NationalInventory of Dams from the US Army Corps of Engineers  74,096 Rows with 56 Columns  Dam description, design, longitude, latitude, purpose, river, state, year built, height, length, storage, surface area  Details about the data and description of the data points can be found here: http://cran.r-project.org/web/packages/dams/dams.pdf http://cran.r-project.org/web/packages/dams/ http://community.tableau.com/thread/156218 11
  • 12.
    SCORING  Scores areout of a 100 points  20 pts – Story Telling Does your visualization answer the questions you are trying to answer? Does it clearly and concisely tell the story you want to tell?  20 pts - Design & Creativity Did you use any creative techniques to create your visualization? Is your visualization stylish and has consistent formatting?  20 pts – Completeness Is everything presented in your visualization to show your story, are all the pieces of the visualization connected as they should be, are fonts, tooltips, axis, colors created correctly? Are there any pieces that didn’t get finished?  20 pts – Data Visualization Best Practices Did you make a pie chart when you should have made a bar chart? Did you use the best visualization type/chart to present that data? Are you using colors correctly and efficiently?  20 pts - Overall Do all the pieces of your visualization ‘flow’ together? Does the viz have a professional design, look and feel? Does it engage and captivate the reader? Anything additional that isn’t accounted for in the other categories? http://community.tableau.com/thread/156218 12
  • 13.
    13 TEAMS Team Members: Scott Behler TeamMembers: Craig Wortman (@WortmanCraig) Rhea Buttelwerth (@RheaButtel) Team Members: Preetham Datla (@preetham18) Jhinak Sen (@JhinakSen) Pratish Nair (@pratishnair) Apruv Singh Aman Pawar TEAM 1 -DataVIZOSITY TEAM 2-UniVIZERS TEAM 3 - VIZIONARIES Team Members: Kris Still (@stillkr) Ryan Xuereb Team Members: Michael Carrico Mitch Bahr Cuong Vu Smart Khaewsukkho Team Members: Rema Raghavan Shilesh Karunakaran Karthick Vaidhyanathan Vijayaraghavan Ravi TEAM 4- 5/3 ANALYTICS TEAM 5 - BAR CHART RESCUE TEAM 6 - CHITRAM
  • 14.
    14 JUDGES JEFF SHAFFER BRIDGETCOGLEY VicePresident, IT and Analytics Unifund Senior Consultant Data Intensity Adjunct Professor of Data Visualization at the University of Cincinnati. 2014 Iron Viz Competitor. Leading consultant for Data Intensity for data analysis, data visualization, and Tableau.
  • 15.
  • 16.