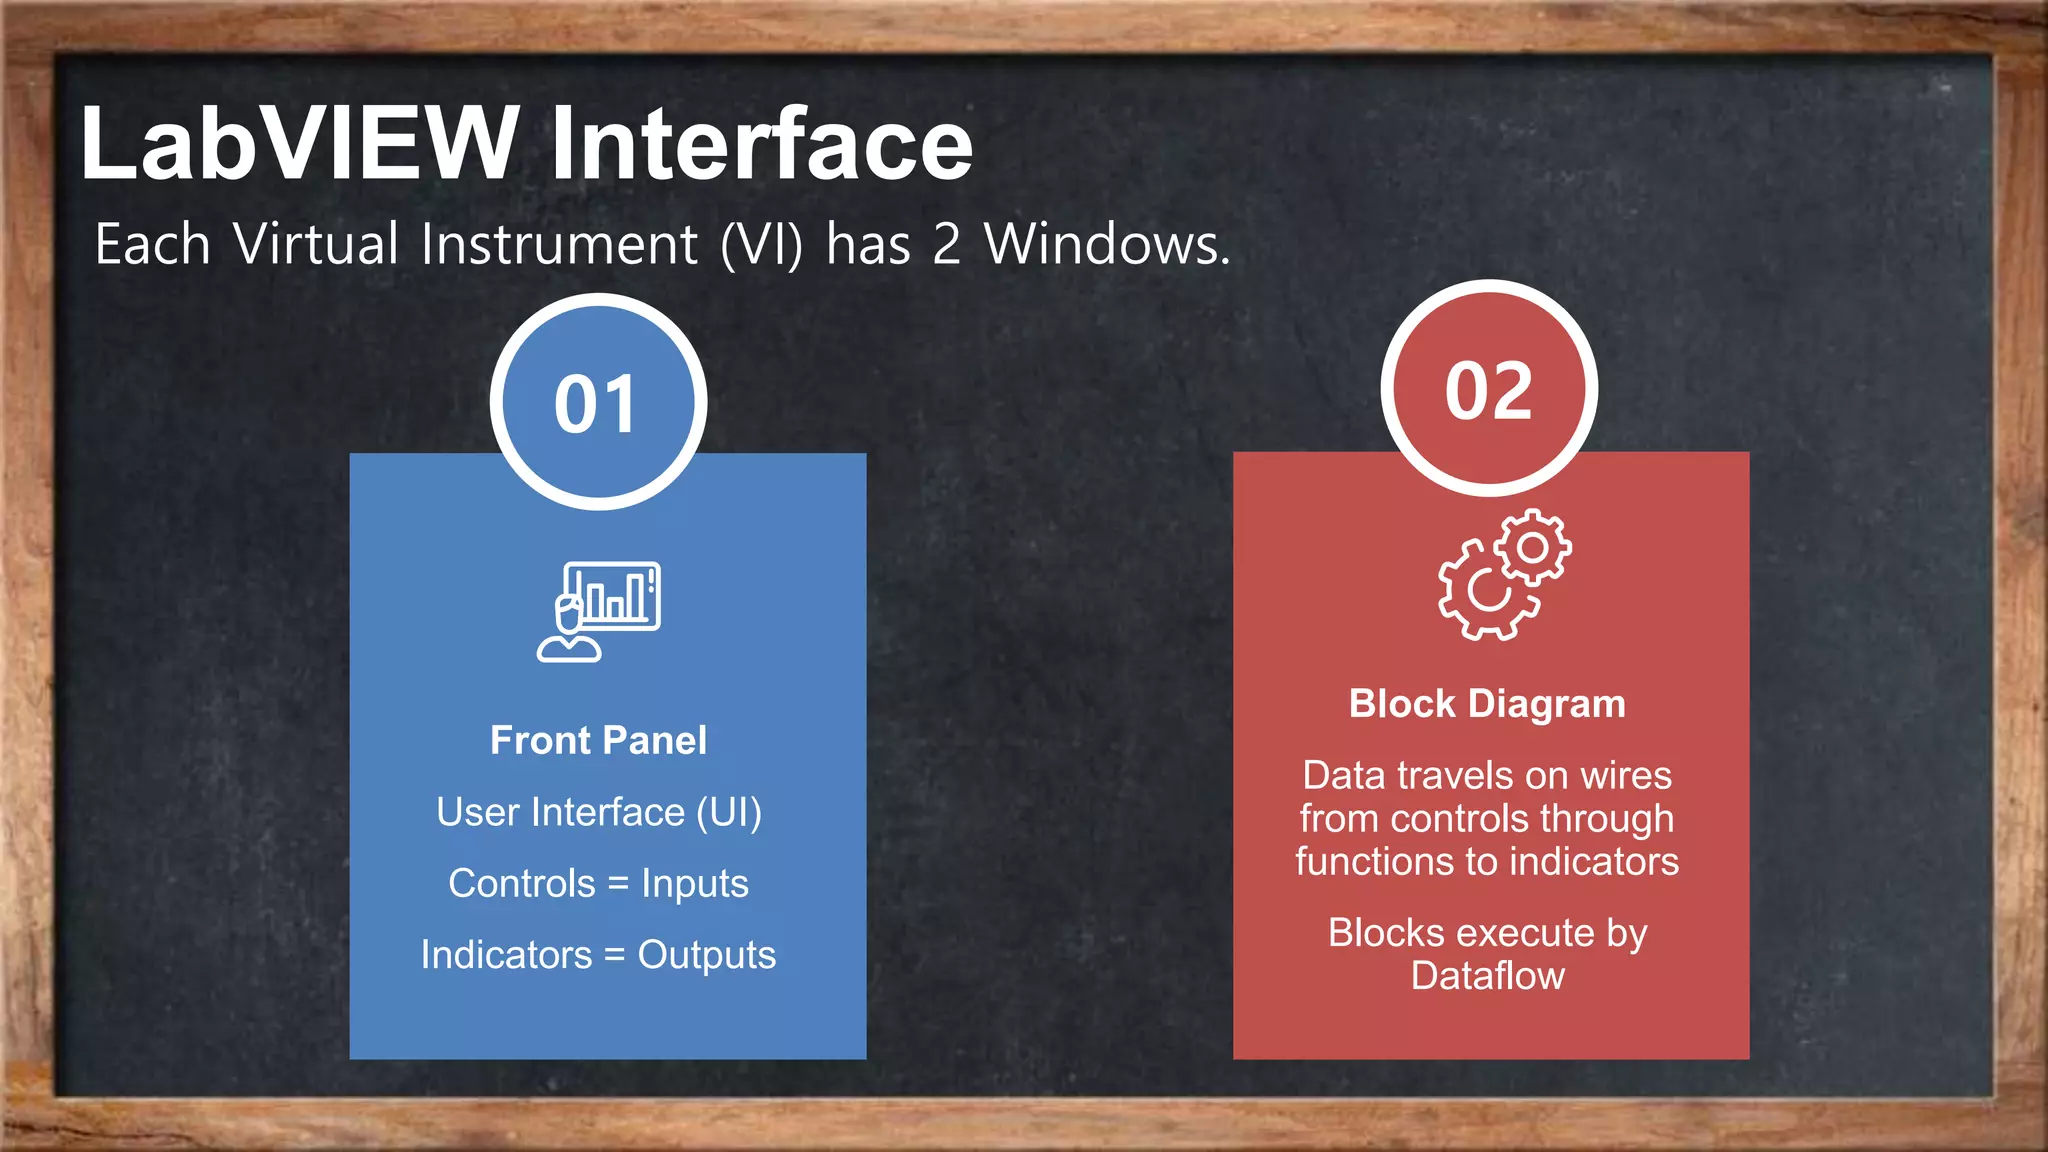
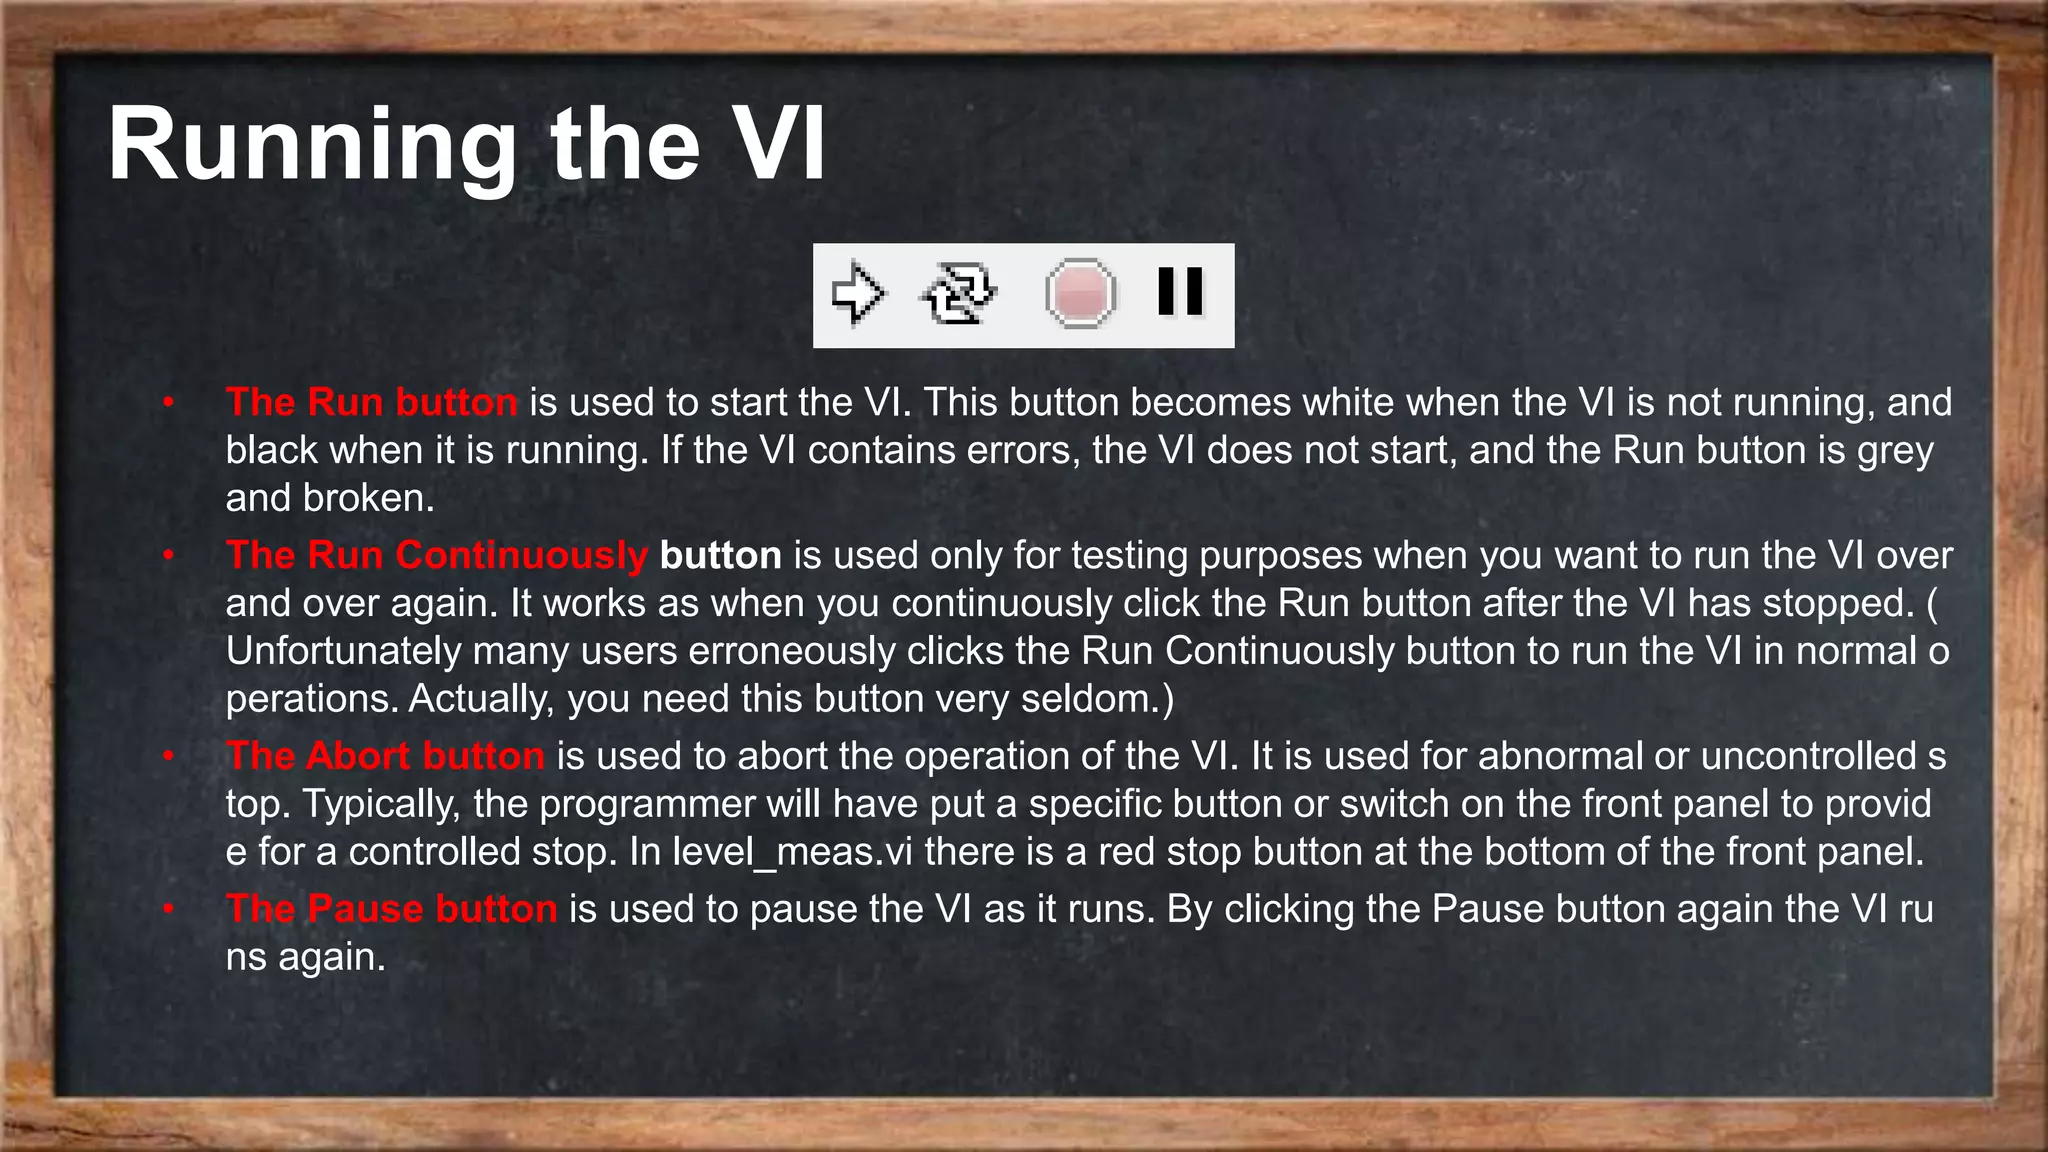
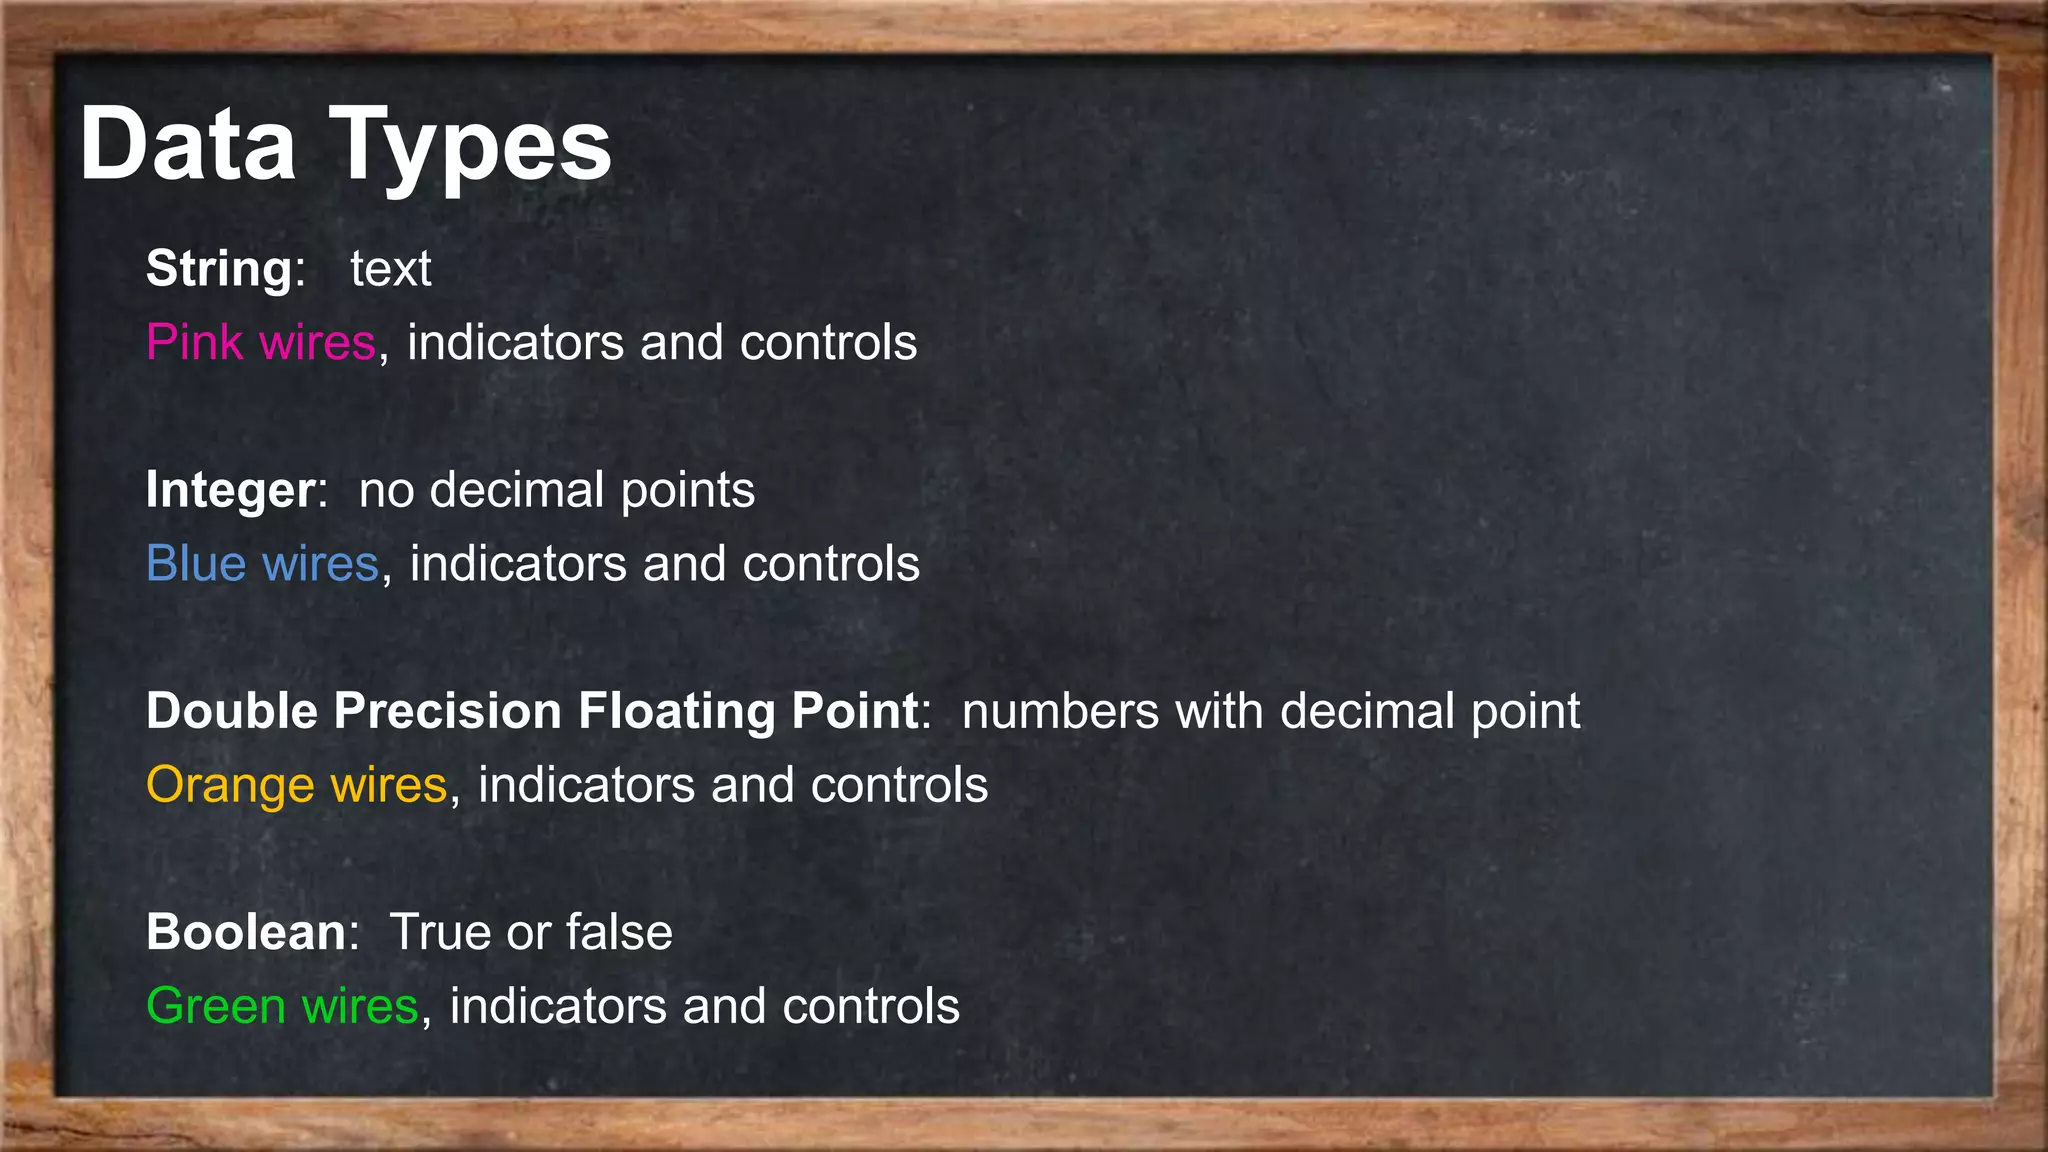
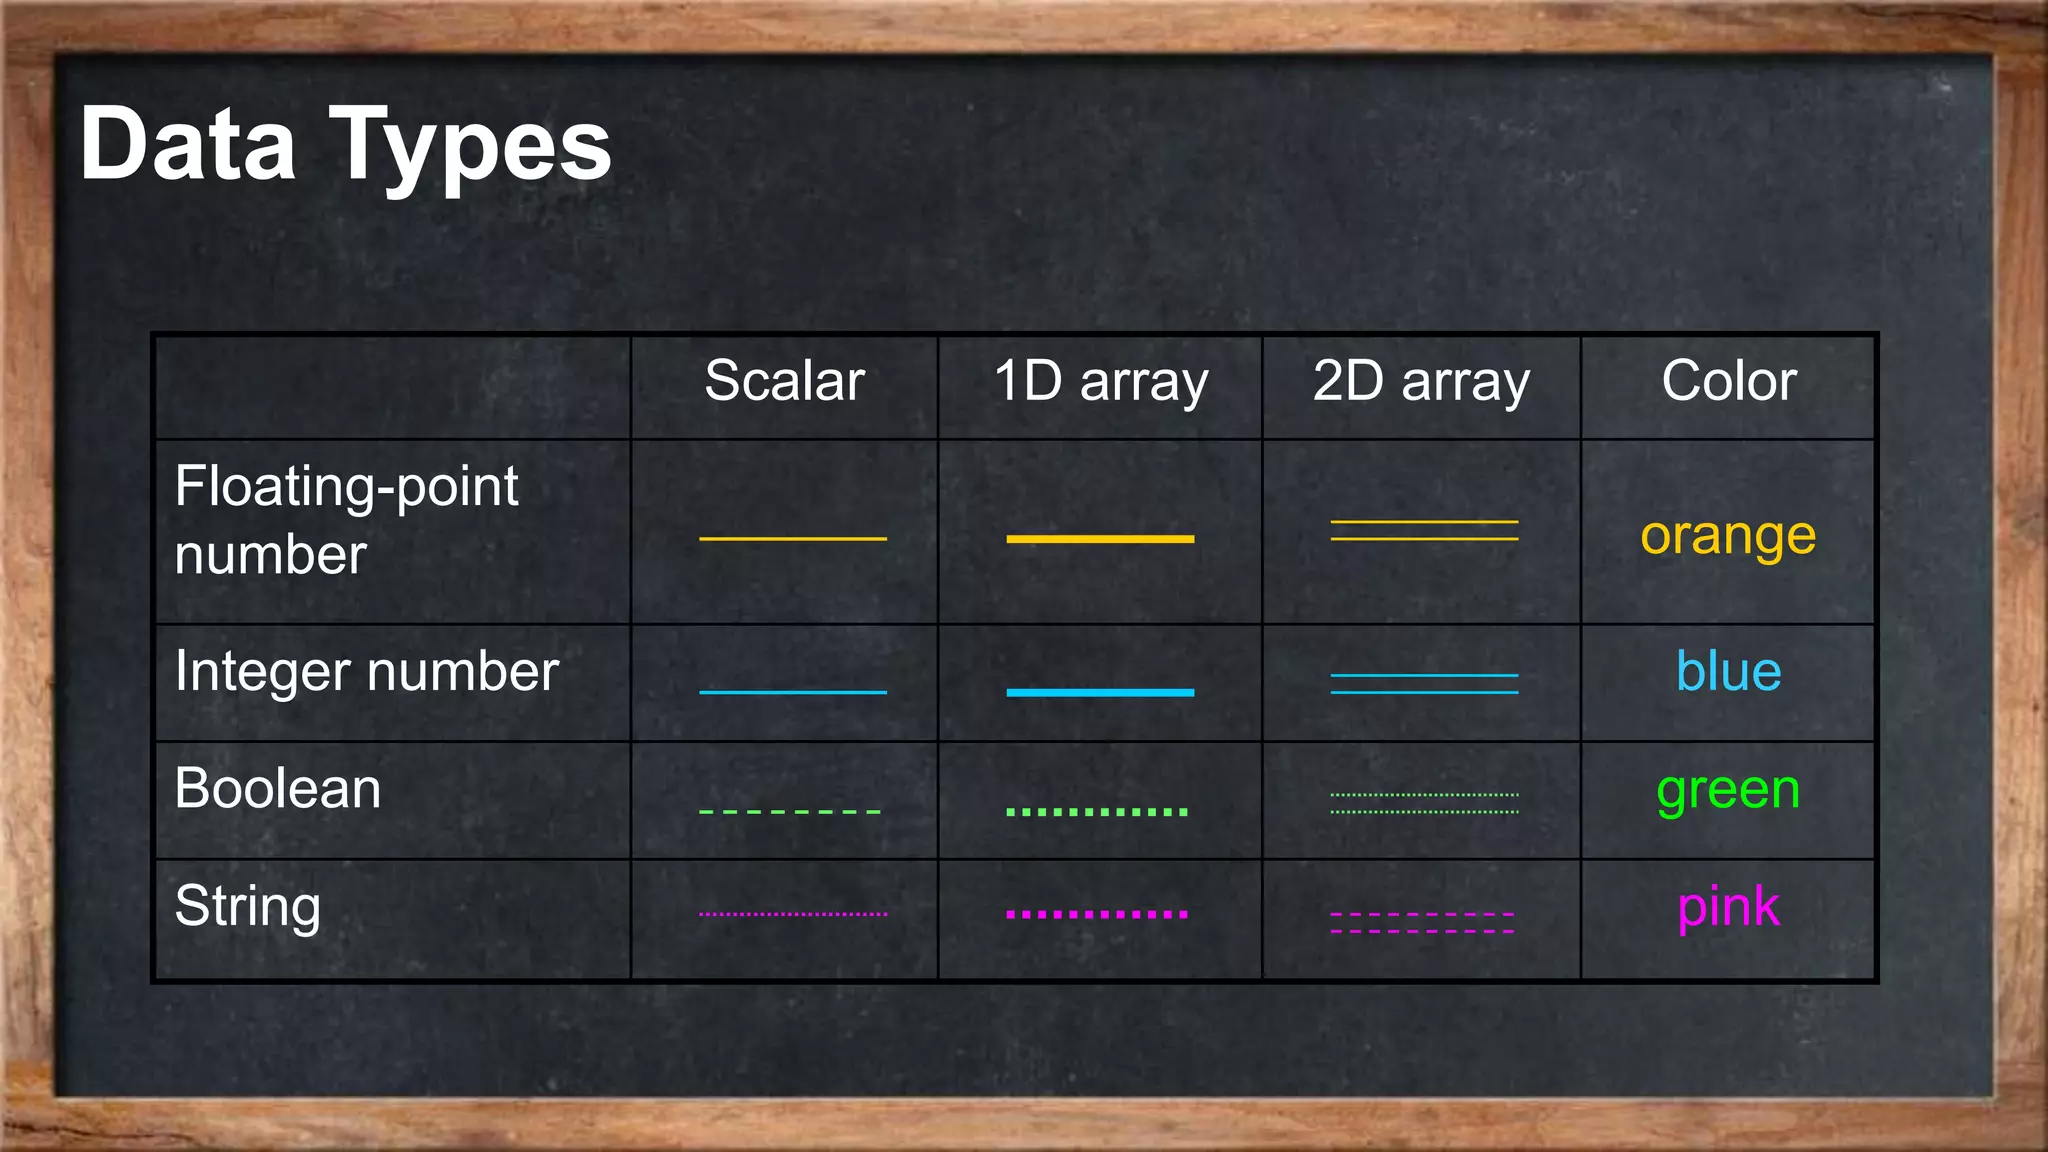
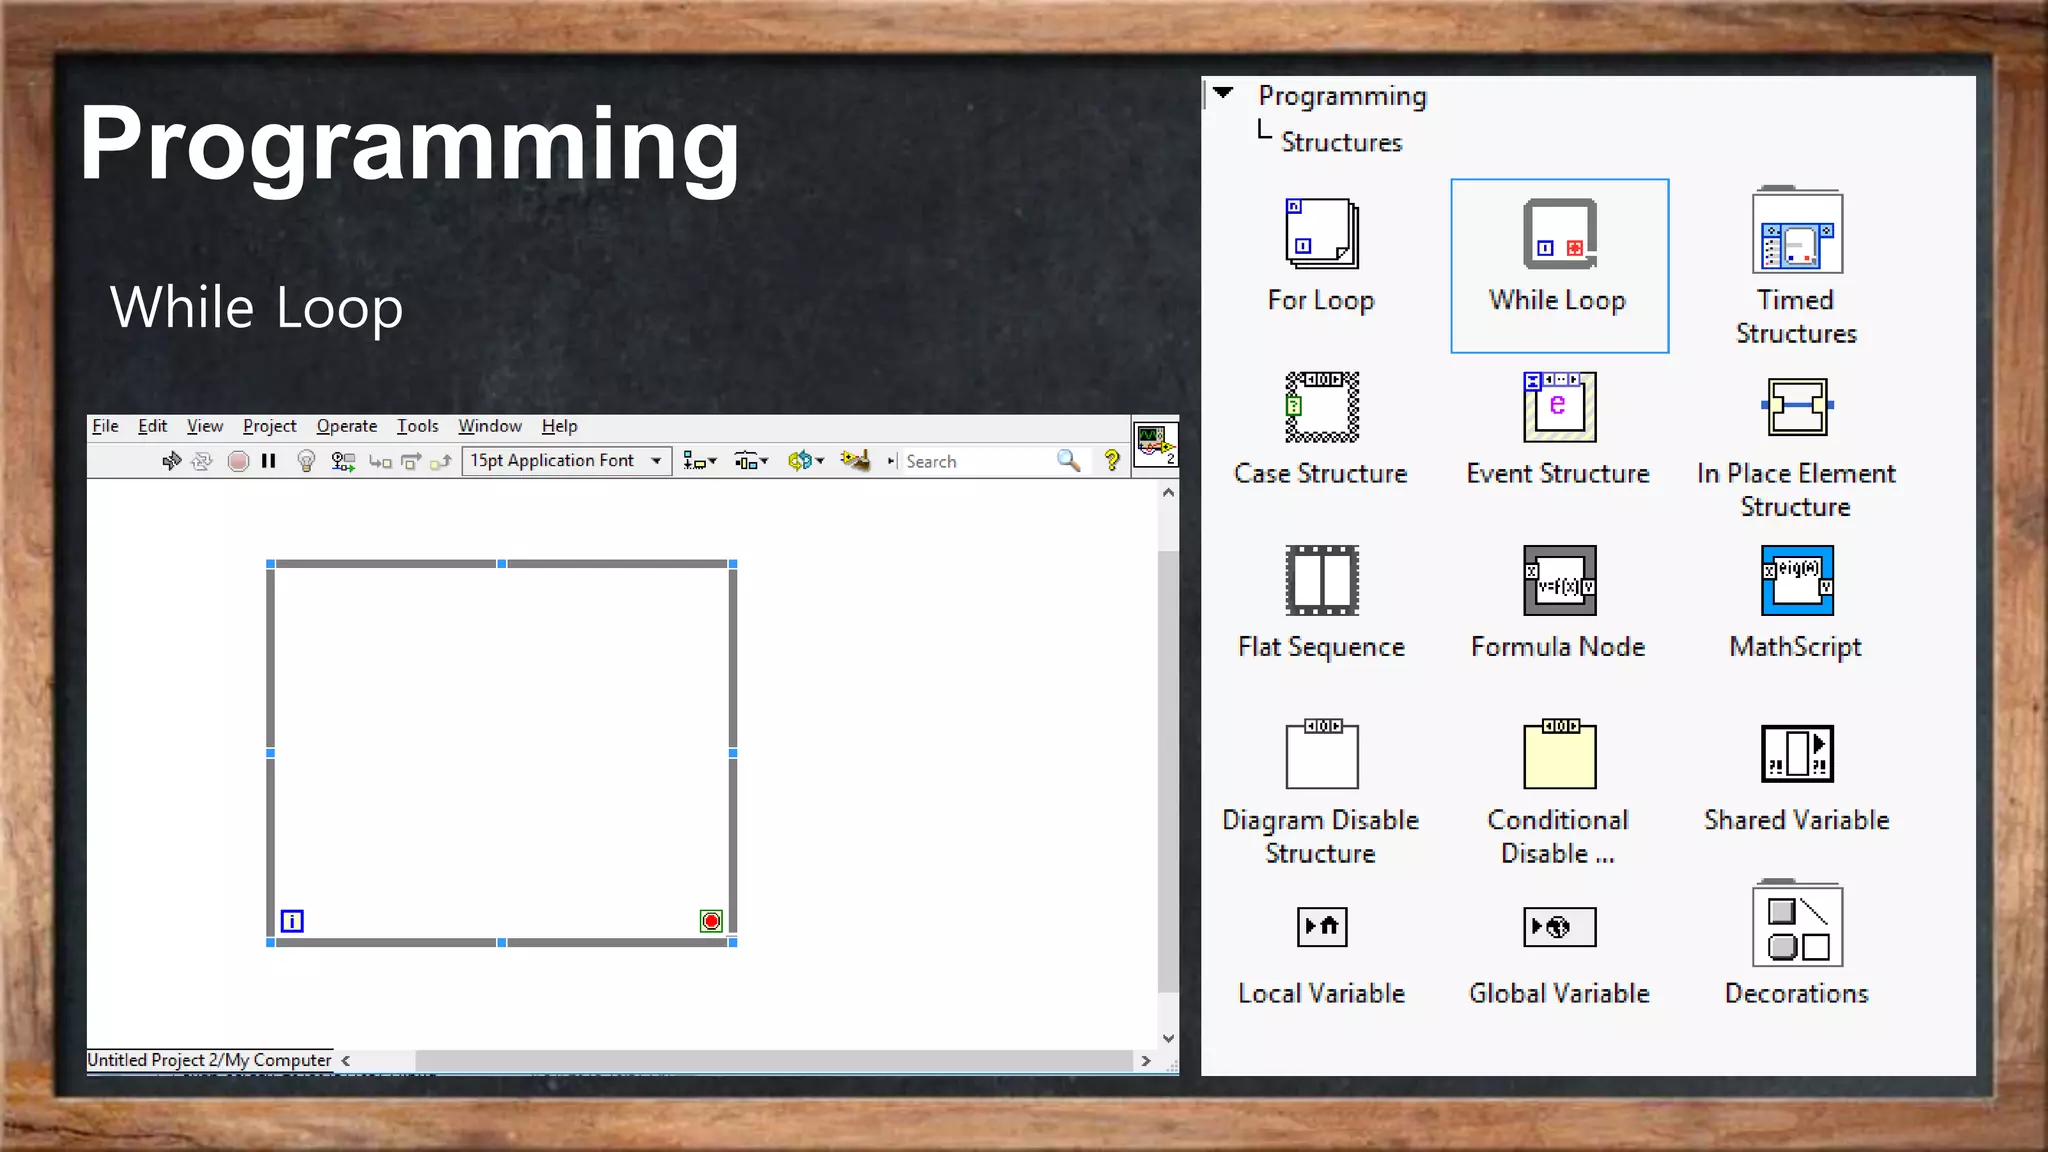
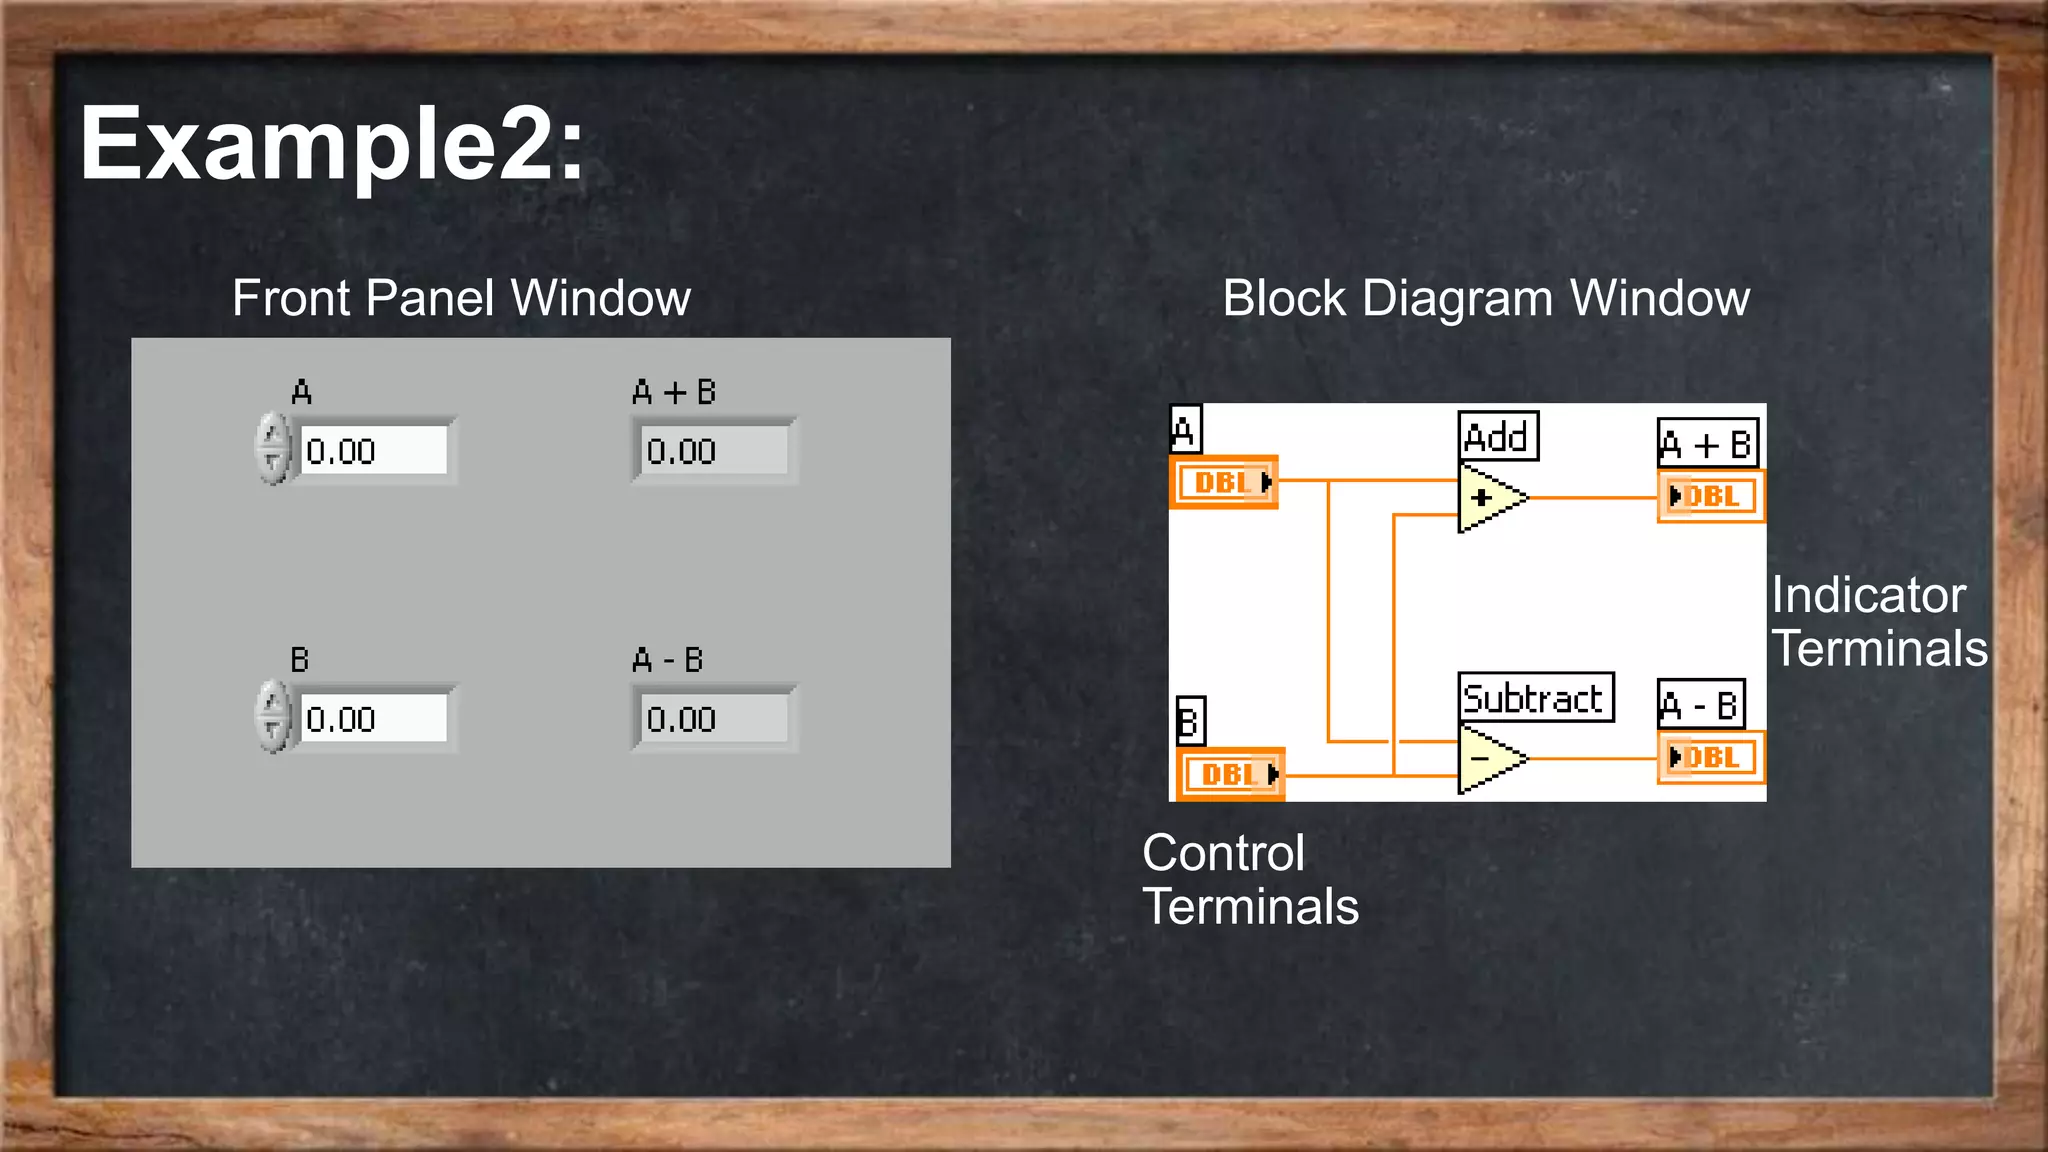
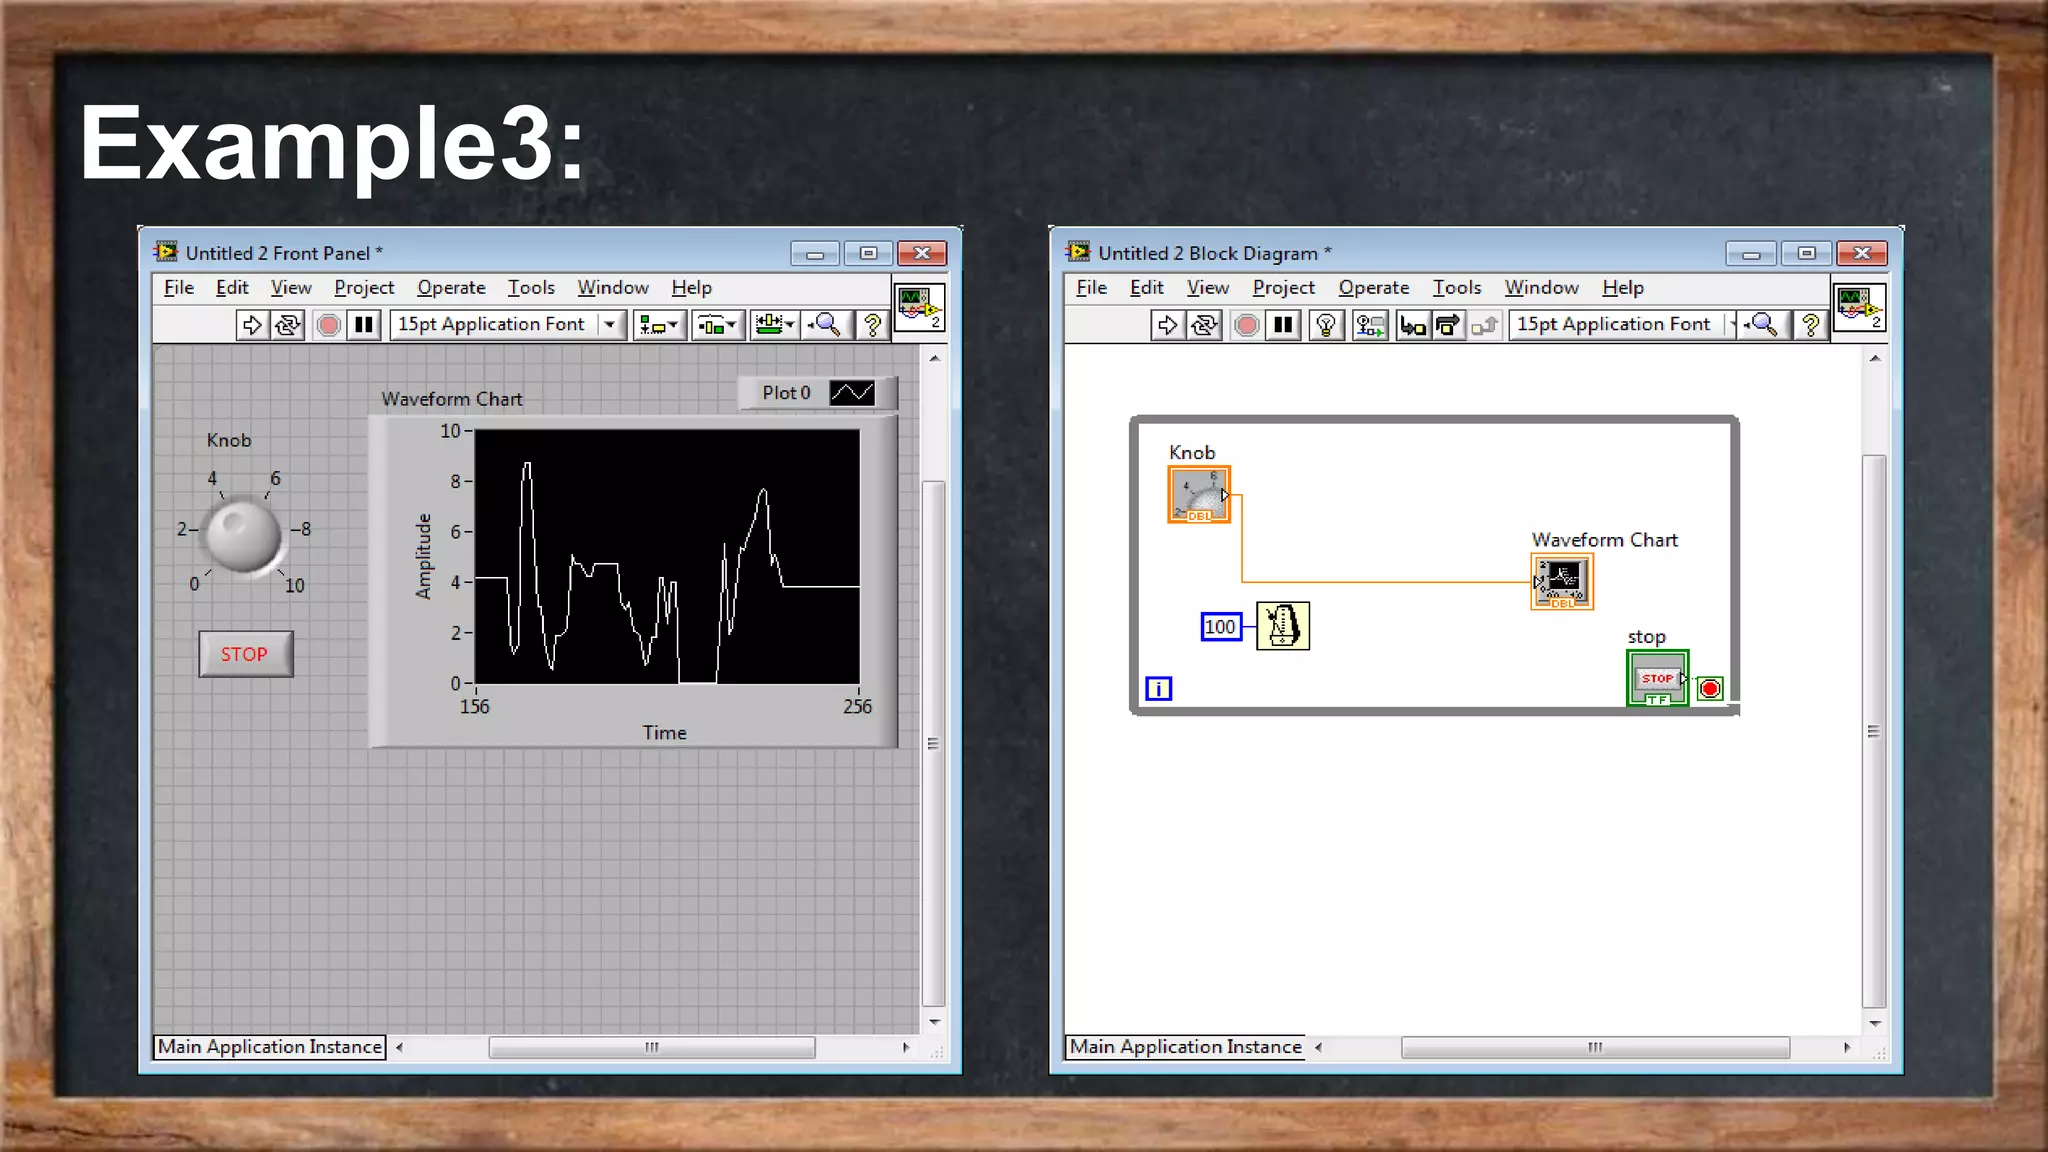
ACRRL
Applied Control & Robotics
Research Laboratory
of Shiraz University
Computer
Applications in
Control
Lecture 2
ACRRL
Applied Control & Robotics Research Laboratory
of Shiraz University
Department of Power and Control Engineering, Shiraz University, Fars, Iran.
Instructor: Dr. Asemani
TA: Mohammad Sabouri
LabVIEW Interface
02
Block Diagram
Data travels on wires
from controls through
functions to indicators
Blocks execute by
Dataflow
01
Front Panel
User Interface (UI)
Controls = Inputs
Indicators = Outputs
Each Virtual Instrument (VI) has 2 Windows.
Front Panel
Disable the Use localized decimal point option. Disabling makes LabVIEW
use point as the decimal separator. (If, in stead, this option is enabled, Lab
VIEW uses the decimal separator as defined in the settings of the Windows
operating system.)
Front Panel
Front Panel
Toolbar
Graph
Legend
Boolean
Control
Waveform
Graph
Icon
Plot
Legend
Scale
Legend
Front Panel Sample1
Front Panel Sample2
Front Panel Sample3
Front Panel Sample4
Front Panel Sample5
Block Diagram
• Enable Show subVI names when dropped. This causes names of subVIs to b
e shown in a label on top of the subVI icon (block). A subVI is a LabVIEW sub
program which can be used as a function in the parent program to perform a
specific task.
• Disable the Enable auto wiring option. This prevents LabVIEW from automatic
ally connecting adjacent blocks. Although it seems useful to have auto wiring
enables, it is my experience that the auto wiring is a little annoying since it ten
ds to draw wires between blocks when you do not want any wire.
• Disable Place front panel elements as icons. This causes LabVIEW to use sm
all terminal icons on the block diagram. If you, in stead, activate this option, th
e terminal icons are larger, with a mimic of the element as it appears at the fro
nt panel. The figure below shows the difference.
Block Diagram
Wire
Data
Graph
Terminal
Sub VI
While Loop
Structure
Block Dia
gram Tool
bar
Divide
Function
Numeric
Constant
Timing
Function
Boolean Control
Terminal
Block Diagram Sample1
Front Panel + Block Diagram
Block Diagram Sample2
Front Panel + Block Diagram
Block Diagram Sample3
Front Panel
Front panel
Control Palette
contains inputs and outputs
find: right click front panel
Block Diagram
Functions Palette
contains elements for programming
Find: right click
Status Toolbar
Running the VI
• The Run button is used to start the VI. This button becomes white when the VI is not running, and
black when it is running. If the VI contains errors, the VI does not start, and the Run button is grey
and broken.
• The Run Continuously button is used only for testing purposes when you want to run the VI over
and over again. It works as when you continuously click the Run button after the VI has stopped. (
Unfortunately many users erroneously clicks the Run Continuously button to run the VI in normal o
perations. Actually, you need this button very seldom.)
• The Abort button is used to abort the operation of the VI. It is used for abnormal or uncontrolled s
top. Typically, the programmer will have put a specific button or switch on the front panel to provid
e for a controlled stop. In level_meas.vi there is a red stop button at the bottom of the front panel.
• The Pause button is used to pause the VI as it runs. By clicking the Pause button again the VI ru
ns again.
Data Types
String: text
Pink wires, indicators and controls
Integer: no decimal points
Blue wires, indicators and controls
Double Precision Floating Point: numbers with decimal point
Orange wires, indicators and controls
Boolean: True or false
Green wires, indicators and controls
Data Types
Scalar 1D array 2D array Color
Floating-point
number orange
Integer number blue
Boolean green
String pink
Programming
While Loop
Programming
Boolean key Bottom
Programming
Boolean LED
Programming
Connecting and Run
Example1: (Hello World!)
Example2:
Control
Terminals
Block Diagram WindowFront Panel Window
Indicator
Terminals
Example3:

Labview2_Computer Applications in Control_ACRRL