Download as PDF, PPTX
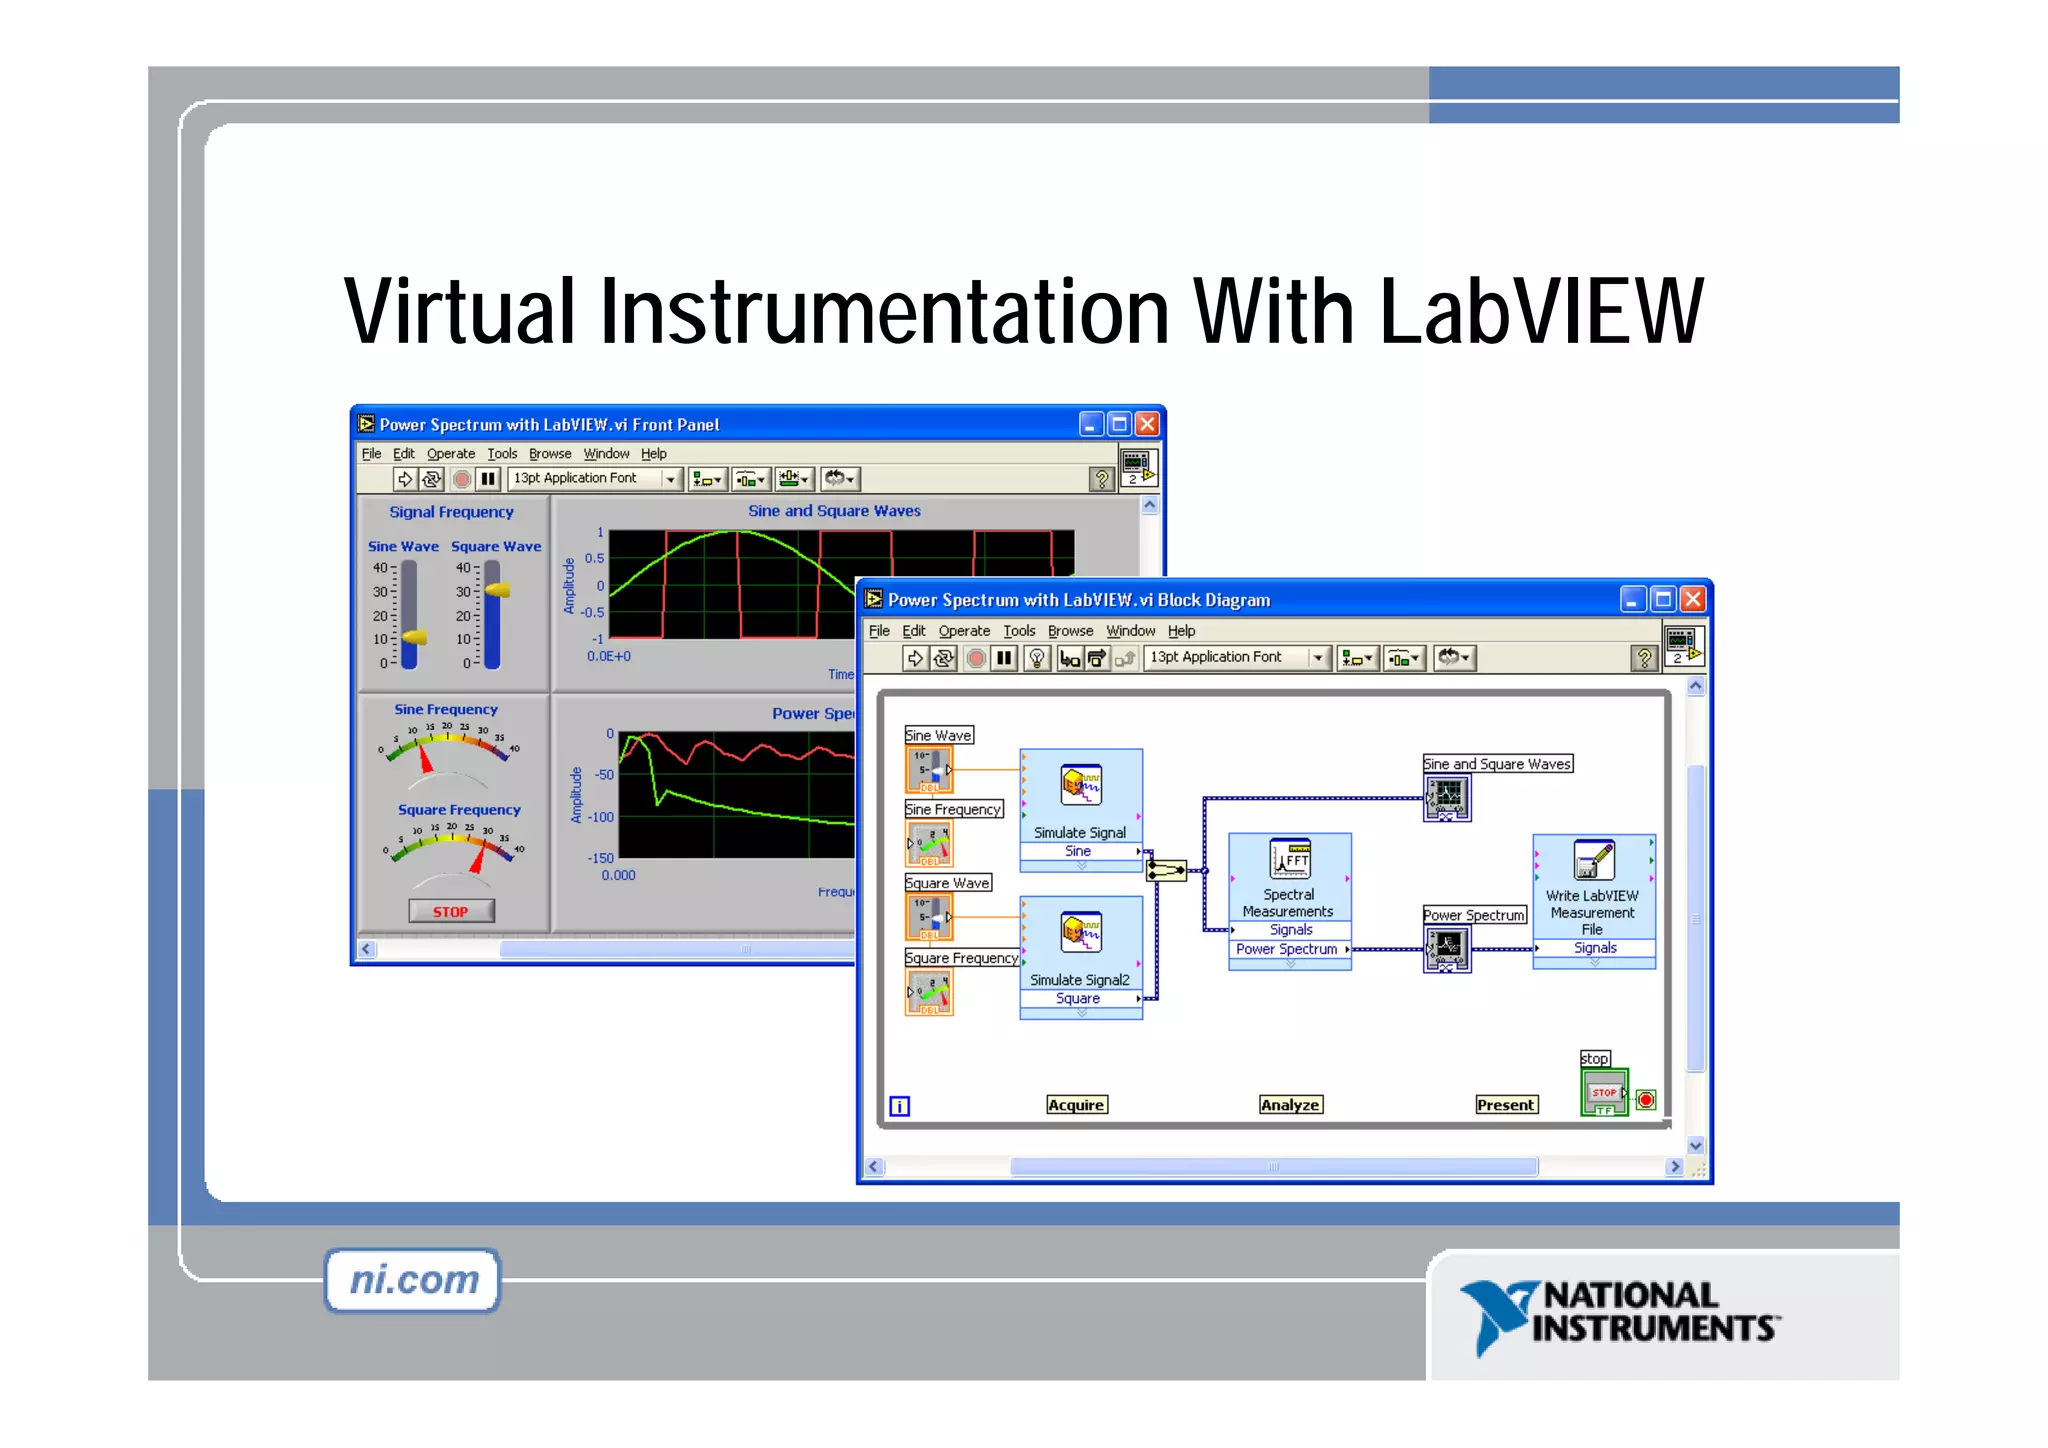
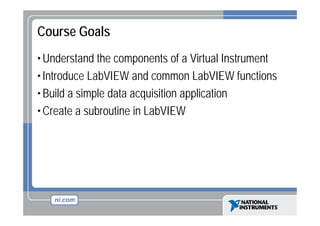
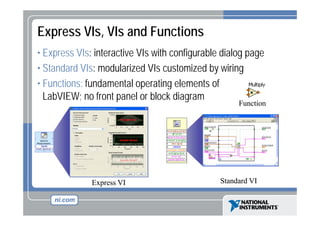
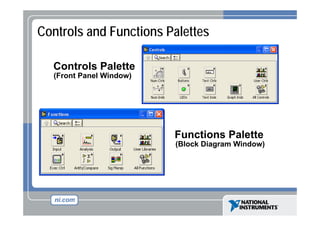
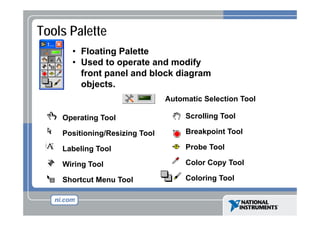
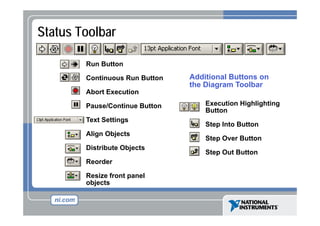
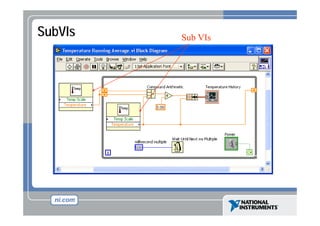
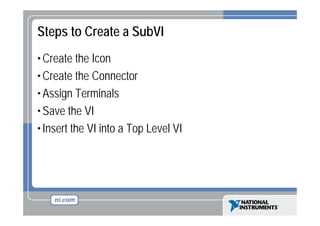
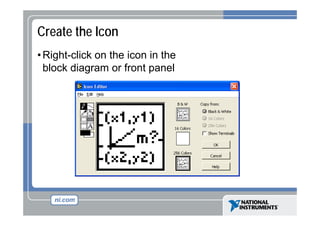
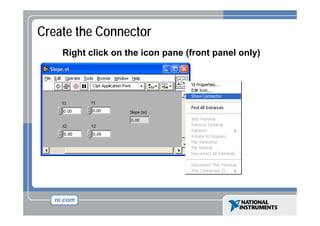
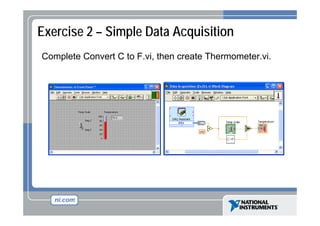
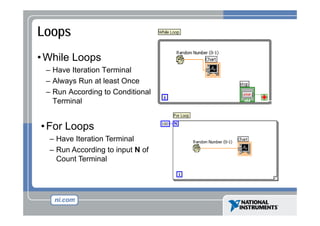
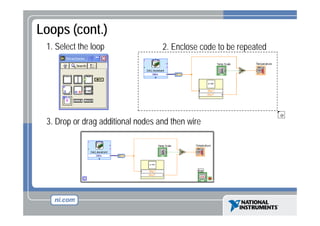

Virtual Instrumentation With LabVIEW is a course that introduces students to LabVIEW and building virtual instruments (VIs). The course covers the components of VIs, creating simple applications, using loops and charts, and performing data acquisition and file input/output. Students will understand LabVIEW programming tools and terms, build interactive front panels, use functions and structures on block diagrams, create subVIs, and log sensor data to files. Exercises include converting temperatures, making a thermometer, using loops, and building a temperature data logger.