Download to read offline
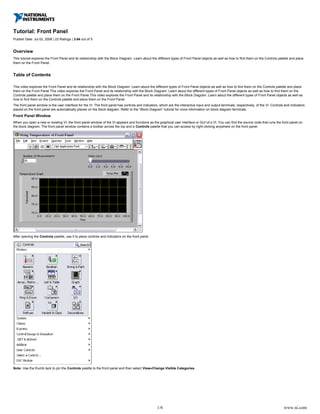
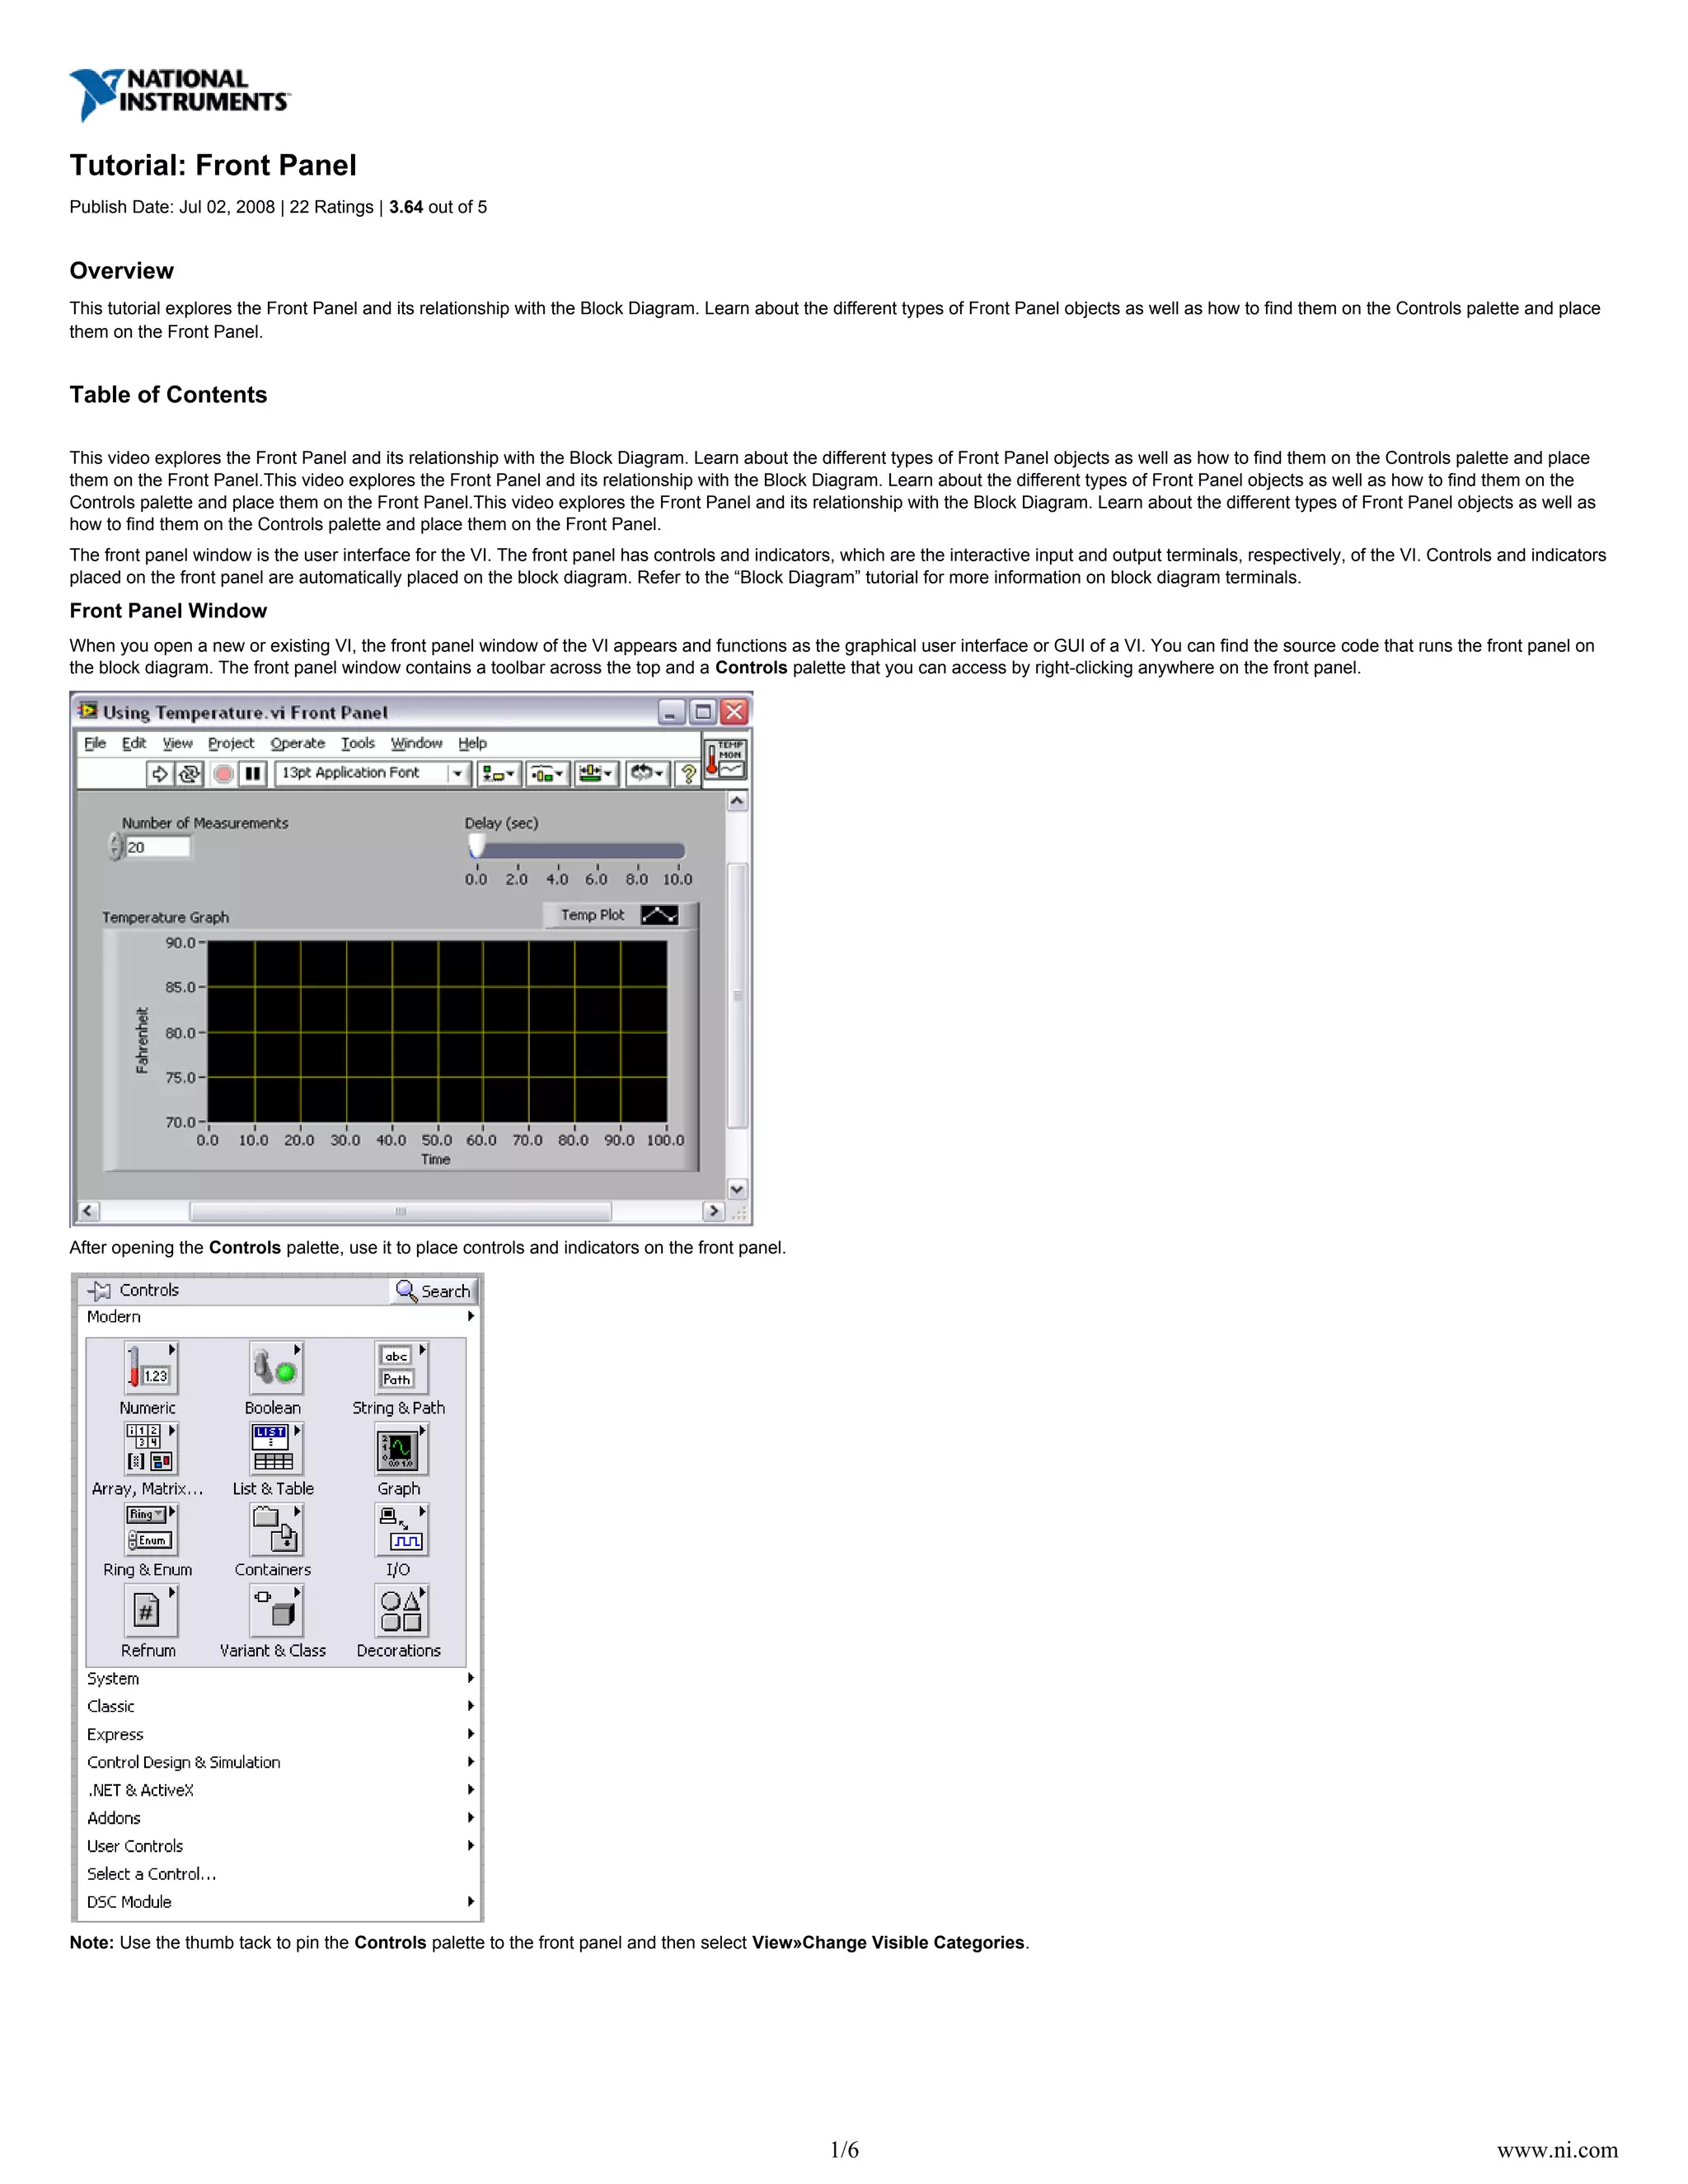
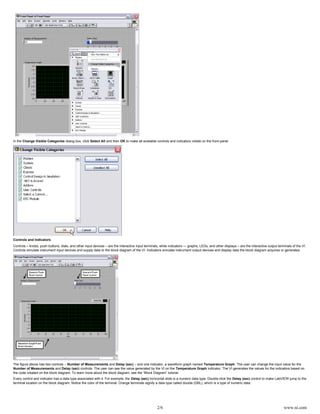
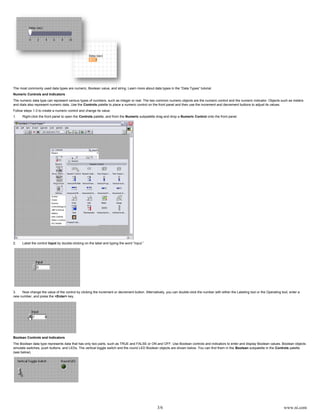


This tutorial provides an overview of the front panel in LabVIEW, detailing its role as the graphical user interface for virtual instruments (VIs). It discusses the types of controls and indicators, their functionalities, and how they interact with the block diagram. Additionally, it highlights the creation and modification of front panel objects, as well as important toolbar functionalities for running and editing VIs.