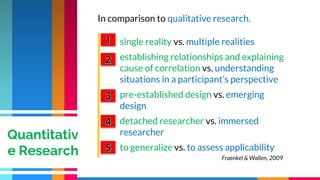
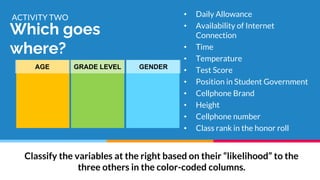
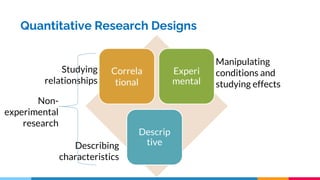
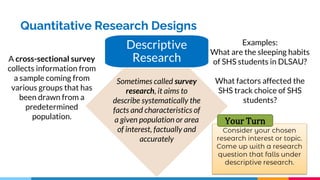
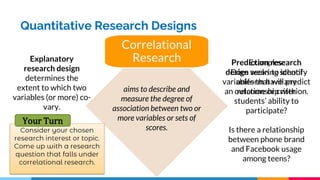
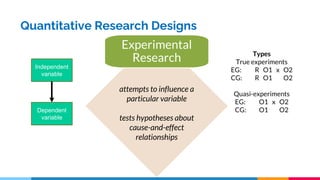
The Nature of Inquiry and
Research
Practical Research 2:
FIL L. ILAGAN
fil.Ilagan@deped.gov.ph
Our Learning Goals:
After this discussion, you are expected to have the ability to…
1. describe characteristics, strengths, and weaknesses of
quantitative research;
2. differentiate kinds of variables according to scales of measure;
and
3. contrast kinds of quantitative research.
This slideshow presentation will be made available through the trainer’s website:
mathbychua.weebly.com.
Download the document to use it as reference.
The Nature of Inquiry and Research
1. How would you define practical
research?
2. Why is it important for a SHS student
to know the process of conducting
research?
3. Give some examples of research
opportunities or topics relevant to
both your interests and your SHS
strand.
Let’s look
back…
Research is a systematic process of
collecting, analyzing, and interpreting
information in order to increase our
understanding of a phenomenon about
which we are interested or concerned
(Leedy & Ormrod, 2013).
Defining
Research
Research is a systematic and objective
creation of knowledge.
(Creswell, 2013)
works with a
system or
method
unbiased; all
angles presented
a creative
process
Defining
Research Pose a
question
Collect data
to answer
to the
question
Present
the
answer
Add to existing knowledge.
Improve practice.
Inform policies
Solve problems, not emergencies.
Why DO
RESEARCH?
single reality vs. multiple realities
establishing relationships and explaining
cause of correlation vs. understanding
situations in a participant’s perspective
pre-established design vs. emerging
design
detached researcher vs. immersed
researcher
to generalize vs. to assess applicability
In comparison to qualitative research.
Fraenkel & Wallen, 2009
Quantitativ
e Research
Quantitive Research
Its STRENGTHS and
WEAKNESSES
A variable varies and has values. The values of
variables under study are the research data.
Are these variables? color, chair, shape of table,
tweet, shirt style.
How are these different?
Quantitative and qualitative variables
Discrete and continuous variables
Variables
Which goes
where?
ACTIVITY TWO • Daily Allowance
• Availability of Internet
Connection
• Time
• Temperature
• Test Score
• Position in Student Government
• Cellphone Brand
• Height
• Cellphone number
• Class rank in the honor roll
AGE GRADE LEVEL GENDER
Classify the variables at the right based on their “likelihood” to the
three others in the color-coded columns.
IDENTITY MAGNITUDE
EQUAL
INTERVALS
ABSOLUTE ZERO
A variable varies and has values. The values of
variables under study are the research data.
Are these variables? chair, shape of table, tweet,
shirt style.
RATIO
INTERVAL
ORDINAL
NOMINAL
Classifying Variables
according to Scales of
Measure
Variables
Quantitative Research Designs
Studying
relationships
Describing
characteristics
Manipulating
conditions and
studying effects
Correla
tional
Experi
mental
Descrip
tive
Non-
experimental
research
Quantitative Research Designs
Descriptive
Research
Sometimes called survey
research, it aims to
describe systematically the
facts and characteristics of
a given population or area
of interest, factually and
accurately
A cross-sectional survey
collects information from
a sample coming from
various groups that has
been drawn from a
predetermined
population.
Examples:
What are the sleeping habits
of SHS students in DLSAU?
What factors affected the
SHS track choice of SHS
students?
Your Turn
Quantitative Research Designs
Correlational
Research
aims to describe and
measure the degree of
association between two or
more variables or sets of
scores.
Explanatory
research design
determines the
extent to which two
variables (or more) co-
vary.
Prediction research
design seeks to identify
variables that will predict
an outcome or criterion.
Examples:
Does wearing school
uniform have any
relationship with
students’ ability to
participate?
Is there a relationship
between phone brand
and Facebook usage
among teens?
Your Turn
Quantitative Research Designs
Experimental
Research
attempts to influence a
particular variable
tests hypotheses about
cause-and-effect
relationships
Independent
variable
Dependent
variable
Types
True experiments
EG: R O1 x O2
CG: R O1 x O2
Quasi-experiments
EG: O1 x O2
CG: O1 x O2
Determine the
design
ACTIVITY ONE • Internet availability at home and student’s
average sleeping time at night
• Social media involvement and practices of
Grade 12 HUMSS students
• The effect of the use of <a local packaging
material> on the shelf life of a product.
• The marketability of <innovative
product> to SHS students.
• Children of single parents and their level
of Math anxiety.
As a group, decide on a researchable topic leading to a quantitative
research suited to the level of SHS students.

PR2 Week 1.pptx

  • 1.
    The Nature ofInquiry and Research Practical Research 2: FIL L. ILAGAN fil.Ilagan@deped.gov.ph
  • 2.
    Our Learning Goals: Afterthis discussion, you are expected to have the ability to… 1. describe characteristics, strengths, and weaknesses of quantitative research; 2. differentiate kinds of variables according to scales of measure; and 3. contrast kinds of quantitative research. This slideshow presentation will be made available through the trainer’s website: mathbychua.weebly.com. Download the document to use it as reference. The Nature of Inquiry and Research
  • 3.
    1. How wouldyou define practical research? 2. Why is it important for a SHS student to know the process of conducting research? 3. Give some examples of research opportunities or topics relevant to both your interests and your SHS strand. Let’s look back…
  • 4.
    Research is asystematic process of collecting, analyzing, and interpreting information in order to increase our understanding of a phenomenon about which we are interested or concerned (Leedy & Ormrod, 2013). Defining Research
  • 5.
    Research is asystematic and objective creation of knowledge. (Creswell, 2013) works with a system or method unbiased; all angles presented a creative process Defining Research Pose a question Collect data to answer to the question Present the answer
  • 6.
    Add to existingknowledge. Improve practice. Inform policies Solve problems, not emergencies. Why DO RESEARCH?
  • 7.
    single reality vs.multiple realities establishing relationships and explaining cause of correlation vs. understanding situations in a participant’s perspective pre-established design vs. emerging design detached researcher vs. immersed researcher to generalize vs. to assess applicability In comparison to qualitative research. Fraenkel & Wallen, 2009 Quantitativ e Research
  • 8.
  • 9.
    A variable variesand has values. The values of variables under study are the research data. Are these variables? color, chair, shape of table, tweet, shirt style. How are these different? Quantitative and qualitative variables Discrete and continuous variables Variables
  • 10.
    Which goes where? ACTIVITY TWO• Daily Allowance • Availability of Internet Connection • Time • Temperature • Test Score • Position in Student Government • Cellphone Brand • Height • Cellphone number • Class rank in the honor roll AGE GRADE LEVEL GENDER Classify the variables at the right based on their “likelihood” to the three others in the color-coded columns.
  • 11.
    IDENTITY MAGNITUDE EQUAL INTERVALS ABSOLUTE ZERO Avariable varies and has values. The values of variables under study are the research data. Are these variables? chair, shape of table, tweet, shirt style. RATIO INTERVAL ORDINAL NOMINAL Classifying Variables according to Scales of Measure Variables
  • 12.
    Quantitative Research Designs Studying relationships Describing characteristics Manipulating conditionsand studying effects Correla tional Experi mental Descrip tive Non- experimental research
  • 13.
    Quantitative Research Designs Descriptive Research Sometimescalled survey research, it aims to describe systematically the facts and characteristics of a given population or area of interest, factually and accurately A cross-sectional survey collects information from a sample coming from various groups that has been drawn from a predetermined population. Examples: What are the sleeping habits of SHS students in DLSAU? What factors affected the SHS track choice of SHS students? Your Turn
  • 14.
    Quantitative Research Designs Correlational Research aimsto describe and measure the degree of association between two or more variables or sets of scores. Explanatory research design determines the extent to which two variables (or more) co- vary. Prediction research design seeks to identify variables that will predict an outcome or criterion. Examples: Does wearing school uniform have any relationship with students’ ability to participate? Is there a relationship between phone brand and Facebook usage among teens? Your Turn
  • 15.
    Quantitative Research Designs Experimental Research attemptsto influence a particular variable tests hypotheses about cause-and-effect relationships Independent variable Dependent variable Types True experiments EG: R O1 x O2 CG: R O1 x O2 Quasi-experiments EG: O1 x O2 CG: O1 x O2
  • 16.
    Determine the design ACTIVITY ONE• Internet availability at home and student’s average sleeping time at night • Social media involvement and practices of Grade 12 HUMSS students • The effect of the use of <a local packaging material> on the shelf life of a product. • The marketability of <innovative product> to SHS students. • Children of single parents and their level of Math anxiety. As a group, decide on a researchable topic leading to a quantitative research suited to the level of SHS students.

Editor's Notes

  • #2 Good morning. T
  • #6 If you are to describe research by a single word, what word would best describe it? Research is a process in which you engage in a small set of logical steps. Research is a process of steps used to collect and analyze information to increase our understanding of a topic or issue.
  • #7 Provides data for better understanding of real-life concerns and issues, individual or group. Undertake research to contribute to existing information about issues. Through research we develop results that help to answer questions, and as we accumulate these results, we gain a deeper understanding of the problems. In this way, researchers are much like bricklayers who build a wall brick by brick, continually adding to the wall and, in the process, creating a stronger structure. When we encourage our students to immerse themselves in researches that seek to understand how they learn and what factors contribute to learning, we give them the opportunity to improve their study habits and their appreciation for improving themselves through education. Research has the ability to change the way we do things. The researches that your students will be doing can be used to review existing school policies or even generate new ones. Makes recommendations to improve existing situations or realities. Students must understand that the conduct of research takes time.
  • #8 Quantitative researchers usually base their work on the belief that facts and feelings can be separated, that the world is a single reality made up of facts that can be discovered. Qualitative researchers, on the other hand, assume that the world is made up of multiple realities, socially constructed by different individual views of the same situation. The purpose of quantitative research is basically to [READ]. Quantitative research has established widely agreed on general formulations of steps that guide researchers in their work. Qualitative researchers have a much greater flexibility in both the strategies and techniques they use and the overall research process itself. The ideal researcher role in quantitative research is that of a detached observer, whereas qualitative researchers tend to become immersed in the situations in which they do their research. quantitative researchers want to establish generalizations that transcend the immediate situation or particular setting. Qualitative researchers, on the other hand, often do not even try to generalize beyond the particular situation, but may leave it to the reader to assess applicability.
  • #9 The objectivity QNR is almost guaranteed because it seeks answers to questions supported by the analysis of quantitative data. Numbers are precise and bias-proof. In relation to that, in QNR, we are in control of the level of significance. We can account for the possibility for error. Nonprobability sampling is often employed and we can decide how accurate we want our results to be by limiting our samples. Numbers will not be able to explain everything. Sometimes the data that we get only scratches the surface and qualitative data will be needed to make meaning out of the numbers. Error can occur due to sampling, the instrument, and how the tool is administered. QNR tends to start with assumptions that it will need to validate. Because of this, results are restricted to whether the data reject or do not reject that assumption.
  • #10 Quantitative variables are those whose values are numerical. Qualitative variables are those whose values are categories, characteristics, qualities. Continuous variables are quantitative and have infinitely many values even over a limited range. Dicrete variables have limited number of values,
  • #12 Nominal scale is characterized by data that consist of names, labels, or categories only. Ordinal scale involves data that may be arranged in some order but differences between data values either cannot be determined or meaningless. Interval scale is data for which we can determine meaningful amounts of differences between data. However there is no inherent zero starting point. Ratio scale is the interval scale to include the inherent zero starting point. For these values, differences and ratios are both meaningful.
  • #15 An explanatory research design is a correlational design in which the researcher is interested in the extent to which two variables (or more) co-vary, that is, where changes in one variable are reflected in changes in the other. prediction research design is to identify variables that will predict an outcome or criterion. In this form of research, the investigator identifies one or more predictor variable and a criterion (or outcome) variable. A predictor variable is a variable used to make a forecast about an outcome in correlational research.
  • #16 In an experimental study, researchers look at the effect(s) of at least one independent variable on one or more dependent variables. The independent variable in experimental research is also frequently referred to as the experimental, or treatment, variable. The dependent variable, also known as the criterion, or outcome, variable, refers to the results or outcomes of the study. True experiments, the researcher randomly assigns participants to different conditions of the experimental variable. Quasi-experiments include assignment, but not random assignment of participants to groups. Factorial designs represent a modification of the between group design in which the researcher studies two or more categorical, independent variables, each examined at two or more levels (Vogt, 2005) A time series design consists of studying one group, over time, with multiple pretest and posttest measures or observations made by the researcher.
  • #17 Correlational Descriptive Experimental (True) Descriptive Descriptive