Download to read offline
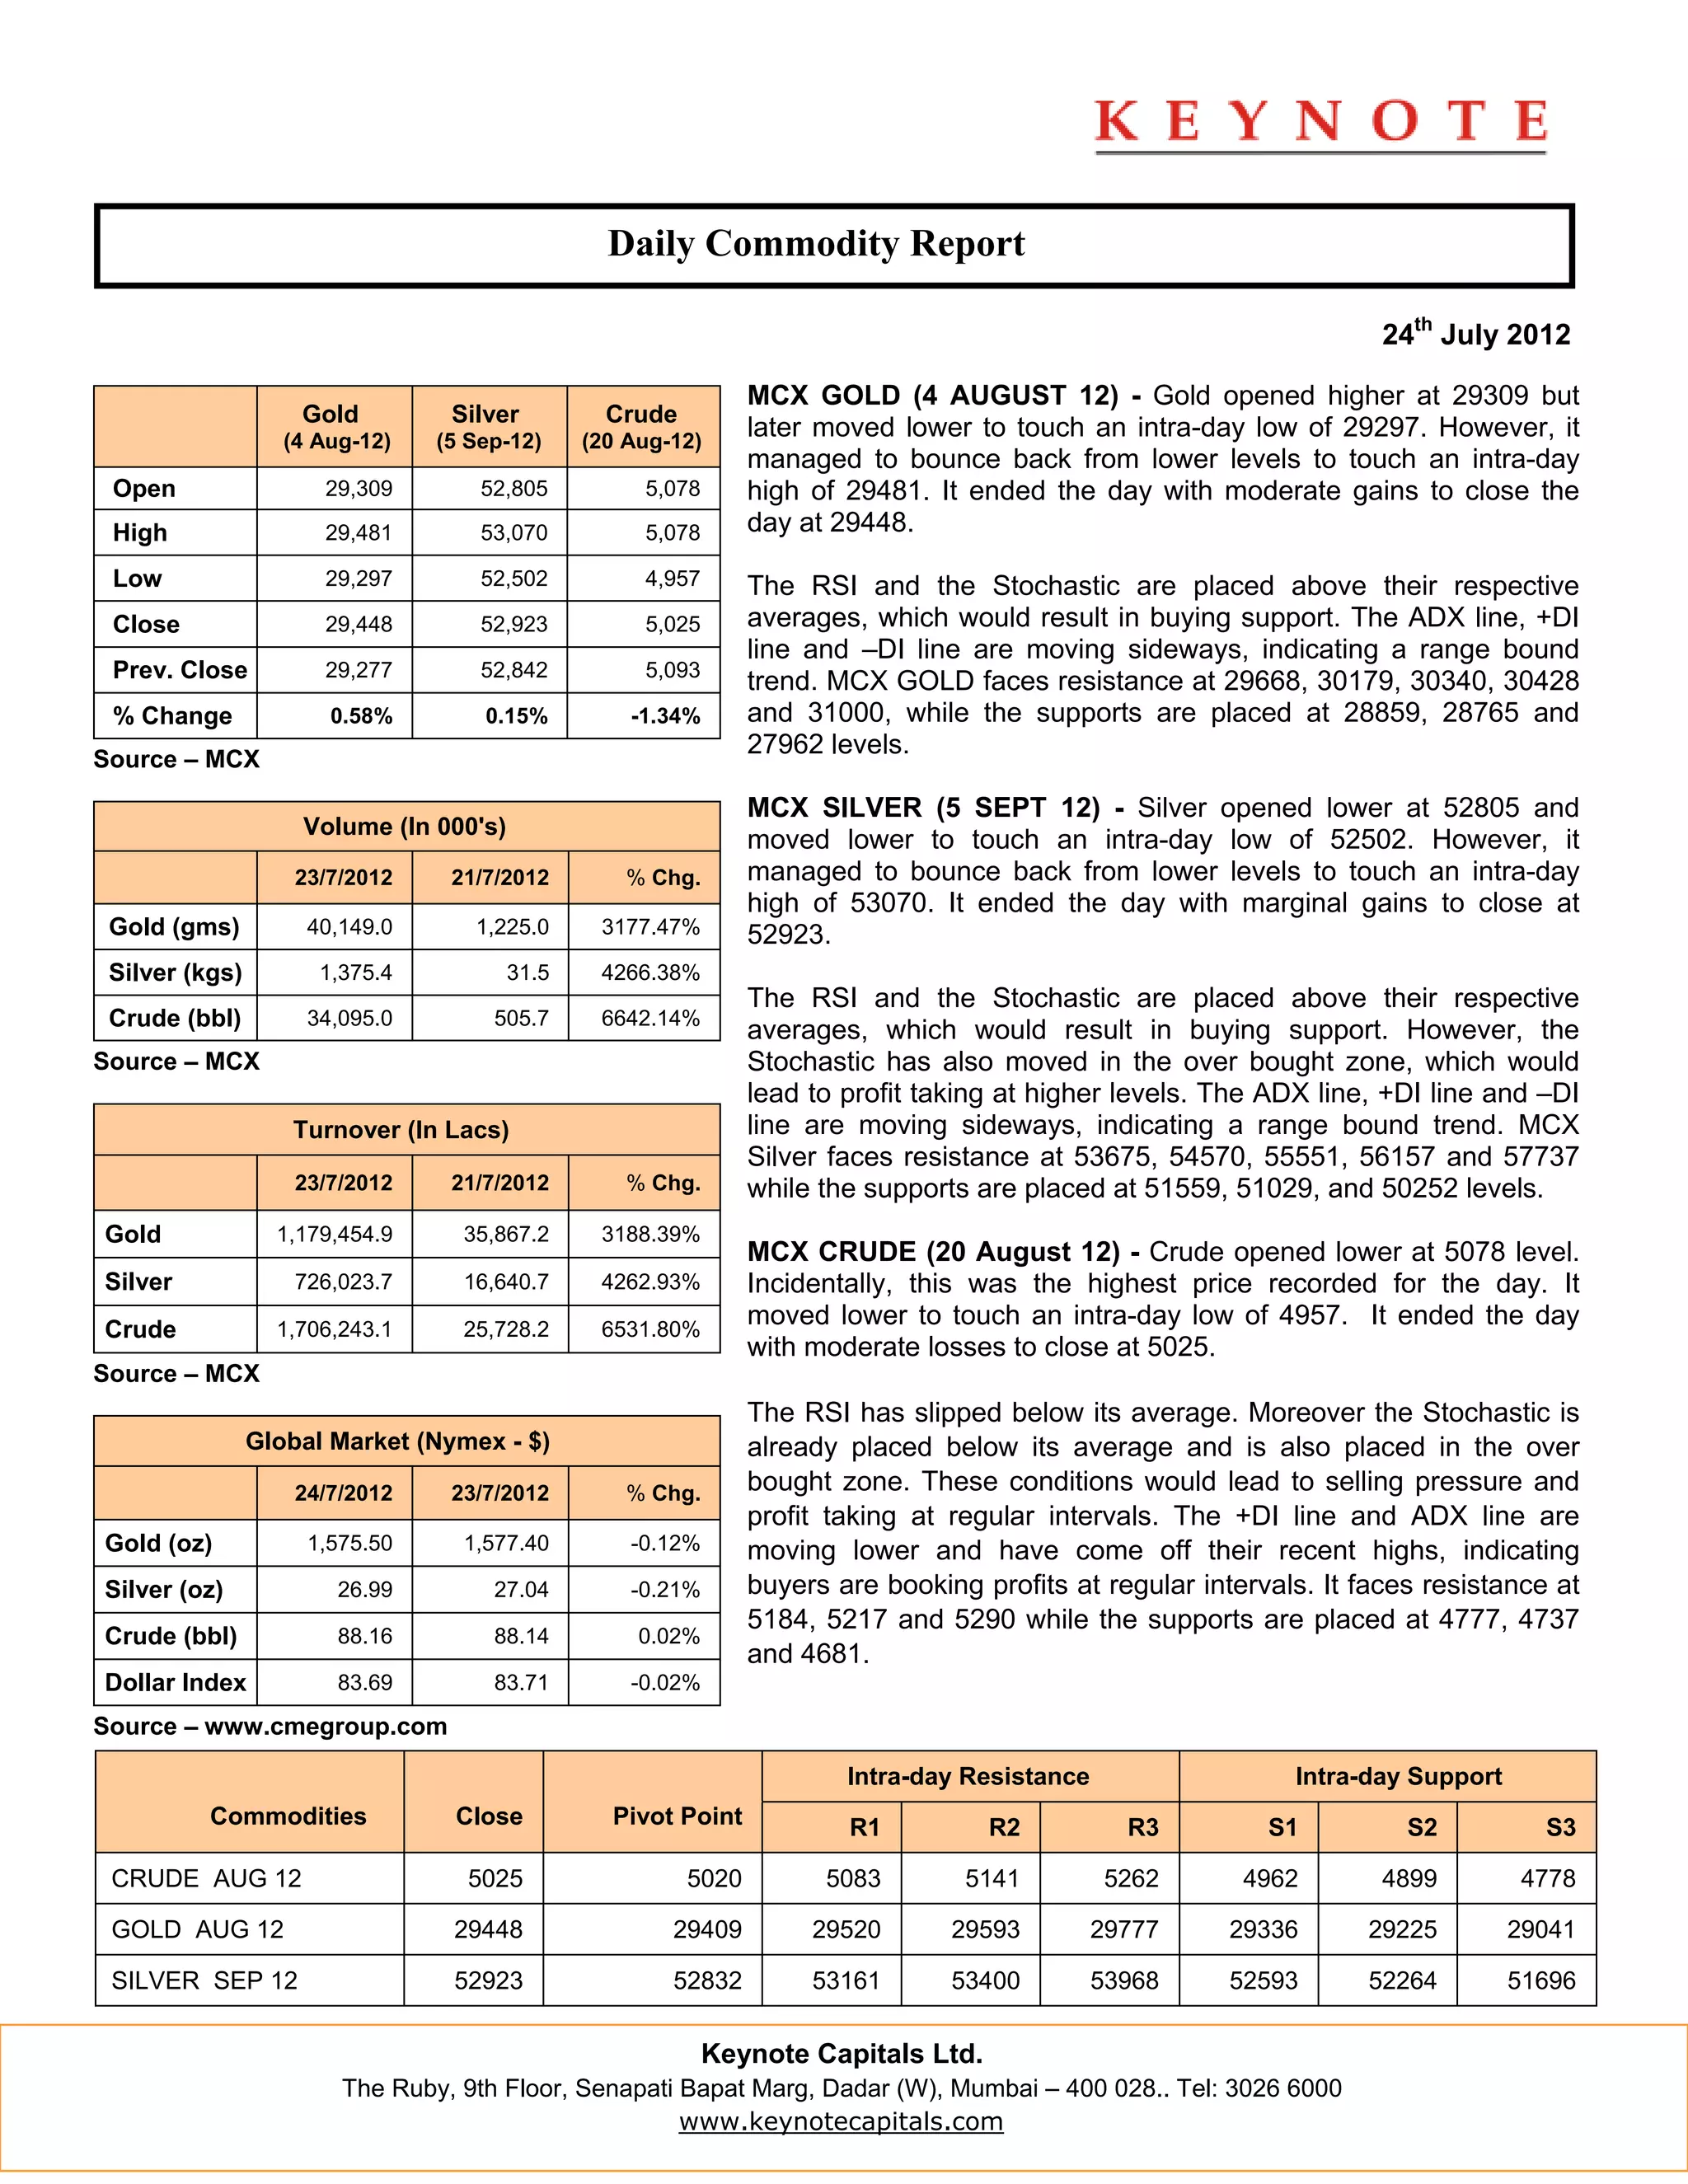

- The daily commodity report summarizes prices and trends for gold, silver, and crude on the MCX exchange for July 24, 2012. - Gold prices opened higher but fell intraday before closing with moderate gains. Silver opened lower but recovered to close with marginal gains. Crude opened lower and closed with moderate losses. - Technical indicators like the RSI and stochastic showed buying support for gold and silver but were positioned for potential profit taking in silver. Crude's technicals pointed to selling pressure.


