- The daily commodity report provides closing prices and analysis for gold, silver, crude oil, and other commodities on the MCX exchange.
- Gold and silver prices closed slightly higher while crude oil saw modest gains. Technical indicators show most commodities are in a range-bound trend.
- Resistance and support levels are identified for different expiration dates. The report also includes economic calendar updates and commodity news.
- Gold, silver, and crude oil prices moved higher today before closing with marginal losses or gains.
- The technical indicators show most commodities are in a range-bound trend. Resistance and support levels are provided.
- A sell recommendation is given for MCX crude oil based on technical analysis.
- Economic data releases are listed for the coming days from India, US, UK, Eurozone, and China that may impact commodity prices.
- The daily commodity report summarizes movements in gold, silver, and crude prices on the MCX exchange on January 9th, 2013.
- Gold prices opened lower but rose intraday before ending with moderate losses. Silver and crude also saw intraday highs but closed lower.
- Technical indicators like the RSI and Stochastic were providing mixed signals for further direction. The report provides resistance and support price levels for the different commodities.
The daily commodity report summarizes prices and trends for gold, silver, and crude oil futures on the MCX exchange in India. Gold prices opened lower but gained modestly to close higher. Silver opened lower and gained moderately to close higher. Crude oil opened higher but saw limited movement to close modestly higher. The report provides technical analysis for each commodity and notes recent global market prices and economic news that may impact commodities.
- The daily commodity report summarizes prices and trading activity for gold, silver, crude oil, and other commodities on the MCX exchange in India.
- On February 11th, prices for gold, silver, and crude oil all declined slightly except for crude oil which rose 1.49%. Trading volumes increased substantially across commodities compared to the previous day.
- Technical indicators show selling pressure for gold and silver, while crude oil technicals suggest a range-bound trend and potential for further buying. The report provides resistance and support price levels for each commodity.
- Gold prices opened higher but fell to an intra-day low before recovering slightly to close with modest gains. Silver and crude oil also opened higher but closed with moderate gains and losses respectively.
- Technical indicators for gold and silver suggest a range-bound trend, while crude oil's indicators point to selling pressure. Positional advice is given to sell MCX crude oil below 5106.
- In commodity news, rice farmers in Bihar and eastern UP are forced to sell below the minimum support price due to lack of state intervention. Gold halted its three-day decline as the weaker dollar increased demand.
Gold and silver prices were higher at the beginning of the day but closed with modest gains and losses, respectively. Crude oil prices were higher and closed with marginal losses. The RSI and stochastic indicators for gold and crude oil signal support for prices, while those for silver signal selling pressure. Commodity markets face resistance and support at various price levels detailed in the report. The Cabinet approved an increase in MSP for copra.
- The daily commodity report summarizes the performance of gold, silver, and crude oil on the MCX exchange on February 7th, 2013.
- Gold prices closed slightly higher at 30711 after falling to an intra-day low of 30565. Silver prices closed flat at 58376 after falling to 58076 intra-day. Crude oil prices closed marginally lower at 5139 after touching an intra-day low of 5070.
- Technical indicators for gold, silver, and crude oil suggest range-bound trading in the near future.
The daily commodity report summarizes prices and trends for gold, silver, and crude oil on the MCX exchange in India. Gold and silver prices saw marginal gains while crude oil closed slightly higher. Technical indicators show most commodities are in a range-bound trend. The report also provides global market prices and commentary on commodity news including increased coconut oil exports from India and falling premiums for arabica coffee.
The daily commodity report summarizes movements in gold, silver, and crude oil futures on the MCX exchange. It notes that gold and silver closed slightly lower while crude oil closed flat. The technical indicators for all three commodities show selling pressure, with signs of short-term short covering. Resistance and support levels are provided. The report also includes commodity news, economic calendar items, and a disclaimer.
The daily commodity report summarizes prices and trends in gold, silver, and crude oil futures on the MCX exchange in India on January 31st, 2013. Gold and silver prices declined over 1% and 2% respectively, while crude oil fell slightly. Technical indicators suggest selling pressure on metals but prices may find support at lower levels. Crude oil faced a range-bound trend. The report provides resistance and support price levels for trading on February 5th and analysis of economic indicators and commodity news.
The daily commodity report summarizes the performance of gold, silver, crude oil, and other commodities. On January 11th, gold prices opened lower but gained modestly to close higher. Silver opened higher but fell during the day before closing with moderate gains. Crude oil opened higher and maintained gains to close above its opening price. Technical indicators suggest potential buying support for gold and silver, and mixed signals for crude oil.
- Gold and silver prices rose on the domestic market due to higher global prices and increased demand from investors and stockists. Crude oil stabilized below $112 per barrel due to optimism around the Eurozone economy and increased US consumer spending.
- On the commodities markets, MCX gold ended higher at 30869 after fluctuating during the day between 30737 and 30887. MCX silver closed at 59459 after moving between 58853 and 59580. MCX crude oil finished at 5131 after reaching an intra-day low of 5105 and high of 5148.
- Technical indicators for gold, silver and crude oil showed mixed signals of range-bound trading in the near term with supports and resist
The daily commodity report recaps the movement of gold, silver, and crude prices on the MCX exchange. Gold and crude prices closed nearly flat, while silver closed with moderate losses. Technical indicators suggest sellers are covering positions at lower price levels for gold and silver. Crude is supported by positive technical indicators. The report also provides international commodity prices and highlights recent news about changes to sugar regulations in India and gold import trends.
- Gold and silver prices were mostly flat while crude oil prices rose slightly.
- Technical indicators pointed to potential downward pressure on gold and silver but continued buying support for crude oil.
- The report provided resistance and support price levels for gold, silver, and crude futures contracts.
- The daily commodity report summarizes prices and trading activity for gold, silver, and crude oil on the MCX exchange on February 16th, 2013.
- Gold prices opened higher but fell to an intraday low before closing with small gains. Silver and crude oil closed near their opening prices with small losses and gains respectively.
- Technical indicators like the RSI and Stochastic showed selling pressure across commodities, but signs of oversold conditions that could lead to short-term rebounds.
The daily commodity report summarizes movements in gold, silver, and crude oil futures on the MCX exchange. It notes that gold and silver prices closed slightly higher while crude oil closed lower. The technical indicators point to a range-bound trend for all three commodities. The report also provides opening, high, low, and closing prices as well as previous day's close, percentage change, volumes and turnover.
Gold and silver prices rose for the third consecutive day due to festive season buying. Gold closed up 0.09% at Rs. 31,287 while silver ended down 0.05% at Rs. 59,841. Crude oil closed slightly up at Rs. 4,914 after touching an intra-day high of Rs. 4,921. Technical indicators show gold and crude in a range-bound trend while silver faces selling pressure. The report recommends buying gold at Rs. 31375 with a target of Rs. 32,100.
This document summarizes the daily commodity report from MCX for June 14th, 2012. It provides opening, high, low, and closing prices for gold, silver, and crude on that date. It also includes intraday resistance and support levels as well as analysis of indicators like RSI and stochastic. The report concludes with comments on US economic calendar events and a disclaimer.
- Gold and silver futures fell on the MCX on December 20th due to year-end selling pressure. Crude oil futures rose slightly.
- On the daily commodity report, gold faced resistance at 30,758, 30,837 and 30,916 levels, while support was at 30,475, 30,366 and 30,150. Silver faced resistance at 59,483, 61,484 and 63,224, and support at 57,049, 56,372 and 55,952. Crude oil was recommended as a buy above 4950 with a target of 5125.
- In commodity news, gold hit a near 4-month low due to selling pressure at year-end. Pepper futures
- Gold, silver, and crude oil prices fell on the commodity market while the dollar index was mostly flat.
- Brent oil rose above $109 due to expectations that the U.S. budget crisis will be resolved, avoiding a recession.
- The report provides an analysis of movements in gold, silver, and crude oil prices and makes buy/sell recommendations.
The daily commodity report summarizes prices and trading activity for gold, silver, and crude oil on the MCX exchange from September 4th, 2012. Gold prices fell slightly while silver and crude oil saw modest gains. Technical indicators show markets remain in overbought territory, suggesting continued profit taking. The report also provides commentary on commodity price movements and economic news affecting markets.
The document provides a daily commodity report for gold, silver, and crude on the MCX for October 17th, 2012. It summarizes the opening, high, low, and closing prices for each commodity. It also analyzes the technical indicators for each commodity and identifies resistance and support levels. Positional calls with targets and stop losses are provided recommending selling gold and silver futures. Commodity news on Brent oil and Indian spices are also mentioned. An economic calendar outlines upcoming economic data releases.
- The daily commodity report summarizes the movement and closing prices of gold, silver, and crude on the MCX exchange on March 12, 2012.
- Gold closed flat at 27,982 after touching an intraday high of 28,020 and low of 27,974. Silver and crude both closed with modest losses.
- Technical indicators like RSI, stochastic, and ADX are discussed and resistance and support levels are provided for intraday trading over the next few days.
The daily commodity report summarizes prices and trends for gold, silver, and crude oil futures on the MCX exchange from September 25, 2012. Gold prices opened lower and fell further before rebounding to close slightly down. Silver also opened lower and fell to an intraday low before closing with moderate losses. Crude oil opened lower as well and declined to its lowest price of the day before closing with moderate losses. Technical indicators suggest prices may be range-bound with potential for short-term rebounds.
The daily commodity report summarizes prices and trading activity for gold, silver, and crude oil on the MCX exchange in India on February 25th, 2013. Gold prices were largely flat, opening lower but closing near the opening price, while silver saw modest gains and crude oil saw modest losses. Trading volumes increased significantly compared to the previous day for all three commodities. Technical indicators pointed to potential short-term buying or short covering for gold and silver at lower price levels.
- Gold prices opened higher but failed to sustain gains and closed marginally up, while silver and crude oil closed nearly unchanged.
- Technical indicators for gold, silver, and crude oil show most are range-bound in the near term with potential for intermittent bouts of buying and selling.
- The report provides opening, closing, high, low and volume data for various commodities, along with analysis of technical indicators and resistance/support levels.
The document provides the intra-day technical levels for various companies trading on the National Stock Exchange of India (NSE) for January 10, 2013. It includes the previous day's closing price, intra-day pivot points, resistance and support levels for each stock. The pivot point, resistance and support levels are used to analyze the trend and potential trading zones for the day.
This document provides the intra-day technical levels for various stocks trading on the National Stock Exchange of India on February 21, 2013. It identifies the previous day's closing price, intra-day pivot point, and potential resistance and support levels for over 50 companies. The levels are meant to indicate areas where prices may pause or reverse direction during the trading day.
The domestic stock markets opened firmly but struggled to sustain gains. The markets witnessed some profit taking but recovered to end the day with small gains. Technically, indicators are mostly positive but follow through buying is lacking. The markets may see volatility as the Nifty struggles to stay above 5,300. Support and resistance levels for the Nifty are provided.
The document provides intra-day technical levels for various companies trading on the stock market on 17/05/12. It lists the company name, previous day's closing price, pivot point, and resistance and support levels for intra-day trading. The levels are meant to indicate price points where buying or selling pressure may increase for the stock during the trading day.
Gold opened lower but bounced back to close modestly higher. Technical indicators suggest continued buying support. Resistance levels are at 30179, 30340, and 31000, with support at 29968, 29859, and 28765. The report recommends buying gold around 29950 with a stop loss of 29800 and target of 30200.
Silver opened higher but failed to sustain gains and closed marginally higher. Technical signals suggest a range bound trend. Resistance is at 53675, 54570, and 55551, with support at 51559, 511029, and 50252. The report recommends buying silver around 53370 with a stop loss of 53080 and target of 54000.
Crude
The document provides an overview of the performance of domestic and global markets, noting that Indian shares rose for a fifth consecutive session on hopes for fiscal reforms. It discusses key stock market indexes and company news, as well as commenting on positive sentiment in Asian markets and an expected positive opening for Indian markets. Economic data and corporate developments are also briefly mentioned.
The document provides intra-day technical levels for various stocks for August 16, 2012. It lists the closing price from August 14, the pivot point, and resistance and support levels for each stock. The levels are meant to indicate price points where the stocks may face resistance (R1, R2, R3) or find support (S1, S2, S3) during trading on August 16.
- The daily commodity report summarizes prices and trends for gold, silver, and crude on the MCX exchange for July 24, 2012.
- Gold prices opened higher but fell intraday before closing with moderate gains. Silver opened lower but recovered to close with marginal gains. Crude opened lower and closed with moderate losses.
- Technical indicators like the RSI and stochastic showed buying support for gold and silver but were positioned for potential profit taking in silver. Crude's technicals pointed to selling pressure.
The daily commodity report summarizes prices and trading activity for gold, silver, and crude oil on the MCX exchange. Gold prices opened lower but recovered slightly, closing with modest losses. Silver opened lower and fell further but also recovered, closing with marginal losses. Crude oil opened higher but then fell and rebounded, closing with moderate gains. The report provides technical analysis and resistance/support levels for each commodity.
The document provides an outlook on currency and indices option trades for February and March 2013. It recommends several bullish and bearish option trades on specific stocks and indices. It also includes a ready reckoner that introduces various option strategies like long calls/puts, spreads, butterflies, calendars and discusses risk management techniques.
The document provides intra-day technical levels for various companies trading on the stock market on August 22, 2012. It lists the closing price from the previous day, pivot points, and resistance and support levels for each stock. The levels can be used to identify potential price targets both above and below the pivot point during the trading day.
The document provides the intra-day technical levels for various stocks trading on the National Stock Exchange of India (NSE) on February 11, 2013. It lists the closing price, intra-day pivot point, resistance levels (R1-R3) and support levels (S1-S3) for over 50 companies. The pivot point is the average of the previous day's high, low and close which is used to determine near-term direction. Resistance levels above the pivot point and support levels below it are also given to indicate price targets and support zones on intra-day price movements.
The daily commodity report summarizes prices and trading activity for gold, silver, and crude oil futures on the MCX exchange. On February 12th, gold and silver prices closed slightly lower while crude oil closed higher. Technical indicators show selling pressure on gold and silver but buying support for crude oil. The report also provides volumes, turnover and closing prices for the previous day on MCX as well as international prices on COMEX.
- The daily commodity report summarizes movements in gold, silver, crude oil, and other commodities on the MCX exchange on January 2nd, 2013.
- Gold and silver prices opened lower but recovered to close with small gains of 0.09%. Crude oil opened higher and closed up 0.32%.
- Technical indicators for gold, silver, and crude oil show buying support, although crude may see profit taking due to being in overbought territory. Positional advice is given to buy crude oil futures above 4950 level.
Gold and crude oil prices dipped slightly while silver fell more sharply. The daily commodity report analyzes movements in gold, silver, and crude oil futures contracts on the MCX exchange and provides technical analysis of trends, resistance and support levels. Analyst Sanjay Bhatia predicts gold will face resistance at 30150 and support at 30000, while silver may encounter resistance at 59483 and support at 57049. Crude oil is expected to meet resistance at 5300 and support at 5157. The report also includes commodity news briefs and an economic calendar of upcoming major economic data releases.
Daily commodity report for October 16th, 2012. Gold, silver and crude oil futures closed lower due to selling pressure from technical indicators being placed below their averages. Gold faces resistance at multiple levels up to 32421 and support down to 28859. Silver faces resistance up to 64600 and support down to 53621. Crude oil faces resistance at 5050 and support down to 4467. The report also provides commodity news, economic calendar and disclaimer.
The daily commodity report summarizes prices and trading activity for gold, silver, and crude oil futures on the MCX exchange in India. On February 27th, gold and silver prices closed lower by 1.16% and 1.46% respectively, while crude oil closed lower by 0.42%. Trading volumes declined significantly across all three commodities compared to the previous day. Technical indicators show buying support for gold and silver but strengthening sellers for crude oil. Key support and resistance price levels are provided.
- The document summarizes the daily performance of gold, silver and crude oil futures contracts on the MCX exchange on November 7th, 2012.
- Gold futures closed up 1.23% at Rs. 31,273 per 10 grams. Silver futures rose 2.28% to Rs. 59,910 per kg. Crude oil futures gained 2.77% to settle at Rs. 4,794 per barrel.
- Technical indicators for gold, silver and crude oil futures suggest buying momentum as the Relative Strength Index and stochastic indicators moved above their averages.
The document is a daily commodity report that provides an overview of gold, silver, and crude oil futures on the MCX exchange on November 8th, 2012. It summarizes the opening, high, low, and closing prices. It also analyzes technical indicators and identifies resistance and support levels. Crude oil futures dropped over 3% due to concerns that rising US inventories and the Greek debt crisis may weaken demand. Gold and silver futures ended the day with small losses, but technical indicators still signal buying support.
Gold and silver prices fell over 1% while crude oil declined nearly 2% on February 20th. Most commodities ended the day lower with losses as metals faced selling pressure and crude oil dropped due to signs of economic recovery reducing safe haven demand. The report provides technical analysis indicating further downside potential in the short-term for commodities.
The daily commodity report summarizes prices and trading activity for gold, silver, and crude oil futures contracts. On December 20th, gold and silver prices fell while crude oil prices rose slightly. Gold futures fell 1.09% to close at $30,482 per ounce. Silver futures dropped 3.78% to close at $57,351 per kilogram. Crude oil futures increased 0.61% to close at $4,977 per barrel. Trading volumes declined for gold and crude oil but increased sharply for silver. The report provides technical analysis for near-term futures contracts and identifies support and resistance price levels.
- The daily commodity report summarizes prices and trading activity for gold, silver, crude oil, and other commodities on the MCX exchange on January 3rd, 2013.
- Gold and silver prices closed modestly lower while crude oil prices closed with moderate gains. Trading volumes declined significantly compared to the previous day.
- Technical indicators show buying support for gold, silver and crude oil but also the potential for profit taking, as indicators are in overbought zones for some commodities. The report provides resistance and support price levels.
Gold opened higher but ended the day with modest gains, closing at 30,947. Silver also opened higher and closed higher at 57,508. Crude opened unchanged but closed lower at 5,354. Technical indicators for gold and silver show buying support but both metals remain in overbought zones, which could lead to profit taking. Technical indicators for crude show a range-bound trend. The report provides closing prices and levels of resistance and support for gold, silver, and crude futures contracts.
- Gold, silver and crude oil prices increased slightly on the day, with gold up 0.41%, silver up 1.22% and crude oil up 0.18%.
- Technical indicators for gold, silver and crude oil were positive, suggesting buying support. Resistance and support levels for each commodity are given.
- Positional call was given to buy MCX crude oil above 4950 with a target of 5125 and stop loss of 4871.
This daily commodity report summarizes prices and trends for gold, silver, and crude oil futures on the MCX exchange for September 25, 2012. Gold prices opened lower and fell further before rebounding, closing slightly down. Technical indicators suggest a range-bound trend and identify support and resistance levels. Silver opened lower near its high price and closed moderately down. Crude oil opened lower near its high, fell further, and closed moderately down. Technical analysis provided for each commodity. The report also includes commodity news briefs and an economic calendar.
Gold, silver, and crude oil futures prices from the MCX exchange on October 4th are reported. Gold opened higher but ended the day lower. Silver also opened higher but closed modestly lower. Crude oil opened lower but closed with moderate gains. Technical indicators for all three commodities suggest selling pressure, though crude oil and silver are in oversold zones, which may lead to short-covering. Resistance and support price levels are provided. Global commodity prices and economic news and events from India, the US, and globally are also summarized.
Gold and silver prices rose slightly on May 31st while crude oil fell. Gold opened lower but bounced back to close up 0.89% near 29,117. Silver also opened lower but gained 0.96% to close at 54,483. Crude opened higher but then fell, closing down 2.65% at 4,962. Technical indicators were mixed, suggesting prices may remain range-bound in the near future. Support and resistance levels are provided for gold, silver, and crude on MCX.
Gold and silver prices rose on global cues, while crude oil ended flat. Technically, gold and silver are overbought and may see profit taking, while crude is range-bound. Positional calls are made to sell gold and silver futures at current levels with identified targets and stop losses. The economic calendar highlights inflation and production data from major economies.
The document provides a daily commodity report for gold, silver, and crude oil futures contracts trading on the MCX exchange in India on October 15, 2012. It summarizes the opening, high, low, and closing prices for each commodity. It also analyzes technical indicators and identifies resistance and support levels. Additionally, it provides commentary on copper and global commodity prices, as well as an economic calendar for upcoming economic data releases.
Similar to Keynote commodity daily report for 140113 (18)
The domestic stock markets opened lower but bounced back to close flat, supported by the 200-day simple moving average. The Nifty closed slightly higher but technical indicators remain negative, suggesting further bouts of selling pressure. Key support levels are at 5624, 5571 and 5447, while resistance levels are at 5747, 5816 and 5885. Stocks such as Adani Ports, HDFC, and HUL are recommended for watching.
The document provides intra-day technical levels for currency futures contracts for various dates. It includes the previous day's close price, intra-day trend, pivot point, and resistance and support levels. The pivot point is used as a trigger for intra-day buy/sell decisions. Resistance levels above and support levels below the pivot point are also provided. The document advises using the pivot point as a stop loss level and taking successive profit targets at the resistance and support levels.
The document provides daily derivatives outlook and recommends several bullish and bearish positional option trades on indices and stocks. It recommends short strangle trades on Nifty, Bank Nifty and USD/INR based on highest call and put open interest levels. It also recommends bullish call option trades on specific stocks like Hindustan Unilever, Ranbaxy, ITC, HDFC and Titan. Bearish put option trades are recommended on stocks like Reliance, Tata Steel, Reliance Power, DLF, Hero Motors.
The key Indian stock indices closed slightly higher, recovering from a seven-day losing streak. The Sensex closed up 0.12% and the Nifty closed up 0.14%. Midcap and small cap shares continued declining with lack of buying support. Shares of Jet Airways and SpiceJet fell on concerns of increased competition from a new AirAsia India joint venture. GAIL shares fell on reports of delays to a gas pipeline project in Tamil Nadu. Overall, six sectors closed lower while seven closed higher. FIIs were net buyers of Indian stocks while domestic institutions were net sellers.
The document provides the intra-day technical levels for various stocks trading on the NSE for March 28, 2013, the day of monthly futures and options expiry. It lists the closing price of each stock from March 26, the intra-day pivot point, and resistance and support levels (R1-R3 and S1-S3). The levels are expected to act as upside and downside barriers for price movement during the trading session.
The document provides intra-day technical levels for various commodities futures contracts traded on the MCX commodity exchange in India. It lists the commodity, contract expiry date, previous day's close price, intra-day trend, pivot point, and resistance and support levels for each commodity contract. The levels are used to analyze the commodity's intra-day price movement and determine potential resistance and support areas.
The daily commodity report summarizes the movement of gold, silver, and crude prices on the MCX exchange on March 6th, 2013. Gold prices opened lower but rose intraday before closing with modest losses. Silver opened higher and peaked intraday but also closed with losses. Crude opened and closed higher with moderate gains. Technical indicators for all three commodities showed sellers were in control but covering shorts, suggesting prices may rise. Upcoming economic reports and data were also summarized.
The domestic markets witnessed negative openings and sustained selling pressure, trading with moderate losses on weak global cues. However, the markets managed to recover from the lows and end the day with modest losses near the highs, supported by short covering and selective buying. Technically, most indicators remain below their averages, signaling impending selling pressure. The markets will take cues from global factors as well as the rupee and crude oil prices.
The document provides technical analysis levels for various currency futures contracts traded on the NSE for intraday trading on March 5, 2013. It lists the pivot point, resistance and support levels for currency pairs such as EUR/INR, GBP/INR, JPY/INR and USD/INR. The pivot point is considered a trigger for intraday buy/sell decisions. Resistance levels R1, R2, R3 are above the pivot point and support levels S1, S2, S3 are below the pivot point. The analysis is meant to guide intraday traders on entry, exit and stop loss levels based on the currency pair's price action relative to the pivot point.
The document provides the intra-day technical levels for various stocks trading on the National Stock Exchange of India (NSE) on March 5, 2013. It lists the stocks, their closing prices from the previous day, identified trends (up or down), pivot points, and resistance and support levels for intra-day trading. The levels are intended to help traders identify potential highs and lows for the stocks during the trading day.
The domestic stock markets witnessed flat opening but selling pressure drove markets lower. However, markets bounced back from lower levels due to short covering and selective buying. The markets closed near the day's highs with modest gains. Technically, positive market breadth amid higher volumes supported the markets. The indices remain above key support levels. However, negative technical indicators could lead to selling pressure at higher levels. The markets will take cues from the upcoming Union Budget.
The document provides the intra-day technical levels for currency futures contracts on various dates. It includes the pivot point, which is a trigger for intra-day buy/sell decisions, and resistance and support levels (R1, R2, R3 and S1, S2, S3). The trader is advised to take a long position above the pivot point and use the pivot as the stop loss, with targets at the resistance levels; and take a short position below the pivot point, using it as the stop loss and targeting the support levels. The intra-day trend is valid until the price trades above or below the pivot point.
The document provides intra-day technical levels for various MCX commodities contracts for February 28, 2013. It lists the commodity, contract expiry date, previous day's close price, intra-day trend, pivot point, resistance and support levels. Technical analysis is used to identify levels of resistance and support for each commodity contract to determine likely price movement and trading opportunities on the given day.
This document provides a daily derivatives outlook and recommends various positional option trades. It summarizes the highest call and put open interest levels for various indices like Nifty and Bank Nifty. It recommends short-term strategies like short strangles and long-term strategies like short straddles. It also provides bullish and bearish positional stock option trades and discusses the US dollar-Indian rupee outlook.
The document provides the intra-day technical levels for various stocks trading on the National Stock Exchange of India (NSE) for February 28, 2013, the expiry date for futures and options contracts. It lists the stock name, previous day's close price, identified trend (up/down), pivot point, and potential resistance and support levels (R1, R2, R3, S1, S2, S3) for each stock based on technical analysis of recent price movements. This is intended to help traders identify potential price points where the market may reverse direction on an intra-day basis.
The domestic markets opened flat but saw selling pressure and losses, especially in mid-cap stocks due to margin funding issues. The markets recovered slightly in the afternoon on short-covering and selective buying but failed to sustain higher levels. Technically, market breadth was weak with higher volumes signaling more downside risk. Most technical indicators were below their averages, signaling impending selling pressure. However, some indicators were in oversold territory, which could lead to short-term bouts of buying at lower levels. The markets will take cues from the upcoming union budget, global markets, the rupee and crude oil prices.
- The document provides intra-day technical levels for currency futures contracts, including pivot points, resistance and support levels.
- The pivot point is a trigger point for intra-day buying and selling based on the previous day's price range, and is used to determine resistance and support levels.
- Traders are advised to take buy positions above the pivot point and sell positions below it, using the pivot point as a stop loss and targeting resistance or support levels.
The document provides intra-day technical levels for various commodities trading on the MCX exchange for February 26, 2013. It lists the commodity, contract expiry date, previous day's close price, intra-day trend, pivot point, resistance and support levels for each commodity. Technical analysis is used to determine the short-term outlook and key price levels.
This document provides a daily outlook on currency, indices, and stock positional option trades for February 26, 2013. It summarizes the highest call and put open interest levels for the Nifty and Bank Nifty indices and recommends short strangle strategies. It also recommends short strangle trades for the USD/INR currency pair in March. On the stock side, it recommends bullish positional calls on specific stocks and bearish positional puts on other stocks. The document provides a ready reckoner on various option strategies and techniques for managing risk.
This document provides the intra-day technical levels for various stocks trading on the NSE, including pivot points and resistance and support levels, to help analyze the market trend for day trading on February 26, 2013, with the futures and options contracts expiring on February 28, 2013. The levels indicated include important price points to watch for potential reversals in the movement of each stock.
Keynote technicals intraday future levels for 260213
Keynote commodity daily report for 140113
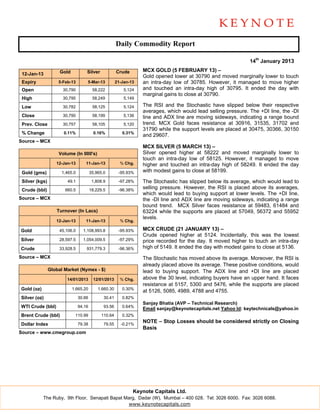
1. Daily Commodity Report
14th January 2013
Gold Silver Crude MCX GOLD (5 FEBRUARY 13) –
12-Jan-13
Gold opened lower at 30790 and moved marginally lower to touch
Expiry 5-Feb-13 5-Mar-13 21-Jan-13 an intra-day low of 30785. However, it managed to move higher
Open 30,790 58,222 5,124 and touched an intra-day high of 30795. It ended the day with
marginal gains to close at 30790.
High 30,795 58,249 5,149
Low 30,782 58,125 5,124 The RSI and the Stochastic have slipped below their respective
averages, which would lead selling pressure. The +DI line, the -DI
Close 30,790 58,199 5,136 line and ADX line are moving sideways, indicating a range bound
Prev. Close 30,757 58,105 5,120 trend. MCX Gold faces resistance at 30916, 31535, 31702 and
31790 while the support levels are placed at 30475, 30366, 30150
% Change 0.11% 0.16% 0.31%
and 29607.
Source – MCX
MCX SILVER (5 MARCH 13) –
Volume (In 000's) Silver opened higher at 58222 and moved marginally lower to
touch an intra-day low of 58125. However, it managed to move
12-Jan-13 11-Jan-13 % Chg. higher and touched an intra-day high of 58249. It ended the day
Gold (gms) 1,465.0 35,965.0 -95.93% with modest gains to close at 58199.
Silver (kgs) 49.1 1,808.9 -97.28% The Stochastic has slipped below its average, which would lead to
Crude (bbl) 660.5 18,229.5 -96.38%
selling pressure. However, the RSI is placed above its averages,
which would lead to buying support at lower levels. The +DI line,
Source – MCX the -DI line and ADX line are moving sideways, indicating a range
bound trend. MCX Silver faces resistance at 59483, 61484 and
Turnover (In Lacs) 63224 while the supports are placed at 57049, 56372 and 55952
levels.
12-Jan-13 11-Jan-13 % Chg.
Gold 45,106.0 1,108,993.8 -95.93% MCX CRUDE (21 JANUARY 13) –
Crude opened higher at 5124. Incidentally, this was the lowest
Silver 28,597.5 1,054,009.5 -97.29% price recorded for the day. It moved higher to touch an intra-day
Crude 33,928.5 931,779.3 -96.36% high of 5149. It ended the day with modest gains to close at 5136.
Source – MCX The Stochastic has moved above its average. Moreover, the RSI is
already placed above its average. These positive conditions, would
Global Market (Nymex - $) lead to buying support. The ADX line and +DI line are placed
14/01/2013 12/01/2013 % Chg. above the 30 level, indicating buyers have an upper hand. It faces
resistance at 5157, 5300 and 5476, while the supports are placed
Gold (oz) 1,665.20 1,660.30 0.30%
at 5126, 5085, 4989, 4788 and 4755.
Silver (oz) 30.66 30.41 0.82%
Sanjay Bhatia (AVP – Technical Research)
WTI Crude (bbl) 94.16 93.56 0.64%
Email sanjay@keynotecapitals.net Yahoo Id: keytechnicals@yahoo.in
Brent Crude (bbl) 110.99 110.64 0.32%
NOTE – Stop Losses should be considered strictly on Closing
Dollar Index 79.38 79.55 -0.21%
Basis
Source – www.cmegroup.com
Keynote Capitals Ltd.
The Ruby, 9th Floor, Senapati Bapat Marg, Dadar (W), Mumbai – 400 028. Tel: 3026 6000. Fax: 3026 6088.
www.keynotecapitals.com
2. Commodity News:
Gold, silver slip on subdued demand
Gold prices fell at the domestic bullion market today due to poor demand from stockists amid sluggish local buying
interest. Silver also slumped on the back of heavy speculative unwinding. Standard gold of 99.5 per cent purity slid by
Rs 80 to conclude at Rs 30,430 per 10 grams from overnight closing level of Rs 30,510.
Sugar futures fall on sluggish demand
Sugar prices fell by 0.37 per cent to Rs 3,190 per quintal in futures trading today as speculators offloaded their
positions, taking negative cues from spot market on sluggish demand against adequate supplies. At the National
Commodity and Derivatives Exchange, Sugar for delivery in January declined by Rs 12, or 0.37 per cent, to Rs 3,190
per quintal with an open interest of 9,630 lots.
Copper futures prices marginally down
Copper futures prices today declined by 0.20 per cent to Rs 452.25 per kg, as speculators locked-in gains after recent
gains, even as metal strengthened in global markets. At the Multi Commodity Exchange, Copper for delivery in April
declined by 90 paise, or 0.20 per cent, to Rs 452.25 per kg in business turnover of 107 lots. Similarly, the metal for
delivery in February fell by 25 paise, or 0.19 per cent, to Rs 447.95 per kg in 1,698 lots.
Source: ET
Economic Calendar:
Countries / Monday Tuesday Wednesday
Regions 14/13 15/13 16/13
India WPI Inflation (Dec)
Producer Price Index (YoY) Consumer Price Index (YoY)
US Fed's Evans Speech
(Dec) (Dec)
Industrial Production (MoM)
Retail Sales (MoM) (Dec)
(Dec)
Euro Industrial Production UK RICS Housing Price Euro Consumer Price Index -
Global
w.d.a. (YoY) (Nov) Balance (Dec) Core (YoY) (Dec)
Germany Gross Domestic
Product n.s.a (YoY)
UK Consumer Price Index
(YoY) (Dec)
Keynote Capitals Ltd.
The Ruby, 9th Floor, Senapati Bapat Marg, Dadar (W), Mumbai – 400 028. Tel: 3026 6000. Fax: 3026 6088.
www.keynotecapitals.com
3. Disclaimer
This document is not for public distribution and has been furnished to you solely for your information and must not be reproduced or
redistributed to any other person. Persons into whose possession this document may come are required to observe these restrictions.
This material is for the personal information of the authorized recipient, and we are not soliciting any action based upon it. This report is not
to be construed as an offer to sell or the solicitation of an offer to buy any security in any jurisdiction where such an offer or solicitation
would be illegal. It is for the general information of clients of Keynote Capitals Ltd. It does not constitute a personal recommendation or
take into account the particular investment objectives, financial situations, or needs of individual clients.
We have reviewed the report, and in so far as it includes current or historical information, it is believed to be reliable though its accuracy or
completeness cannot be guaranteed. Neither Keynote Capitals Ltd., nor any person connected with it, accepts any liability arising from the
use of this document. The recipients of this material should rely on their own investigations and take their own professional advice. Price
and value of the investments referred to in this material may go up or down. Past performance is not a guide for future performance.
Certain transactions -including those involving futures, options and other derivatives as well as non-investment grade securities - involve
substantial risk and are not suitable for all investors. Reports based on technical analysis centers on studying charts of a stock’s price
movement and trading volume, as opposed to focusing on a company’s fundamentals and as such, may not match with a report on a
company’s fundamentals.
Opinions expressed are our current opinions as of the date appearing on this material only. While we endeavor to update on a reasonable
basis the information discussed in this material, there may be regulatory, compliance, or other reasons that prevent us from doing so.
Prospective investors and others are cautioned that any forward-looking statements are not predictions and may be subject to change
without notice. Our proprietary trading and investment businesses may make investment decisions that are inconsistent with the
recommendations expressed herein.
We and our affiliates, officers, directors, and employees world wide may: (a) from time to time, have long or short positions in, and buy or
sell the securities thereof, of company (ies) mentioned herein or (b) be engaged in any other transaction involving such securities and earn
brokerage or other compensation or act as a market maker in the financial instruments of the company (ies) discussed herein or act as
advisor or lender / borrower to such company (ies) or have other potential conflict of interest with respect to any recommendation and
related information and opinions.
The analyst for this report certifies that all of the views expressed in this report accurately reflect his or her personal views about the
subject company or companies and its or their securities, and no part of his or her compensation was, is or will be, directly or indirectly
related to specific recommendations or views expressed in this report.
No part of this material may be duplicated in any form and/or redistributed without Keynote Capitals Ltd’s., prior written consent.
Keynote Capitals Ltd.
The Ruby, 9th Floor, Senapati Bapat Marg, Dadar (W), Mumbai – 400 028. Tel: 3026 6000. Fax: 3026 6088.
www.keynotecapitals.com