Download to read offline
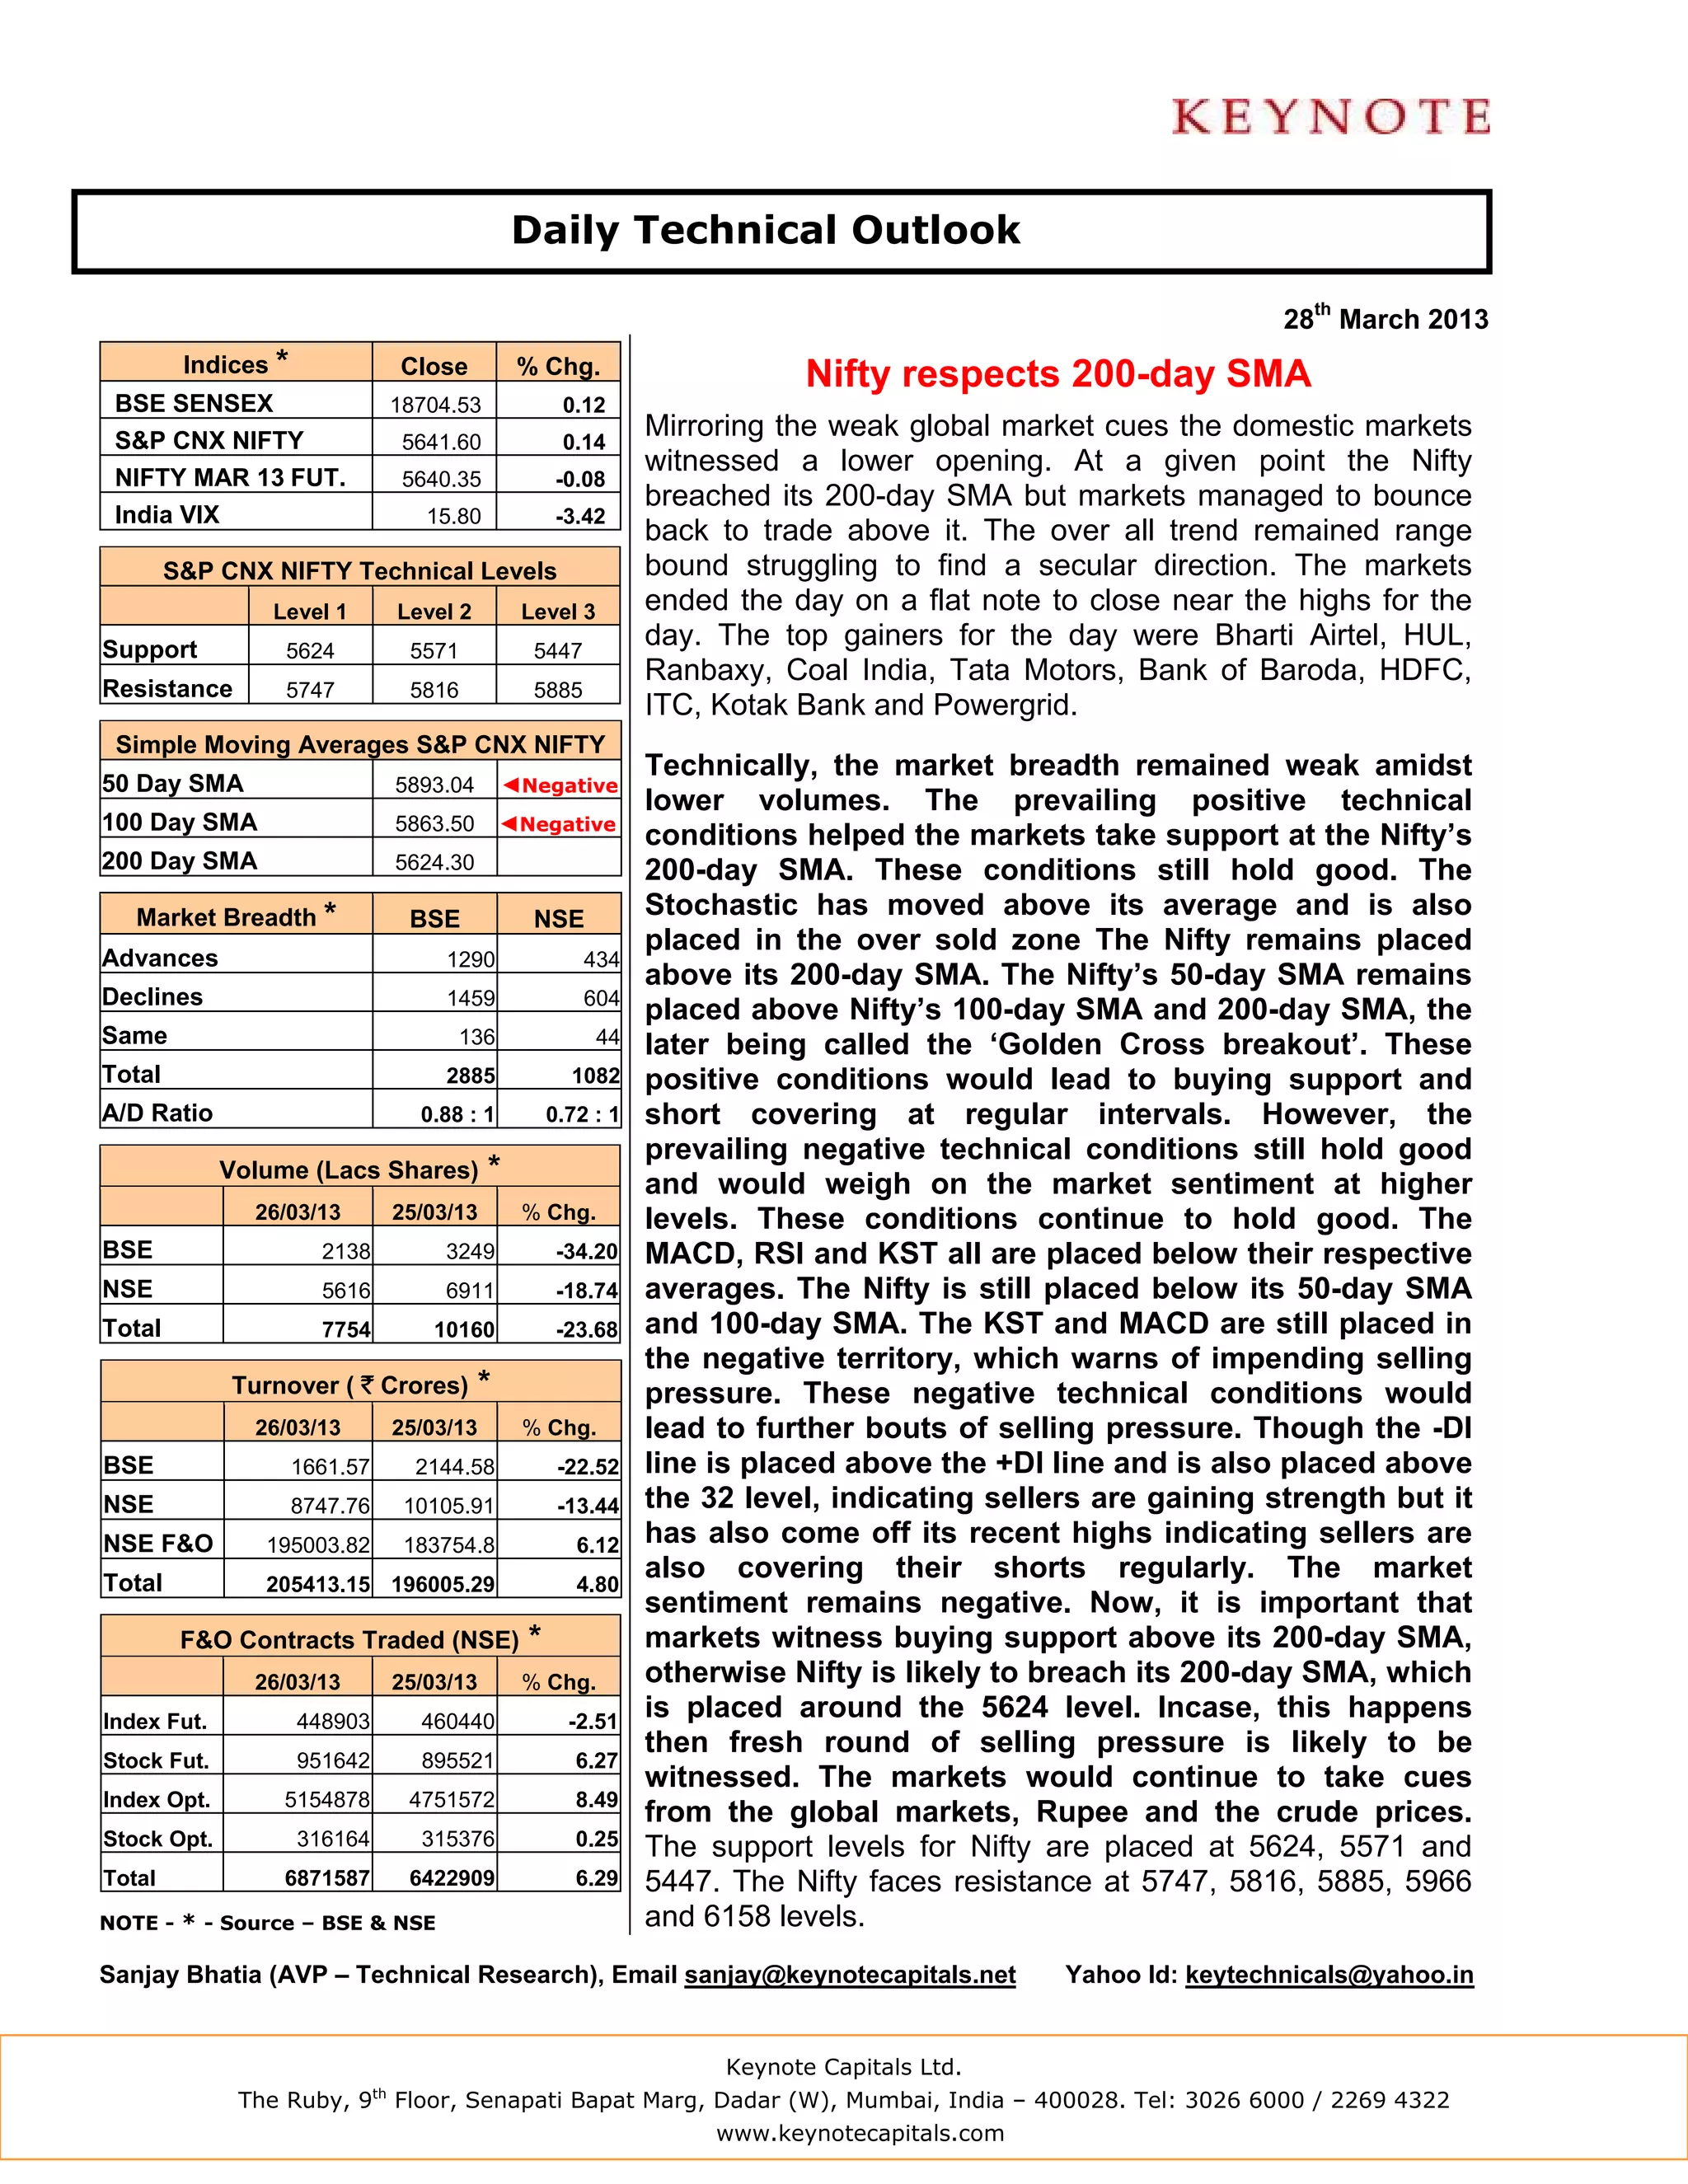

The domestic stock markets opened lower but bounced back to close flat, supported by the 200-day simple moving average. The Nifty closed slightly higher but technical indicators remain negative, suggesting further bouts of selling pressure. Key support levels are at 5624, 5571 and 5447, while resistance levels are at 5747, 5816 and 5885. Stocks such as Adani Ports, HDFC, and HUL are recommended for watching.


