Jy3517271730
•
0 likes•242 views

International Journal of Engineering Research and Applications (IJERA) is an open access online peer reviewed international journal that publishes research and review articles in the fields of Computer Science, Neural Networks, Electrical Engineering, Software Engineering, Information Technology, Mechanical Engineering, Chemical Engineering, Plastic Engineering, Food Technology, Textile Engineering, Nano Technology & science, Power Electronics, Electronics & Communication Engineering, Computational mathematics, Image processing, Civil Engineering, Structural Engineering, Environmental Engineering, VLSI Testing & Low Power VLSI Design etc.
![Santosh K Chhotray et al Int. Journal of Engineering Research and Application
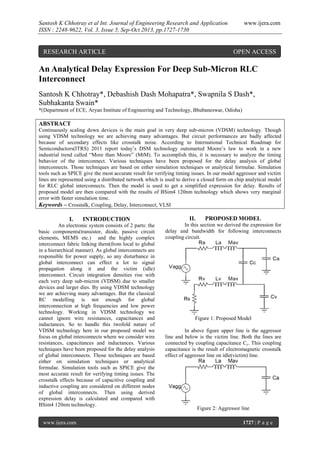
ISSN : 2248-9622, Vol. 3, Issue 5, Sep-Oct 2013, pp.1727-1730
Above figure shows parameters of aggressor
line.Vagg is the signal voltage to aggressor line where
Ra, La , Ca and Mav are aggressor line resistance,
inductance, capacitances and mutual inductance
respectively.
www.ijera.com
I (S )
1
Vagg ( S ) I1 ( S )
0
Cc S
Cv S
I (S )
I (S )
Vagg ( S ) 1
Cc S
Cv S
I (S ) (
I1 ( S )
Vagg )Cc S
Cv S
(3)
In practice net inductance of an interconnect
considering loop inductance and wire inductance Net
inductance implies closely spaced wires do not
reduce their net inductance as expected
L p1 L p 2 M p 2
L pnet
L p1 L p 2 2M p
If Lp1 Lp 2 Lp
Figure 3: Victim Line
Above figure represents coupling voltage
Vagg(S) because of crosstalk noise of aggressor line.
Similarly Rv, Lv, Cv and Mav are victim line
resistance, inductance, capacitances and mutual
inductance respectively. In figure 2 and 3 aggressor
and victim line are represented individually. Then
these models are used for deriving analytical
expression for delay.
Delay Calculation
Here we have taken figure 3 as this line
produces an unexpected output because of the
coupling voltage Vagg. Now figure 3 can be simplified
as shown below.
t
Vdd 0 t a
(1)
Vagg (t ) a
V
t a
dd
It can be represented in S-domain as
Vagg ( s )
Lpnet
2
Net inductance implies closely spaced wires
don’t reduce their net inductance.
Now applying KVL to second loop
L Mp
I1 ( S )
{I ( S ) I1 ( S )}[ Rv ( p
) S Rs ] 0
Cv S
2
Vagg Cc S
Vout ( S )
Cc
2
C S 2R ( L M )S 1 C
v
p
p
v v
L Mp
I ( S ) Rv ( p
) S Rs
2
I1 ( S )
Lp M p
1
) S Rs
C S Rv (
2
v
(2)
(4)
Using (3) in (4)
I1 ( S )
L Mp
Vagg Cc S Rv ( p
) S Rs
2
Cv S
I1 ( S )
Lp M p
1
C S Rv ( 2 ) S Rs
v
(5)
Now solving above equation
Figure 4: Victim Line equivalent circuit
Proposed model is based on the above circuit.
Figure represents victim line parameters and Vout(S)
is the noise voltage because of crosstalk.
Now applying KVL to first loop
www.ijera.com
* 1
Cv S
L Mp
L Mp
1
I1 ( S )
Rv ( p
) S Rs I ( S ) Rv ( p
) S Rs
Cv S
2
2
1
Vdd
s 2 a
Here for easily deriving the expressions in
final expression we have taken Vdd=1.
Lp M p
I1 ( S )
If
Vagg Cc S
C
2
1 c
Cv
Cv S 2 Rv ( Lp M p ) S 2 Rs
Rs 0
1728 | P a g e](data:image/gif;base64,R0lGODlhAQABAIAAAAAAAP///yH5BAEAAAAALAAAAAABAAEAAAIBRAA7)
Recommended
Recommended
More Related Content
What's hot
What's hot (20)
Viewers also liked
Similar to Jy3517271730
Similar to Jy3517271730 (20)
Recently uploaded
Recently uploaded (20)
Jy3517271730
- 1. Santosh K Chhotray et al Int. Journal of Engineering Research and Application ISSN : 2248-9622, Vol. 3, Issue 5, Sep-Oct 2013, pp.1727-1730 RESEARCH ARTICLE www.ijera.com OPEN ACCESS An Analytical Delay Expression For Deep Sub-Micron RLC Interconnect Santosh K Chhotray*, Debashish Dash Mohapatra*, Swapnila S Dash*, Subhakanta Swain* *(Department of ECE, Aryan Institute of Engineering and Technology, Bhubaneswar, Odisha) ABSTRACT Continuously scaling down devices is the main goal in very deep sub-micron (VDSM) technology. Though using VDSM technology we are achieving many advantages. But circuit performances are badly affected because of secondary effects like crosstalk noise. According to International Technical Roadmap for Semiconductors(ITRS) 2011 report today’s DSM technology outsmarted Moore’s law to work in a new industrial trend called “More than Moore” (MtM). To accomplish this, it is necessary to analyze the timing behavior of the interconnect. Various techniques have been proposed for the delay analysis of global interconnects. Those techniques are based on either simulation techniques or analytical formulae. Simulation tools such as SPICE give the most accurate result for verifying timing issues. In our model aggressor and victim lines are represented using a distributed network which is used to derive a closed form on chip analytical model for RLC global interconnects. Then the model is used to get a simplified expression for delay. Results of proposed model are then compared with the results of BSim4 120nm technology which shows very marginal error with faster simulation time. Keywords – Crosstalk, Coupling, Delay, Interconnect, VLSI I. INTRODUCTION An electronic system consists of 2 parts: the basic components(transistor, diode, passive circuit elements, MEMS etc.) and the highly complex interconnect fabric linking them(from local to global in a hierarchical manner). As global interconnects are responsible for power supply, so any disturbance in global interconnect can effect a lot to signal propagation along it and the victim (idle) interconnect. Circuit integration densities rise with each very deep sub-micron (VDSM) due to smaller devices and larger dies. By using VDSM technology we are achieving many advantages. But the classical RC modelling is not enough for global interconnection at high frequencies and low power technology. Working in VDSM technology we cannot ignore wire resistances, capacitances and inductances. So to handle this twofold nature of VDSM technology here in our proposed model we focus on global interconnects where we consider wire resistances, capacitances and inductances. Various techniques have been proposed for the delay analysis of global interconnects. Those techniques are based either on simulation techniques or analytical formulae. Simulation tools such as SPICE give the most accurate result for verifying timing issues. The crosstalk effects because of capacitive coupling and inductive coupling are considered on different nodes of global interconnects. Then using derived expression delay is calculated and compared with BSim4 120nm technology. www.ijera.com II. PROPOSED MODEL In this section we derived the expression for delay and bandwidth for following interconnects coupling circuit. Figure 1: Proposed Model In above figure upper line is the aggressor line and below is the victim line. Both the lines are connected by coupling capacitance Cc. This coupling capacitance is the result of electromagnetic crosstalk effect of aggressor line on idle(victim) line. Figure 2: Aggressor line 1727 | P a g e
- 2. Santosh K Chhotray et al Int. Journal of Engineering Research and Application ISSN : 2248-9622, Vol. 3, Issue 5, Sep-Oct 2013, pp.1727-1730 Above figure shows parameters of aggressor line.Vagg is the signal voltage to aggressor line where Ra, La , Ca and Mav are aggressor line resistance, inductance, capacitances and mutual inductance respectively. www.ijera.com I (S ) 1 Vagg ( S ) I1 ( S ) 0 Cc S Cv S I (S ) I (S ) Vagg ( S ) 1 Cc S Cv S I (S ) ( I1 ( S ) Vagg )Cc S Cv S (3) In practice net inductance of an interconnect considering loop inductance and wire inductance Net inductance implies closely spaced wires do not reduce their net inductance as expected L p1 L p 2 M p 2 L pnet L p1 L p 2 2M p If Lp1 Lp 2 Lp Figure 3: Victim Line Above figure represents coupling voltage Vagg(S) because of crosstalk noise of aggressor line. Similarly Rv, Lv, Cv and Mav are victim line resistance, inductance, capacitances and mutual inductance respectively. In figure 2 and 3 aggressor and victim line are represented individually. Then these models are used for deriving analytical expression for delay. Delay Calculation Here we have taken figure 3 as this line produces an unexpected output because of the coupling voltage Vagg. Now figure 3 can be simplified as shown below. t Vdd 0 t a (1) Vagg (t ) a V t a dd It can be represented in S-domain as Vagg ( s ) Lpnet 2 Net inductance implies closely spaced wires don’t reduce their net inductance. Now applying KVL to second loop L Mp I1 ( S ) {I ( S ) I1 ( S )}[ Rv ( p ) S Rs ] 0 Cv S 2 Vagg Cc S Vout ( S ) Cc 2 C S 2R ( L M )S 1 C v p p v v L Mp I ( S ) Rv ( p ) S Rs 2 I1 ( S ) Lp M p 1 ) S Rs C S Rv ( 2 v (2) (4) Using (3) in (4) I1 ( S ) L Mp Vagg Cc S Rv ( p ) S Rs 2 Cv S I1 ( S ) Lp M p 1 C S Rv ( 2 ) S Rs v (5) Now solving above equation Figure 4: Victim Line equivalent circuit Proposed model is based on the above circuit. Figure represents victim line parameters and Vout(S) is the noise voltage because of crosstalk. Now applying KVL to first loop www.ijera.com * 1 Cv S L Mp L Mp 1 I1 ( S ) Rv ( p ) S Rs I ( S ) Rv ( p ) S Rs Cv S 2 2 1 Vdd s 2 a Here for easily deriving the expressions in final expression we have taken Vdd=1. Lp M p I1 ( S ) If Vagg Cc S C 2 1 c Cv Cv S 2 Rv ( Lp M p ) S 2 Rs Rs 0 1728 | P a g e
- 3. Santosh K Chhotray et al Int. Journal of Engineering Research and Application ISSN : 2248-9622, Vol. 3, Issue 5, Sep-Oct 2013, pp.1727-1730 I1 ( S ) Vagg Cc S C 2 1 c Cv Cv S 2 Rv ( Lp M p ) S So Vout I1 ( S ) * www.ijera.com Table-II compares the delay we got using derived expression with SPICE simulator values and the average percentage of error is about 0.0540%. Table II: Delay comparison of Proposed model with SPICE model 1 Cv S (6) Vagg Cc S * 1 Vout ( S ) Cc Cv S 2 C S 2R ( L M )S 1 C v p p v v (7) For calculation of delay we consider 50% rise time when Vout(t)=0.5Vdd Rs(Ω) Lv(nH) Cc(fF) 50 100 450 1000 0.07 0.07 0.07 0.07 0.279 0.279 0.279 0.279 SPICE Delay(ps) 20.54 42.85 229.47 480.13 Proposed Model(ps) 20.25 41.45 214.66 429.63 Now for delay calculation equating Vout(t)=0.5Vdd Vout ( S ) 0.5Vdd S Using above value in (7) Vdd Cc S 0.5Vdd S 2t50% * 1 Cc Cv S 2 S C S 2R ( L M )S 1 C v p p v v Solving above equation and taking inverse Laplace transform CC Rv t50% 2* 2 Cv X Cc X Where X 2Rv ( Lp M p ) Analytically Mp can be found out by using[5] 2 2 l s l s M p 2 *107 ln 1 1 s l s l III. SIMULATION RESULT AND DISCUSSION The configuration of circuit for simulation is shown in Figure 1. The high-speed interconnect system consist of two coupled interconnect lines and ground and the length of the lines is d=100 um with a separation of ‘S’. The extracted values for the parameters R, L, and C are given in Table I. Table I:RLC Parameters for a MinimumSized Wires in a 0.12um Technology Parameter(s) Value/100um Resistance(Rv) 287Ω Inductance(Lv) 0.07 nH Coupling Capacitance(Cc) 0.279fF Capacitance(Cv) 3.95fF/m Wire Separation(S) 0.6um www.ijera.com Figure 5: Deviation from SPICE Model Above figure shows the deviation of proposed model from SPICE model. IV. CONCLUSION In this study simple and explicit analytical expressions have been proposed for calculating delay for global interconnects in very deep sub-micron (VDSM) technology. It is expected that these expressions will also applicable to 90nm and 45nm technology. These expressions are expected to be used efficiently in high speed and large scale circuits. In future we will try to simplify these equations to more simple form as possible with more non-linear parameters. V. ACKNOWLEDGEMENTS The authors would like to thank Dr R Bhima Rao, Principal, AIET, Bhubaneswar for all his assistance. All staffs of ECE department, AIET, Bhubaneswar are also acknowledged. REFERENCES [1] Mingcui Zhou, Wentai Liu, Mohanasankar Sivaprakasam “A Closed-form Delay Formula for On-Chip RLC Interconnects in Current-Mode Signaling” Department of 1729 | P a g e % Error 0.0141 0.0325 0.0645 0.1051
- 4. Santosh K Chhotray et al Int. Journal of Engineering Research and Application ISSN : 2248-9622, Vol. 3, Issue 5, Sep-Oct 2013, pp.1727-1730 [2] [3] [4] [5] [6] [7] www.ijera.com Electrical Engineering, University of California at Santa Cruz, CA 95064, USA ©2005 IEEE. R. Venkatesan, J. Davis, and J. Meindl, “Compact distributed RLC interconnect models ---part IV: unified models for time delay, crosstalk, and repeater insertion,” IEEE trans. Electron Devices, vol.50, no. 4, April, 2003, pp.1094-1102. S. Y. Kim, K. Y. Kim and S. Y. Kim, “The Algebraic Calculation of the Delay Time using the Reduction Model of RC-class Interconnect,” KIEE Trans, vol 52C, no 5, pp193-200, May 2003. W. C. Elmore, “The transient response of damped liner network with particular regard to wide band amplifier,” J. Appl. Phys, vol.19, pp55-63, 1948. C R Paul, “Partial Inductance”Mercer University, Macon, USA ©2010 IEEE. S. K. Chhotray, V. Maheshwari, A. Bansal, R. Kar, D. Mandal, A. K. Bhattacharjee, “Crosstalk aware Bandwidth Modelling for VLSI RC Global Interconnects using 2-π Model”, Procedia Technology Journal, vol. 6, pp. 832 – 839, 2012, Elsevier. Vittal A., Marek-Sadowska M., 1997, “Crosstalk Reduction for VLSI.” IEEE Trans. Computer Aided Design. Integrated Circuits System, Vol. 16. No. 3, pp. 290298. www.ijera.com 1730 | P a g e