Downloaded 25 times


![Theoretical Framework (continued) Φ 2 (X,Y| ρ XY ): bivariate normal distribution function, ρ XY =[ τ X / τ Y ] .5 for respective “expiry times” (note assumption that loan resolves before bond a matter of necessity here and seen on average in the data) Can extend this framework to arbitrary tranches: debt subordinated to the d th degree results in a pricing formula that is a linear combination of d+1 variate Gaussian distributions These formulae become cumbersome very quickly, so for the sake of brevity we refer the interested reader to Haug (2006) for further details](https://image.slidesharecdn.com/lgdmodeljacobs1010v21-12872530142448-phpapp02/85/Lgd-Model-Jacobs-10-10-V2-1-10-320.jpg)


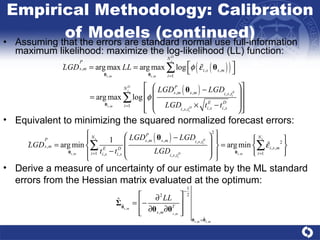


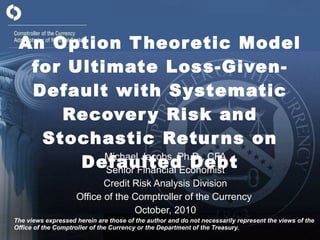
![Model Validation Validate preferred 2FSM-SR&RD by out-of-sample and out-of-time rolling annual cohort analysis Augment this by resampling on both the training and prediction samples, a non-parametric bootstrap (Efron [1979], Efron and Tibshirani [1986]) Analyze distribution of key diagnostic statistics Spearman rank-order correlation & Hoshmer-Lemeshow Chi-Squared (HLCQ) P-values Alternative #1 for predicting ultimate LGD: full-information maximum likelihood simultaneous equation regression model (FIMLE-SEM) built upon observations in URD at instrument & obligor level (Jacobs et al, 2010) 2nd alternative non-parametric estimation of a relationship with several independent variables & a bounded dependent variable Boundary bias with standard non-parametric estimators using Gaussian kernel (Hardle and Linton (1994) and Pagan and Ullah (1999)). Chen (1999): BKDE defined on [0,1], flexible functional form, simplicity of estimation, non-negativity & finite sample optimal rate of convergence Extend (Renault and Scalliet, 2004) to GBKDE: density is a function of several independent variables (->smoothing through dependency of beta parameters)](https://image.slidesharecdn.com/lgdmodeljacobs1010v21-12872530142448-phpapp02/85/Lgd-Model-Jacobs-10-10-V2-1-21-320.jpg)
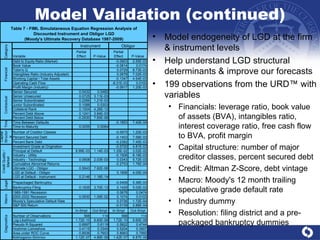


This document presents an option theoretic model for ultimate loss-given-default (LGD) that incorporates systematic recovery risk and stochastic returns on defaulted debt. It develops a theoretical framework within the Merton model, validating the model with empirical data from Moody's recovery database, and finds significant variability in LGD estimates across various segments and models. The analysis highlights the influence of recovery volatility, correlation between default and recovery, and seniority on the estimation of LGD.