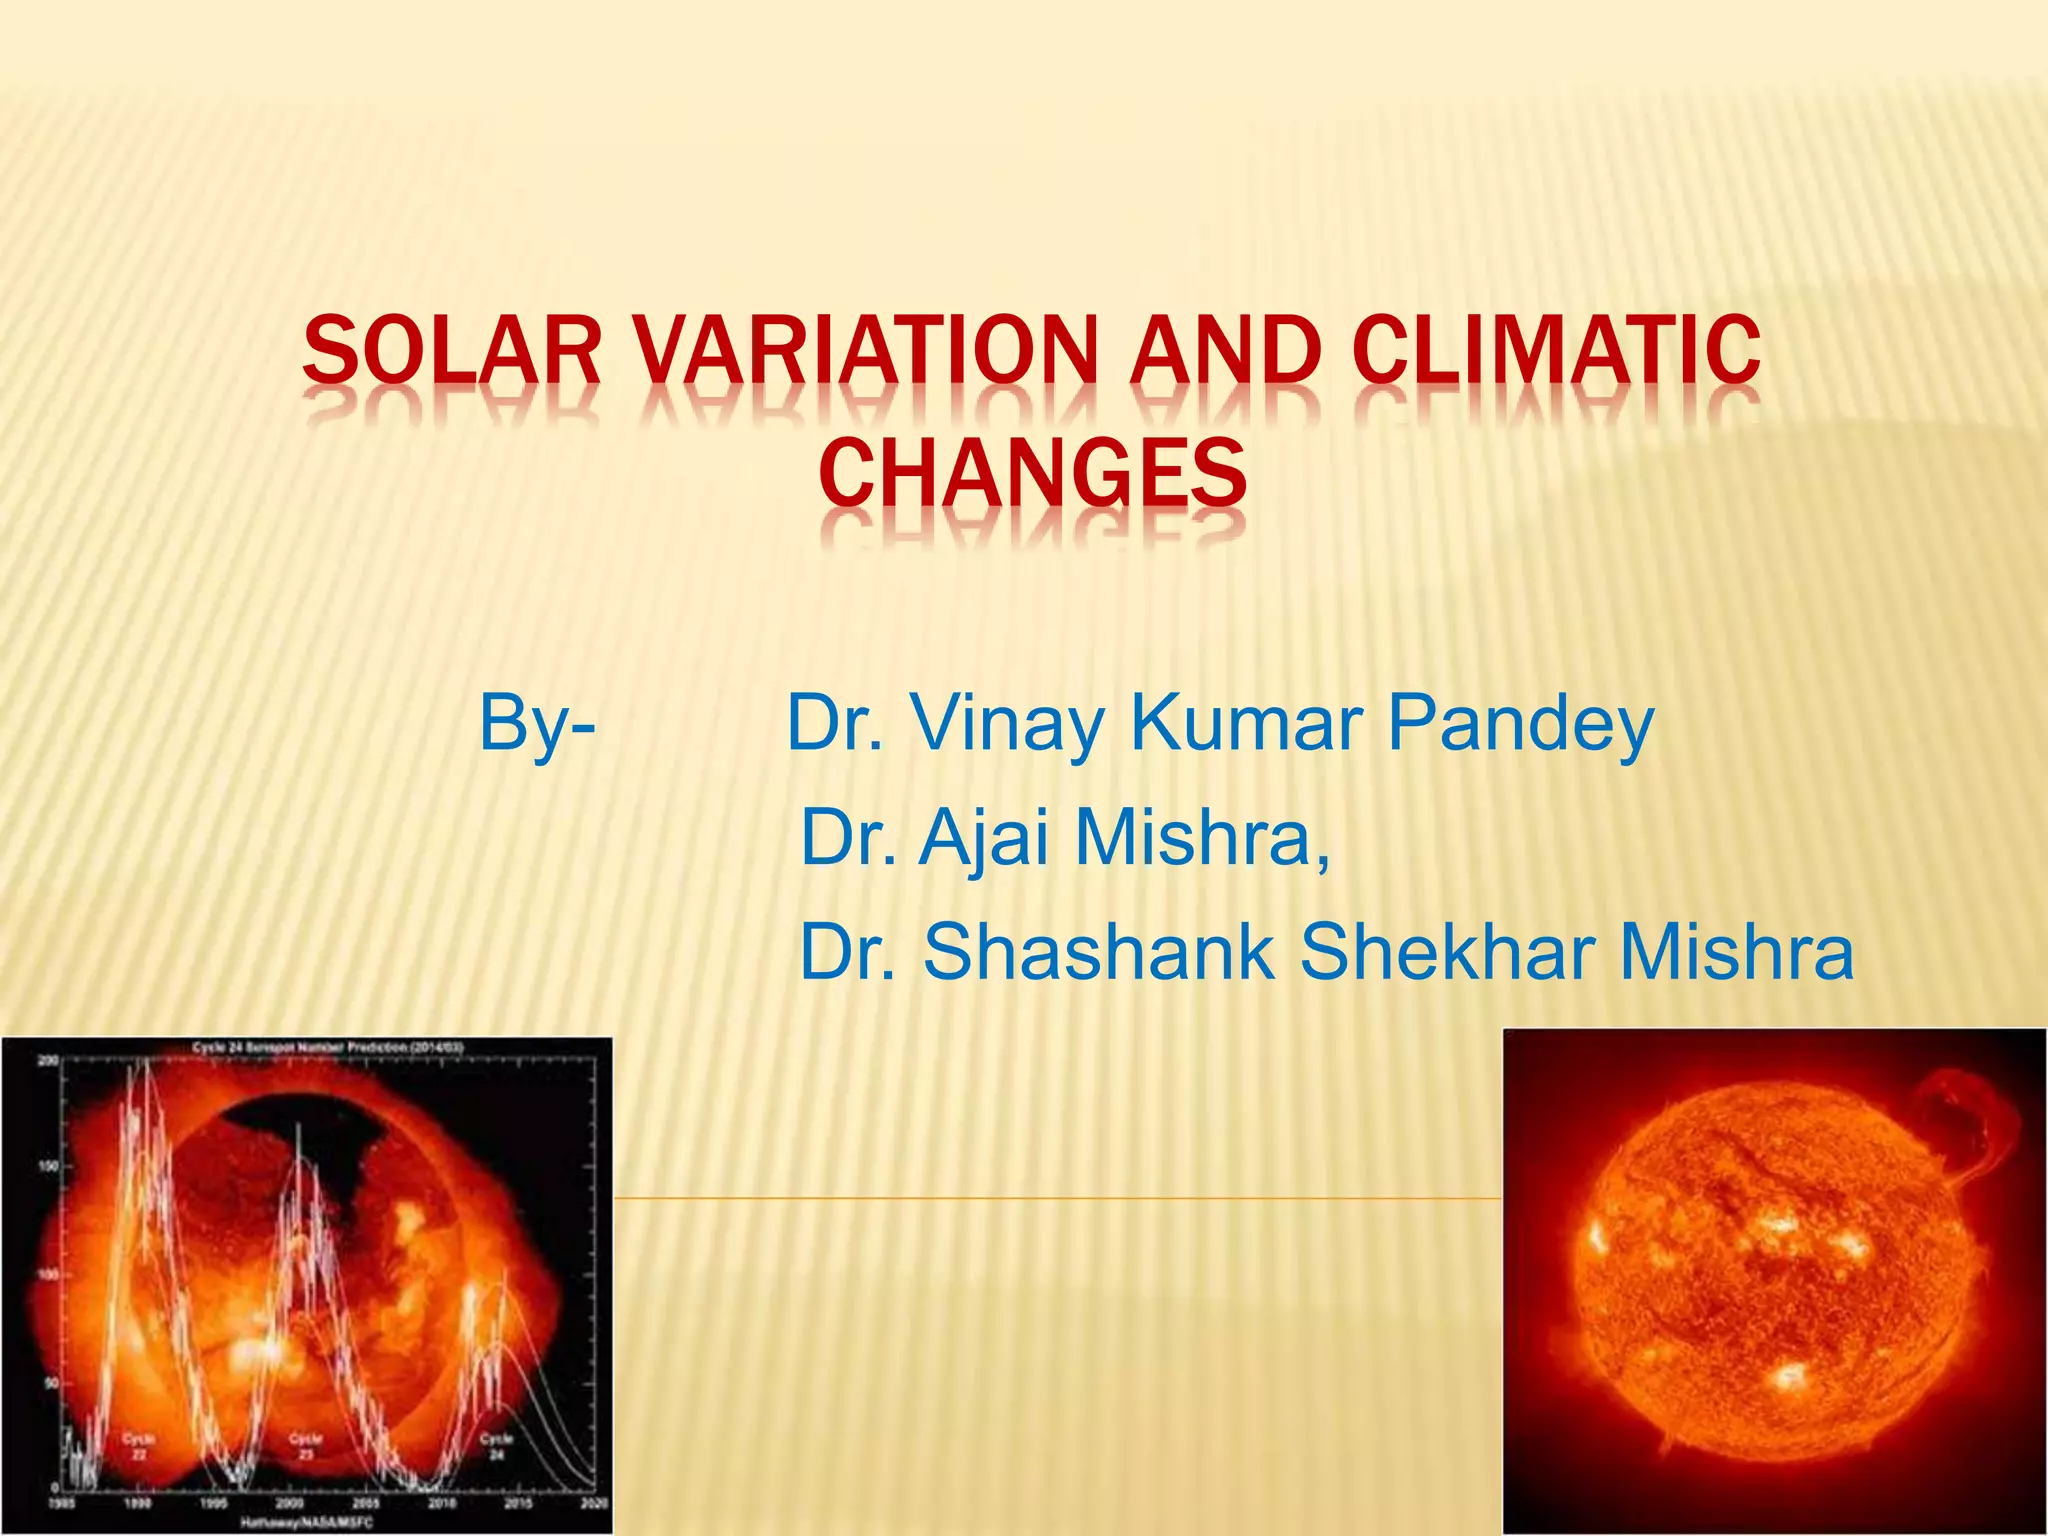
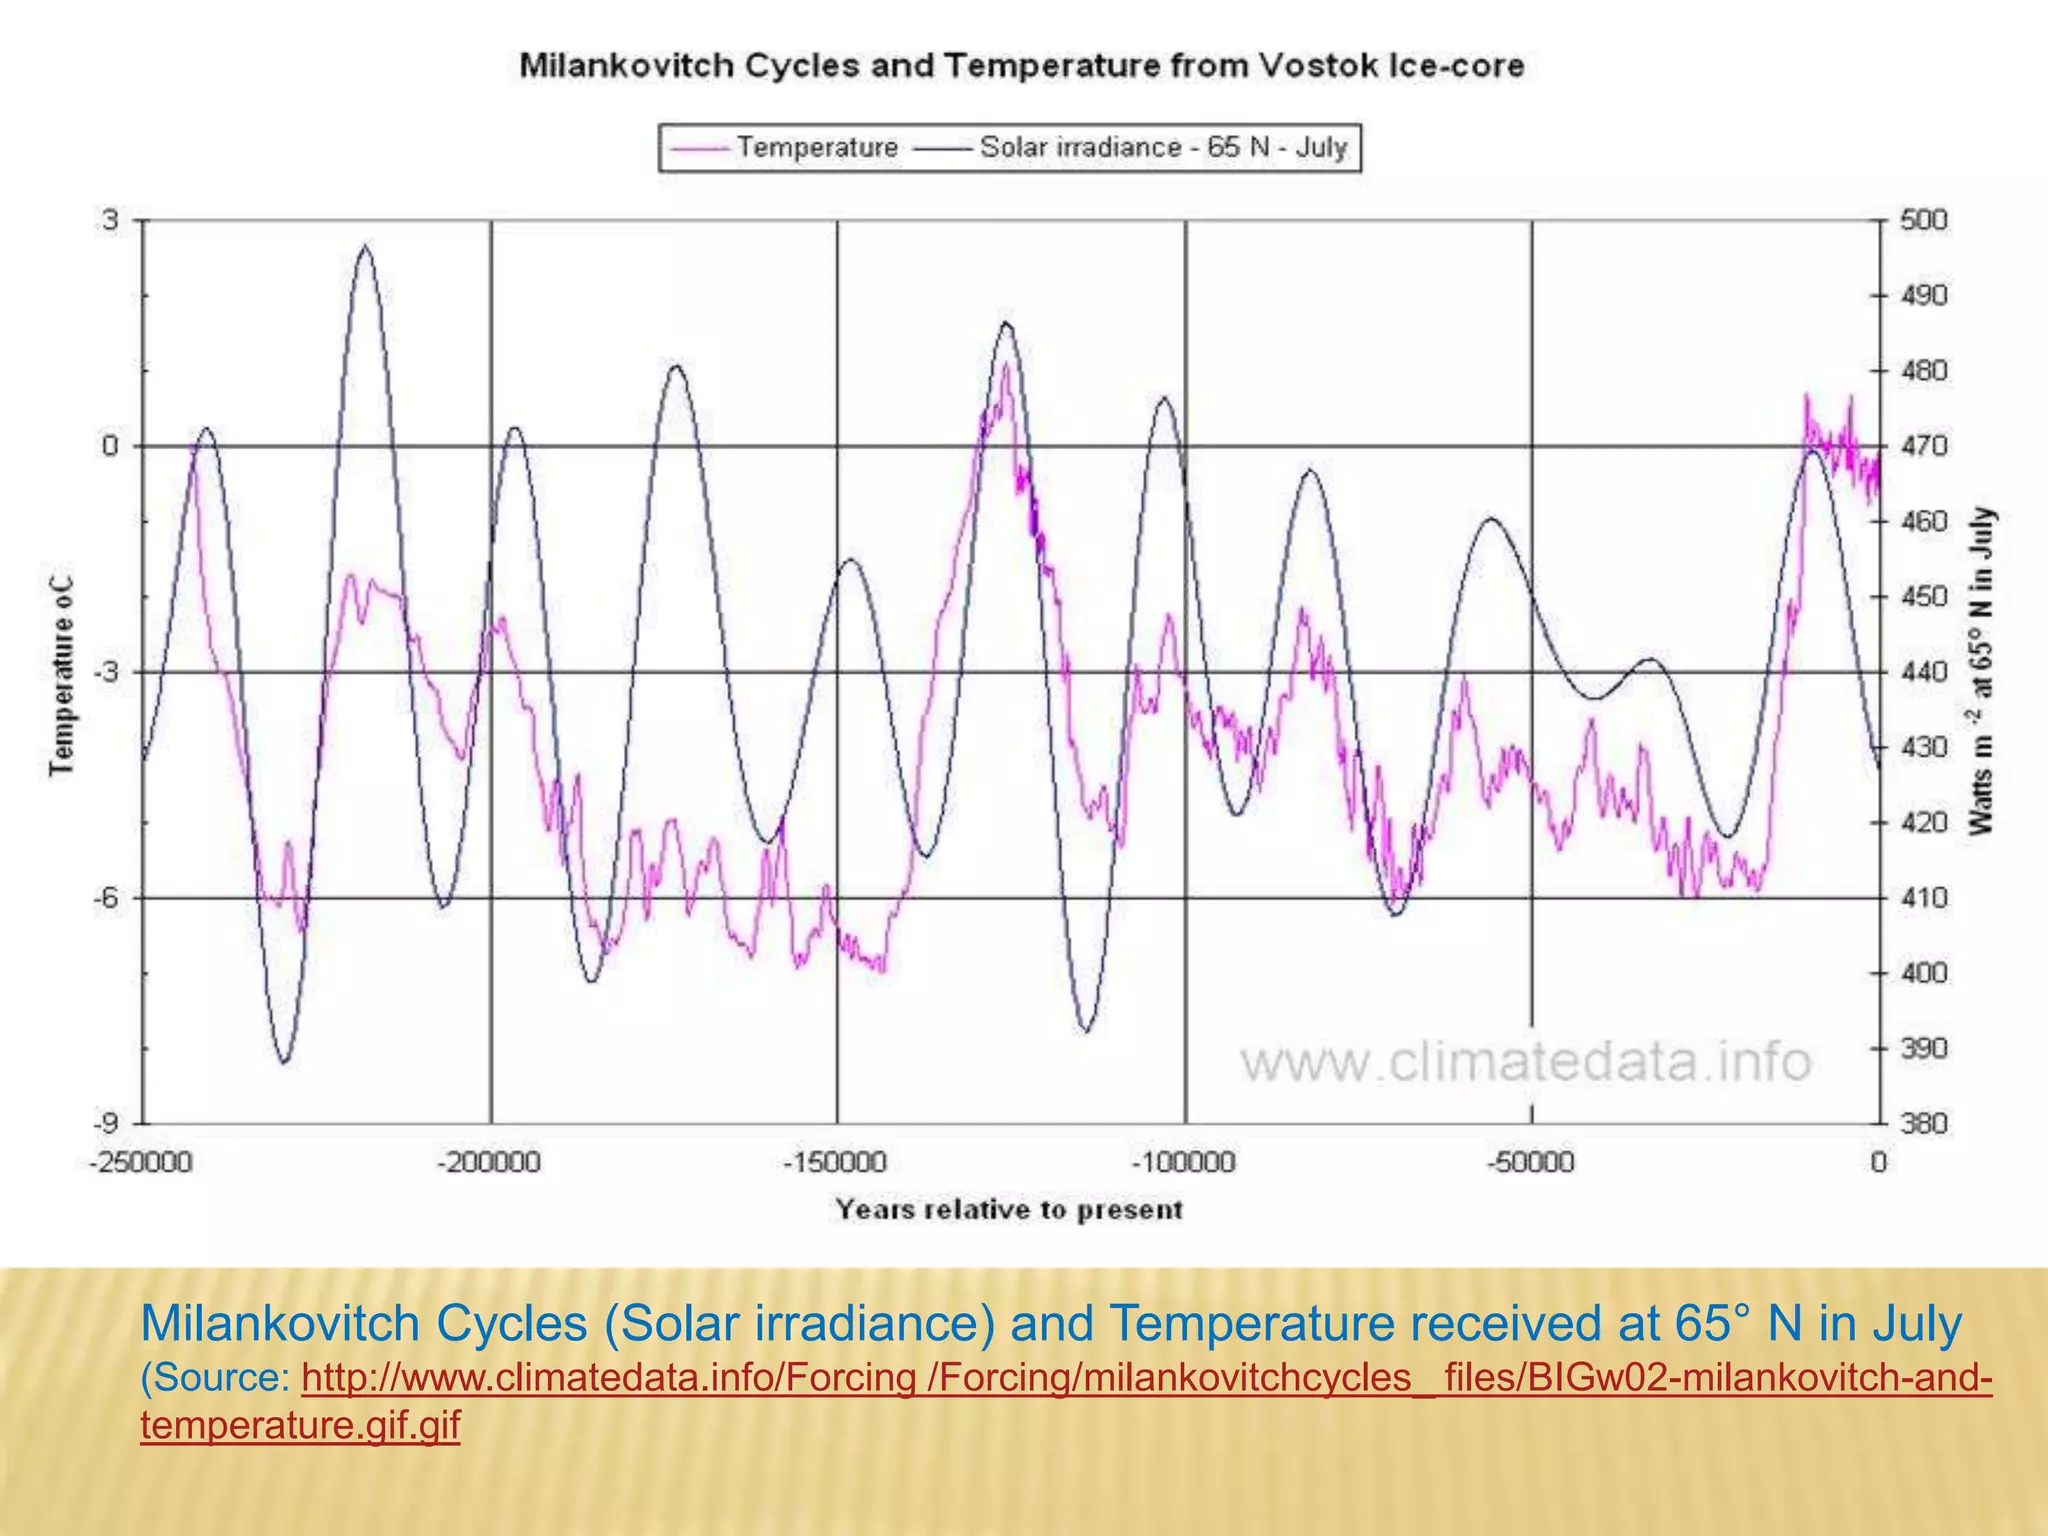
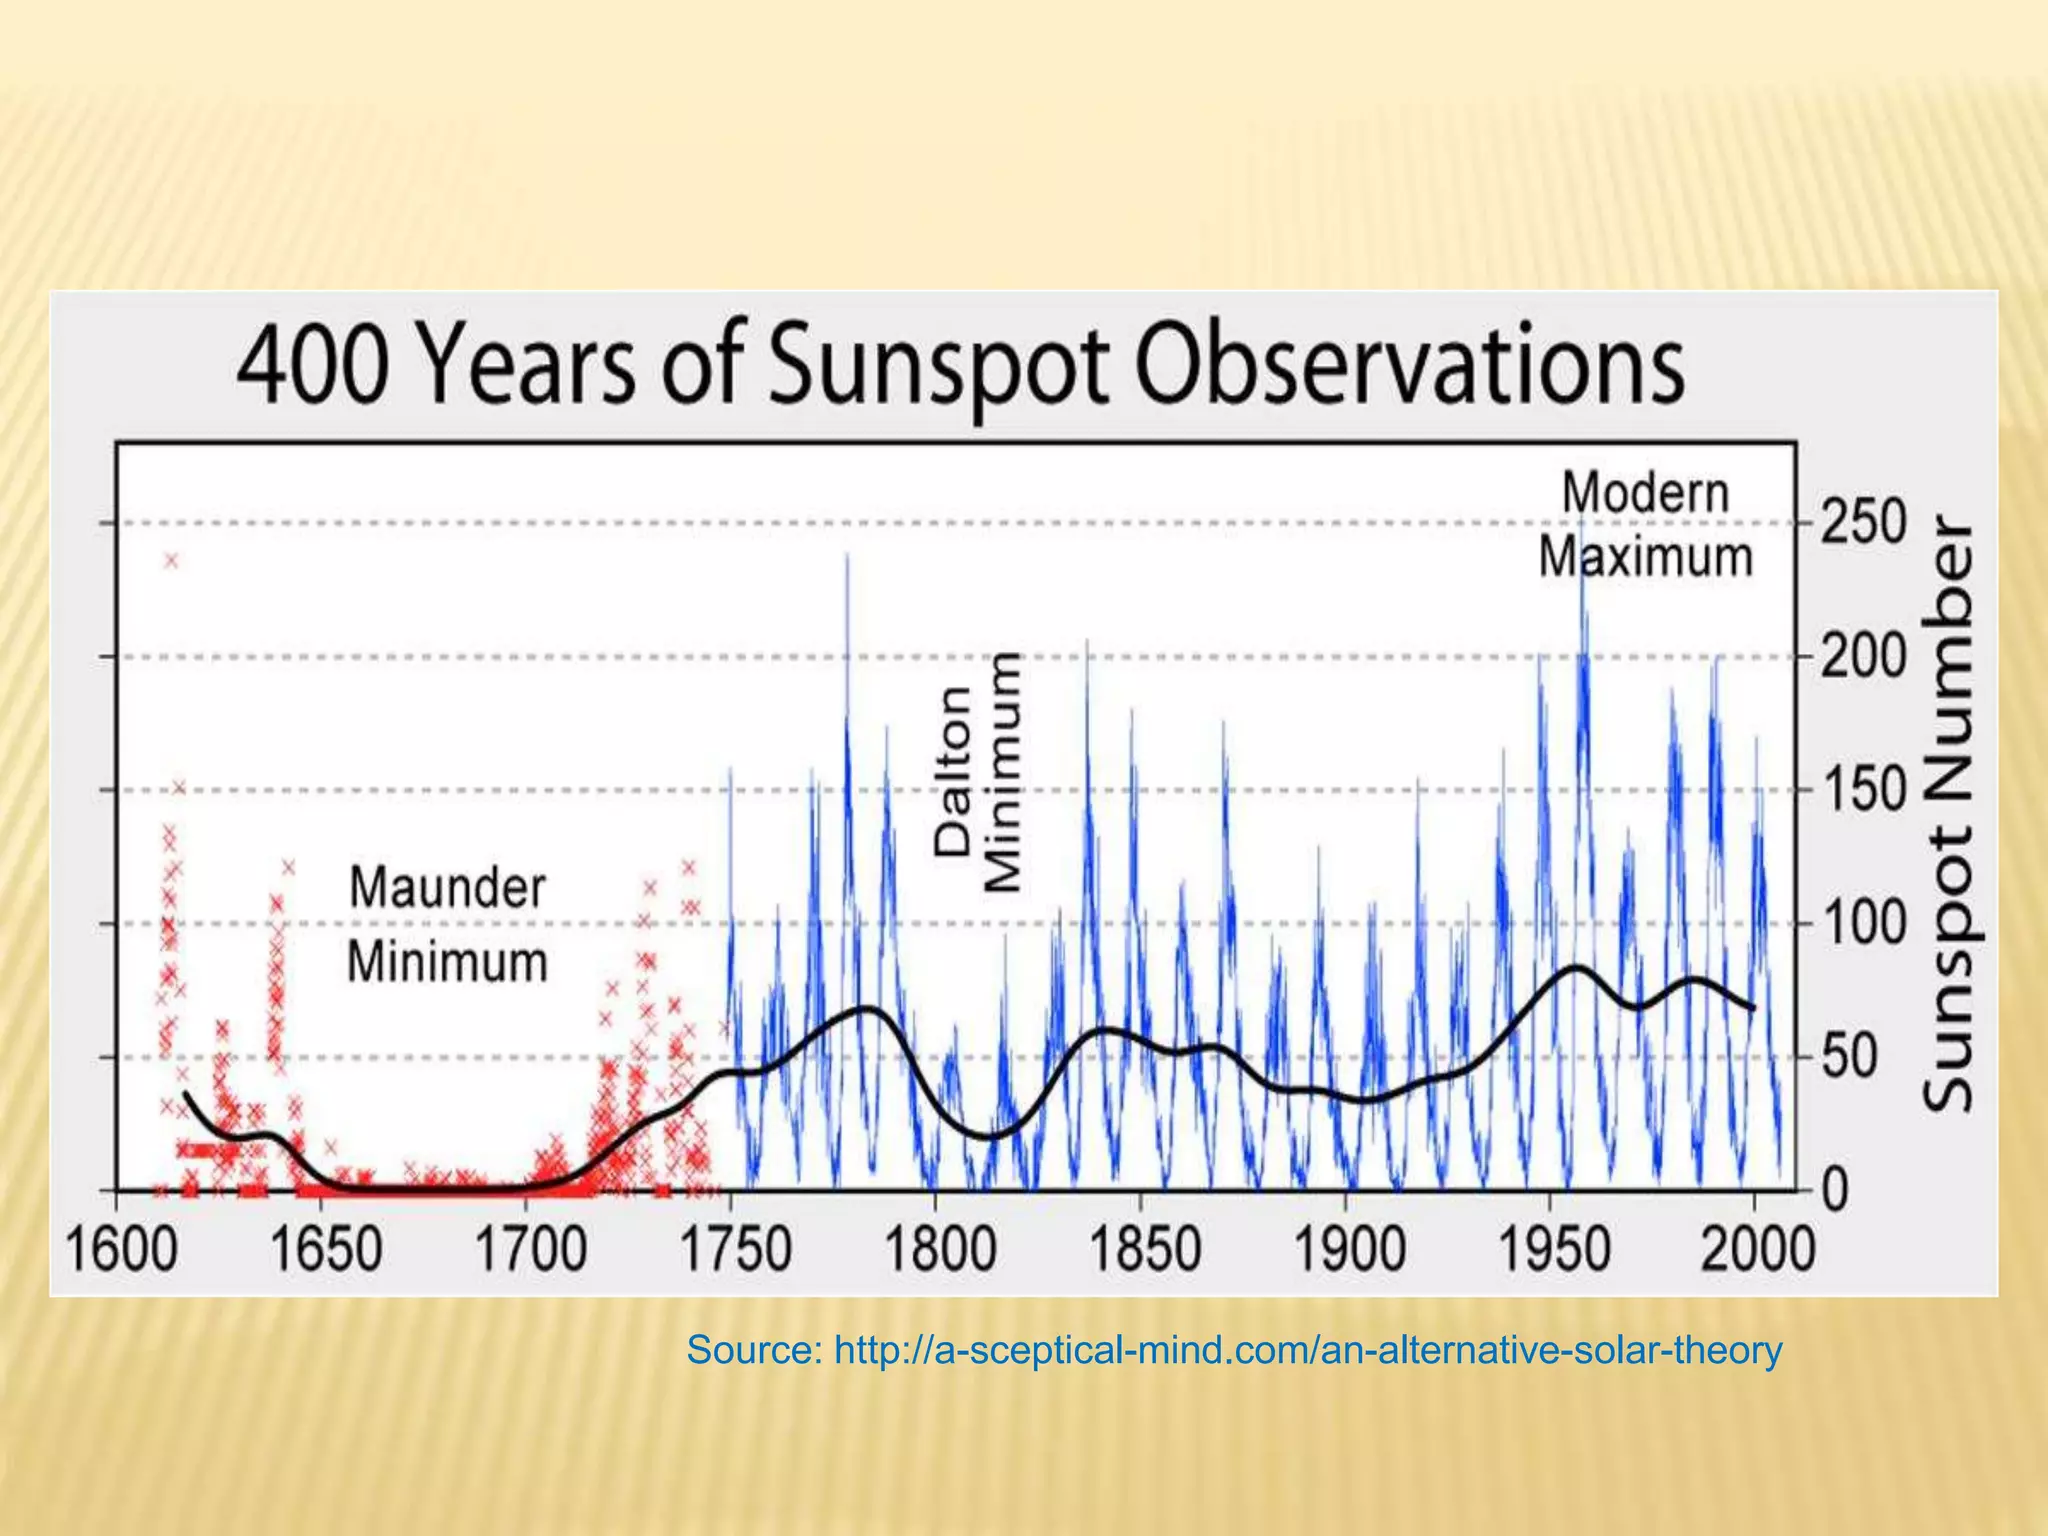
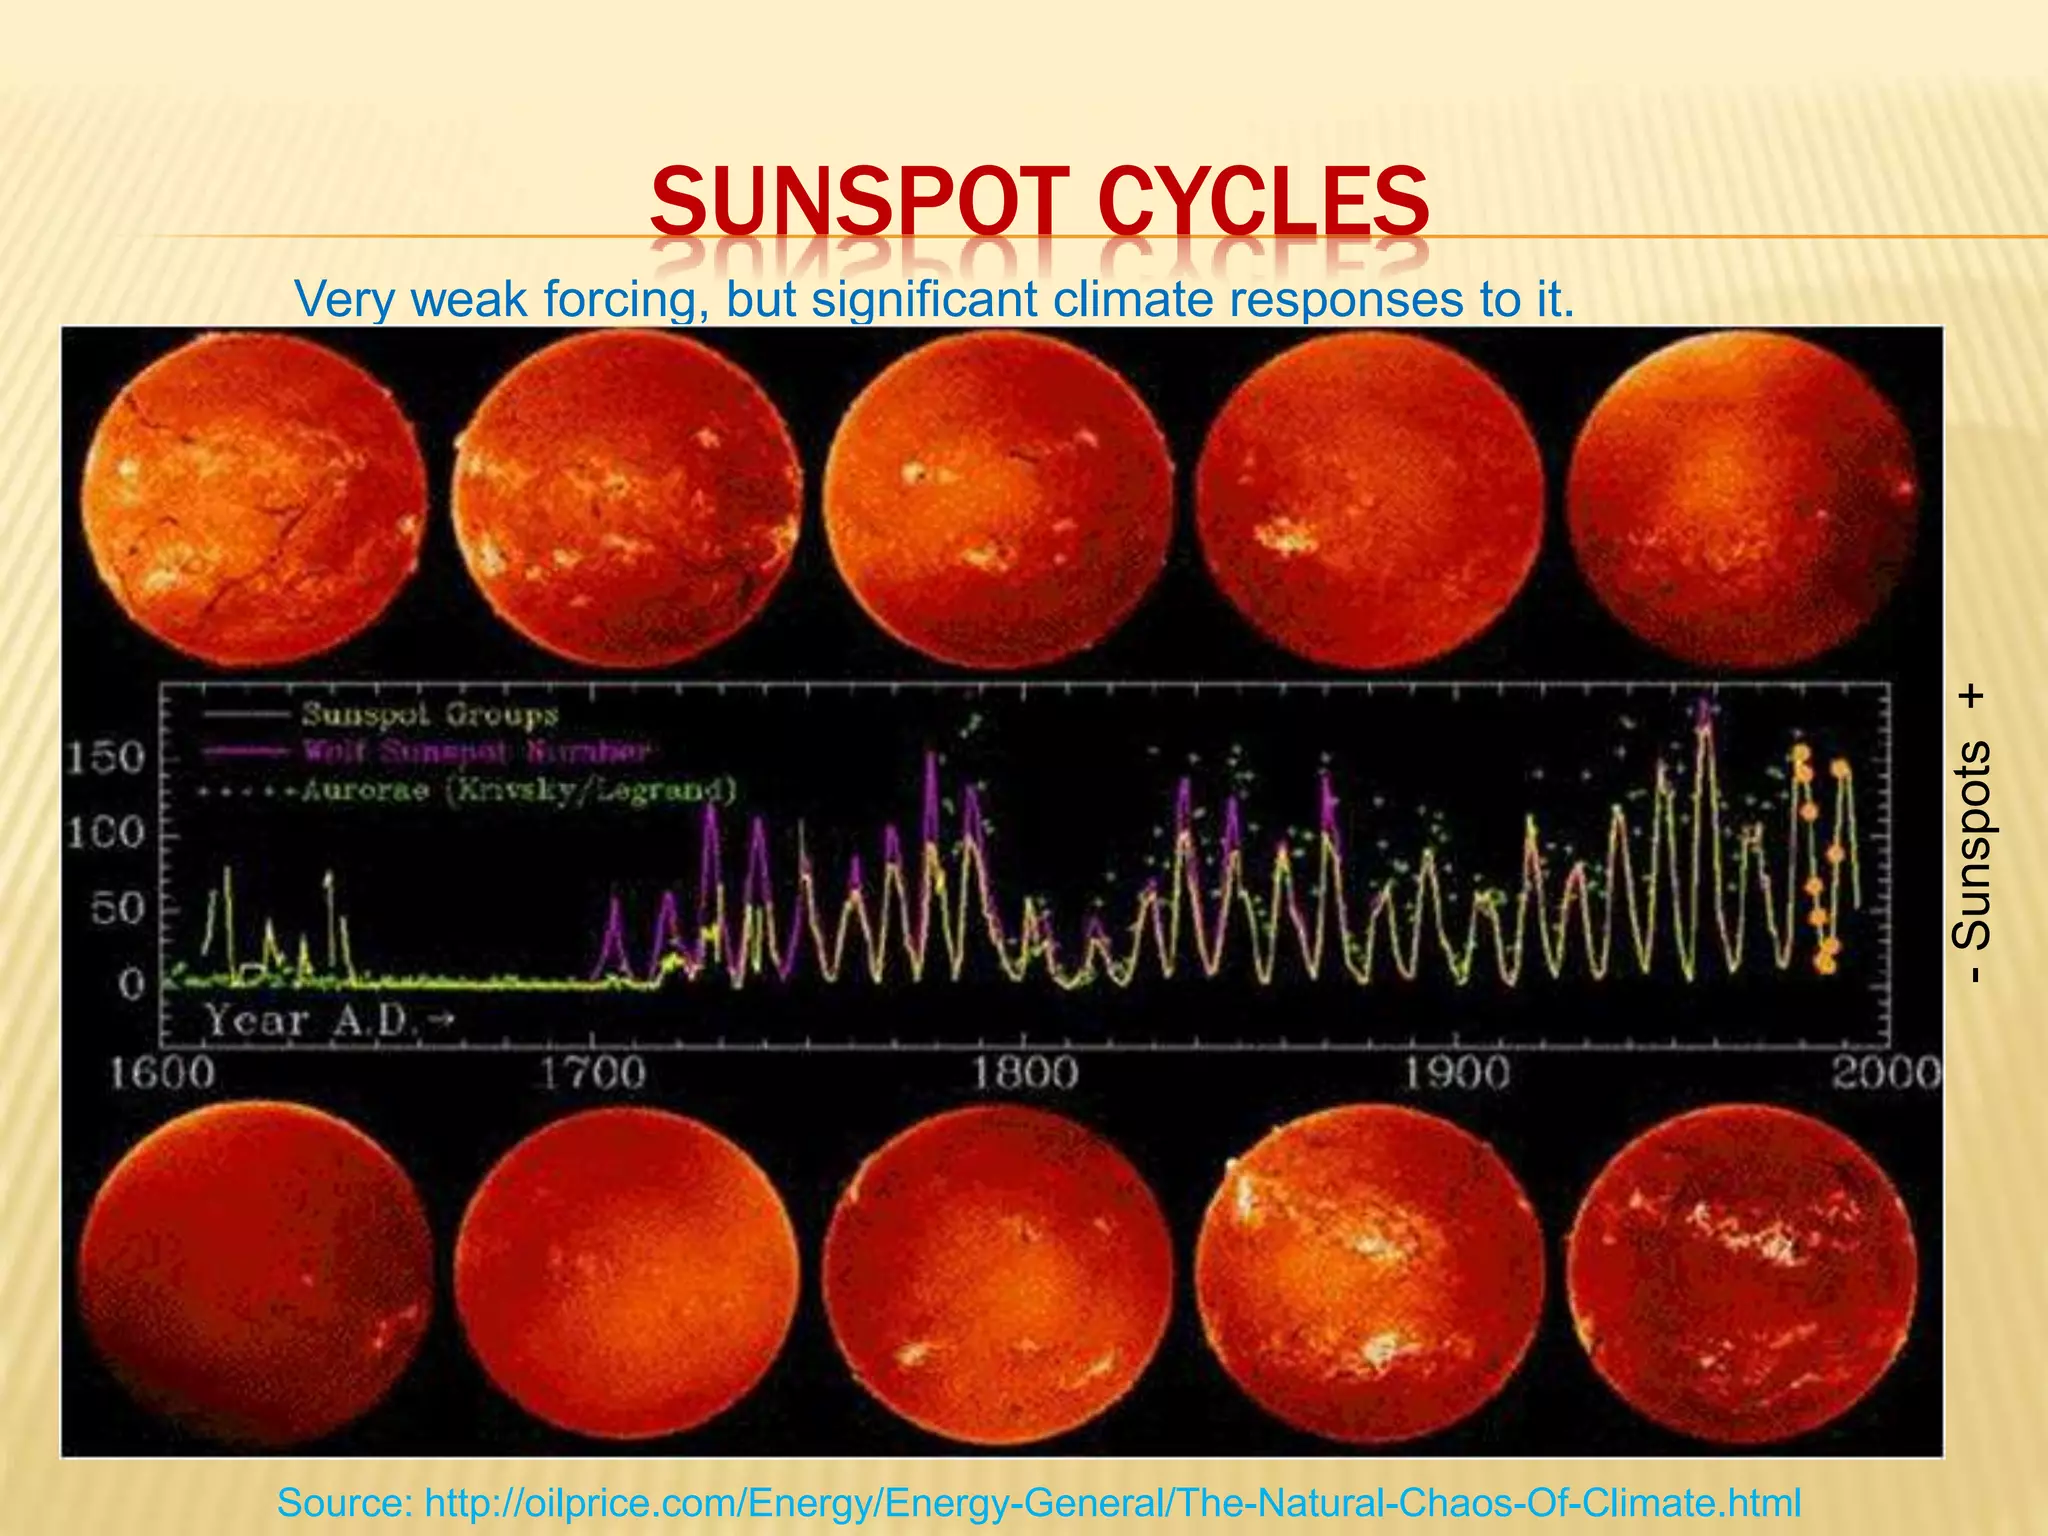
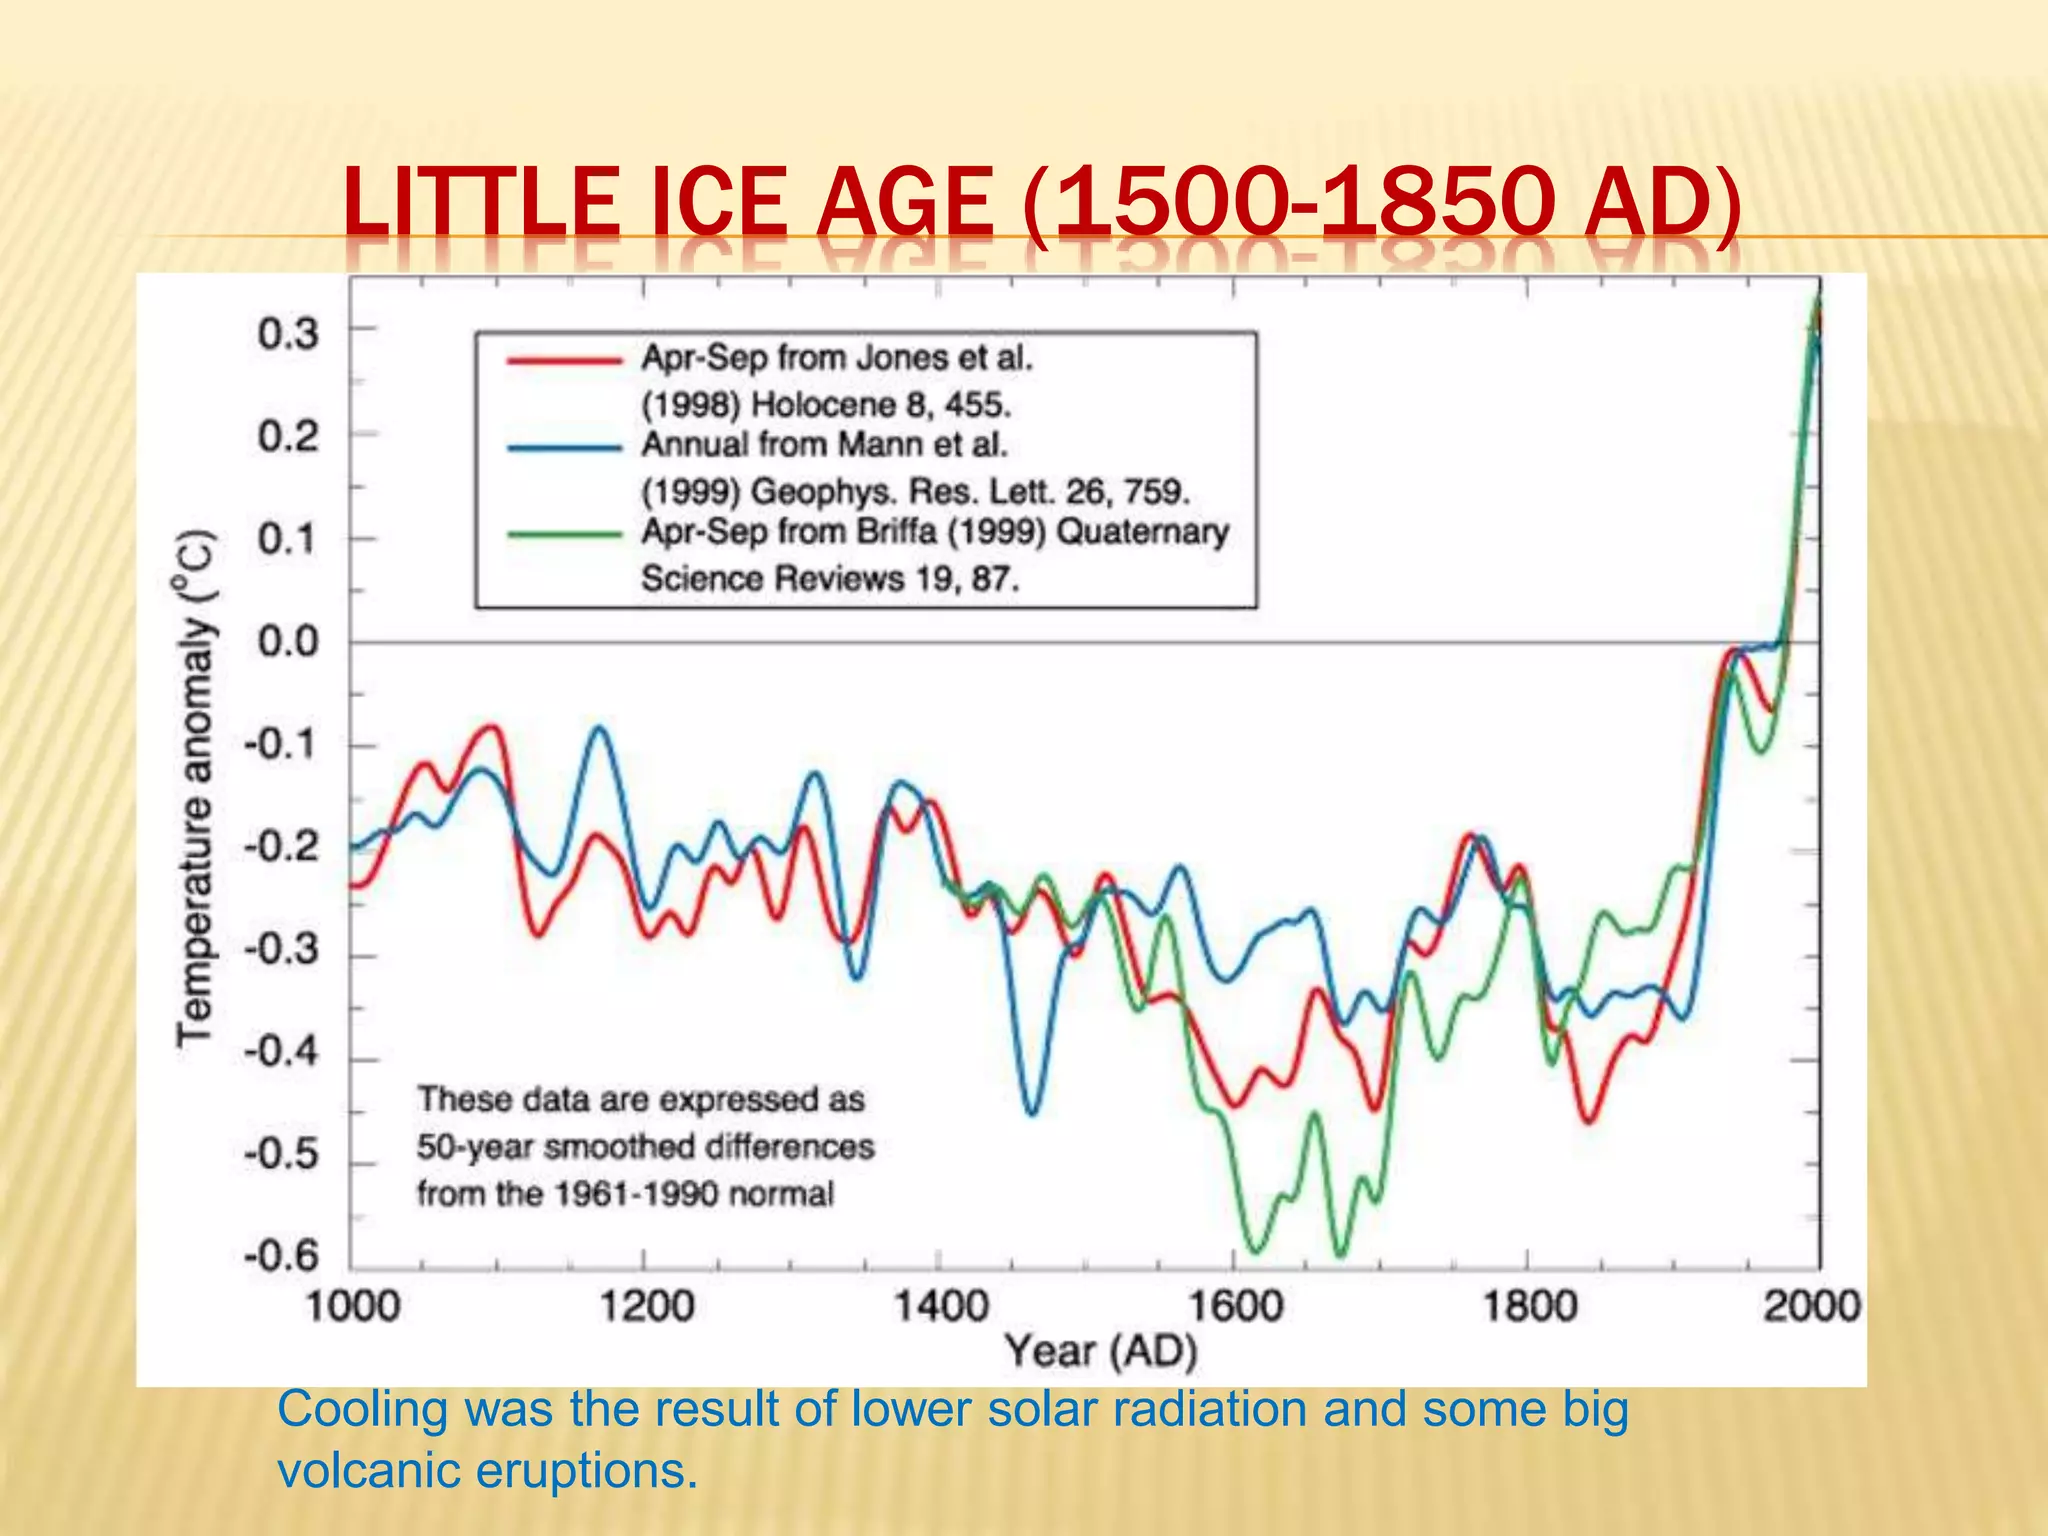
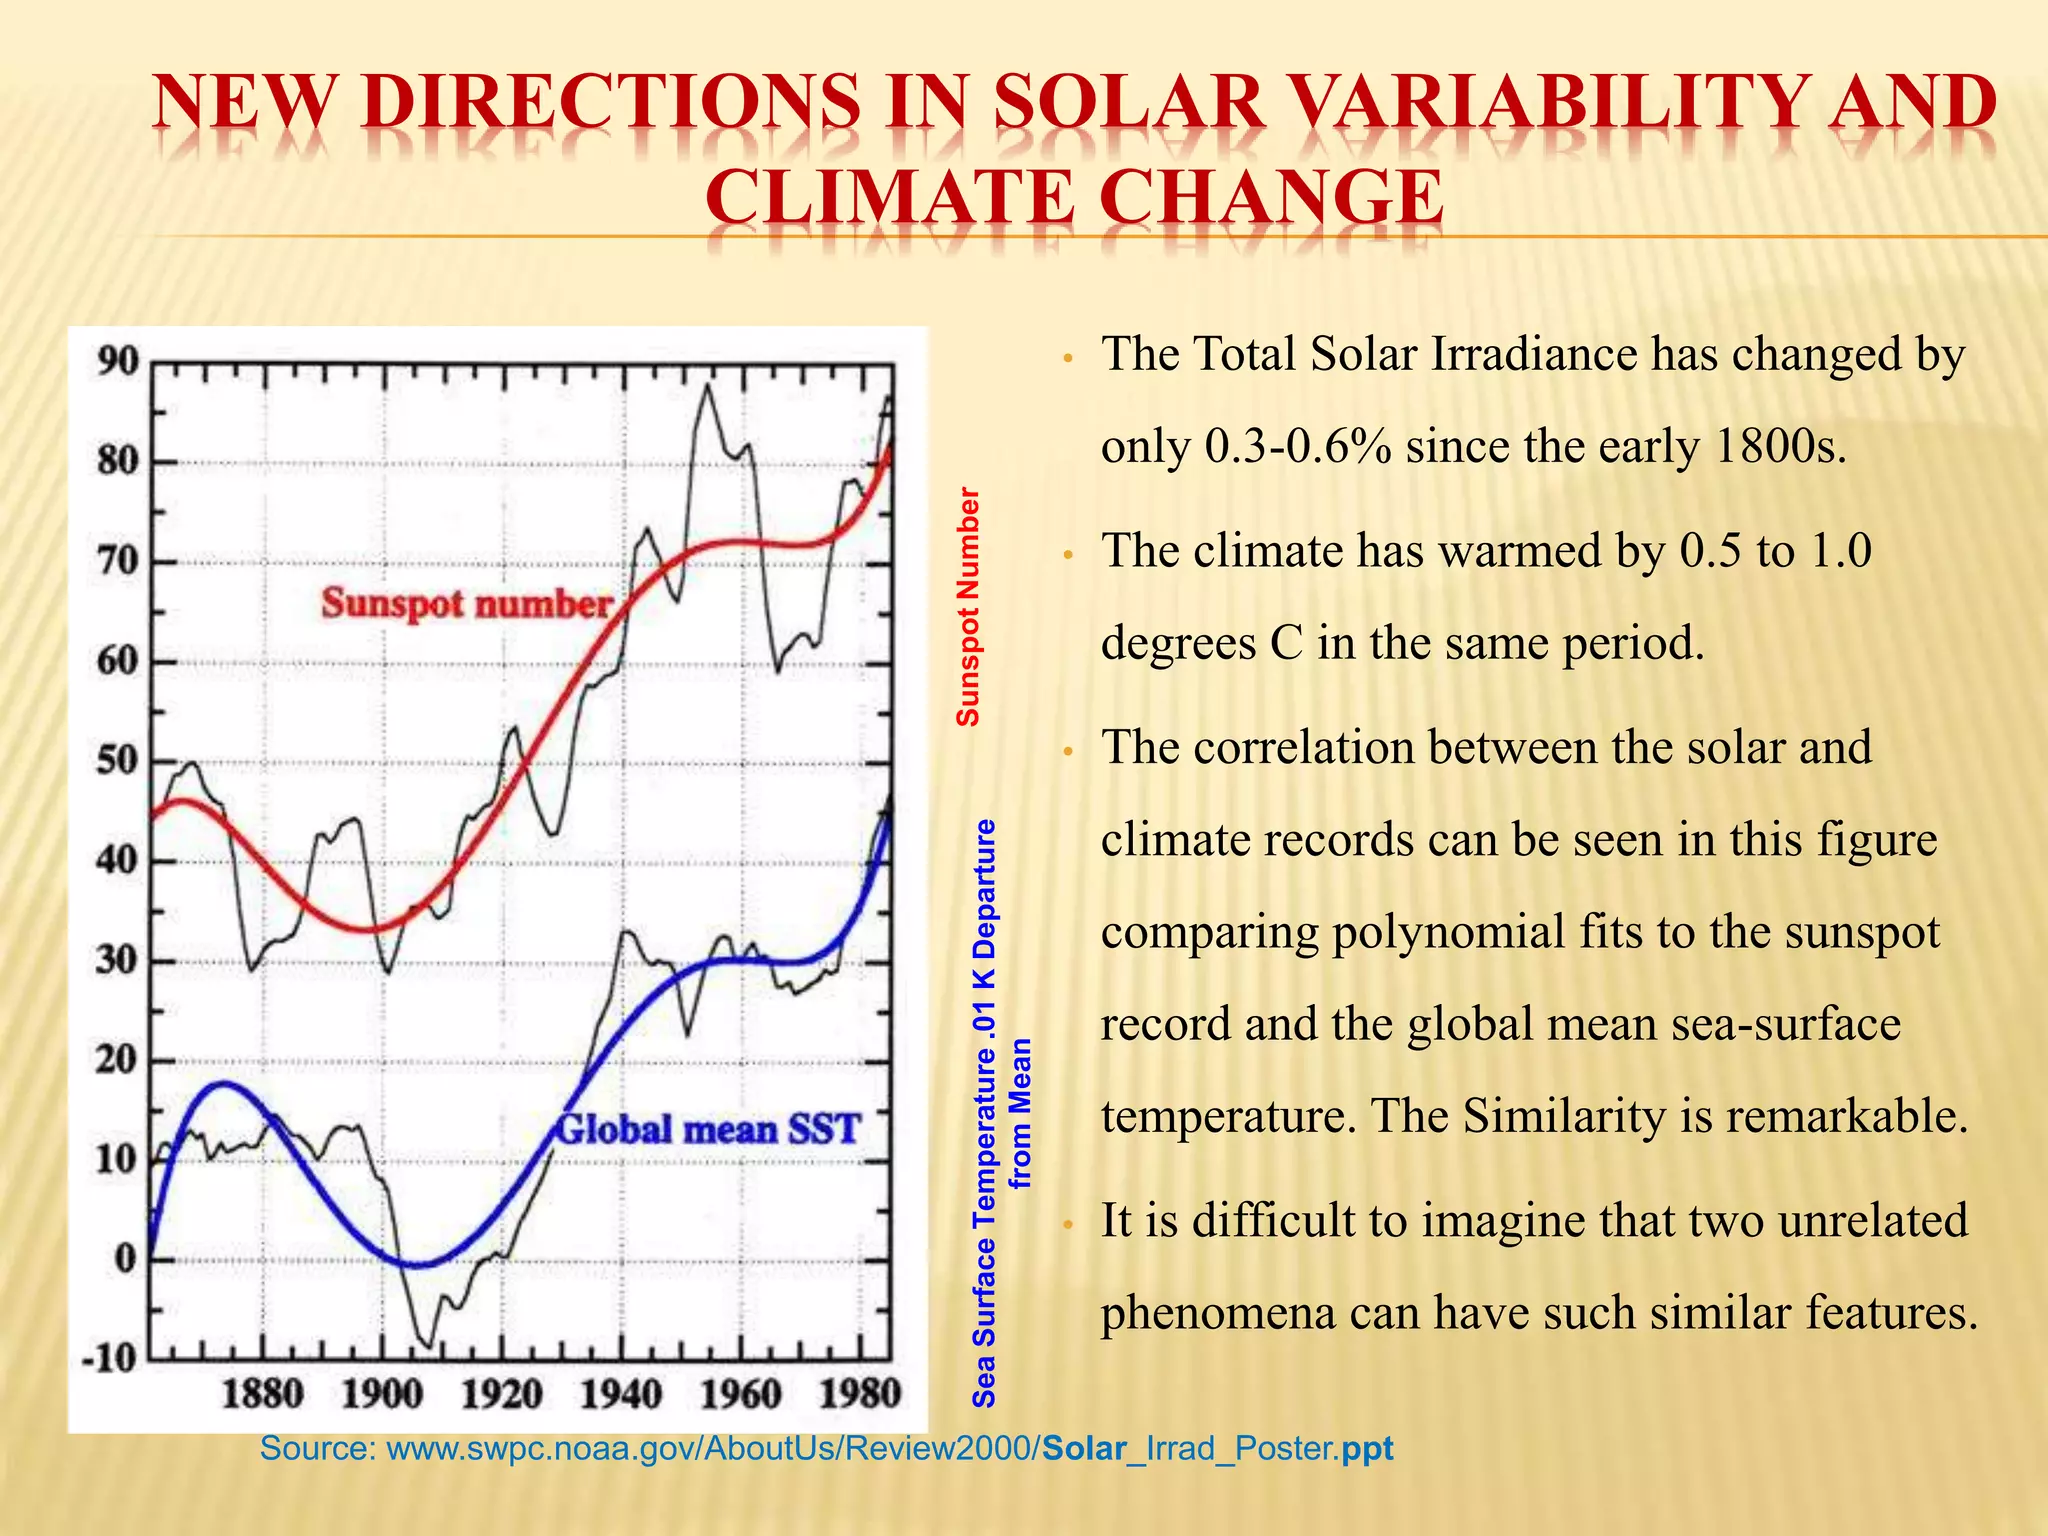
SOLAR VARIATION AND CLIMATIC 
CHANGES 
By- Dr. Vinay Kumar Pandey 
Dr. Ajai Mishra, 
Dr. Shashank Shekhar Mishra
INTRODUCTION 
 Sun covers total 99.86% mass of our 
solar system and 3,33,000 times of the 
Earth mass. 
 Earth is IIIrd planet in the solar system 
and having a unique position due to 
life. Life on Earth depends on energy 
received from the sun. 
 The Sun is the source of energy that 
causes the motion of the atmosphere 
and thereby controls weather and 
climate. Any change in the energy 
from the sun received at the Earth’s 
surface will therefore affect climate. 
 The Earth climate has always being 
changing and well documented in 
historical as well as geological records. 
 The sun has a magnetic field that flips 
approximately every 11 years. Sunspots 
and solar flares are caused by the 
magnetic activity of the sun. 
 The sunspots and solar flares can affect 
the earth by changing the amount of 
incoming sunlight and interacting with 
the earth’s magnetic field.
SUNSPOTS
OBJECTIVE 
 Discuss the solar variation and its effect 
on Earth & climate. 
 Discuss the Past climate change and 
solar variation 
Effect of Solar Activity on Earth Climate
MEASURMENT OF SOLAR VARIATION 
 Solar variation is the change in the amount of radiation emitted by the Sun and in its spectral 
distribution over years to millennia. These variations have periodic components, the main one being 
the approximately 11-year solar cycle. In recent decades, solar activity has been measured by 
satellites, while before it was estimated using proxy variables . 
 Variations in total solar irradiance were too small to detect with technology available before the 
satellite era, although the small fraction in ultra violet light has recently been found to vary 
significantly more than previously thought over the course of a solar cycle. Total solar output is 
now measured to vary (over the last three 11-year sunspot cycles) by approximately 0.1%,or about 
1.3 Watts per square meter (W/m2) peak-to-trough from solar maximum to solar minimum during 
the 11-year sunspot cycle. (Weart & Spencer, 2003) 
 The intensity of solar radiation reaching Earth has been relatively constant through the last 2000 
years, with variations estimated at around 0.1–0.2%. Solar variation, together with volcanic 
activity are hypothesized to have contributed to climate change, for example during the Maunder 
Minimum Changes in solar brightness are too weak to explain recent climate change. (Scafetta N., 
West B. J., 2006)
RECORD OF SOLAR ACTIVITY 
 Chinese observation 1000 year earlier (through loess clouds). 
 European telescopic observation began 1610. 
 14C/12C ratio is high when sunspot number is low. 
 Dating of tree rings demonstrates a pattern of deviations. (Merril and Mc Elhinny, 1983) 
 An active sun result in a strong solar wind; deflects cosmic rays and decrease 14C 
production: positive 14C anomaly= cold climate (Wang et al. 1996). 
 Satellite observations indicate that during 11 year cycle sunspot minimum, solar 
irradiance is lower (0.1%), interplanetary magnetic field weaker. (Radick,1990; Wang et 
al., 1996; Willson, & Hudson 1988; Willson, et al. 1985) .
SOLAR VARIATION AND CLIMATE CHANGE 
 From 1645 to 1715 there were almost no sunspots. This period is called the Maunder 
minimum, the peak of the Little Ice Age, a cool period affecting Europe from the 1300s to the 
1800s. (Eddy, J.A., 1981) 
 Data from 8000 year old bristle cone pine tree indicate 18 periods of sunspot minima in the 
last 7800 years. Maxima of sunspot cycle length occurred in 1770, 1845 & 1940 (Eddy, J.A., 
1981). 
 The Dalton minimum, a 25 year span at the beginning of the 1800s when sunspots were half 
as numerous as normal, corresponds to the end of the Little Ice Age. 
 Some people claim there is a connection between the 22 year solar cycle and the roughly 20 
year drought cycle in the Great Plains. 
 One interesting bit of information is the ozone layer tends to reach a maximum at the same 
time as the solar maximum, allowing the ozone layer to absorb the excess radiation. 
 This is thought to affect the tropical Hadley cell circulation and the tracks of mid-latitude 
cyclones.
Milankovitch Cycles (Solar irradiance) and Temperature received at 65° N in July 
(Source: http://www.climatedata.info/Forcing /Forcing/milankovitchcycles_ files/BIGw02-milankovitch-and-temperature. 
gif.gif
Source: http://a-sceptical-mind.com/an-alternative-solar-theory
SUNSPOT CYCLES 
Very weak forcing, but significant climate responses to it. 
- Sunspots + 
Source: http://oilprice.com/Energy/Energy-General/The-Natural-Chaos-Of-Climate.html
LITTLE ICE AGE (1500-1850 AD) 
Cooling was the result of lower solar radiation and some big 
volcanic eruptions.
NEW DIRECTIONS IN SOLAR VARIABILITY AND 
CLIMATE CHANGE 
• The Total Solar Irradiance has changed by 
only 0.3-0.6% since the early 1800s. 
• The climate has warmed by 0.5 to 1.0 
degrees C in the same period. 
• The correlation between the solar and 
climate records can be seen in this figure 
comparing polynomial fits to the sunspot 
record and the global mean sea-surface 
temperature. The Similarity is remarkable. 
• It is difficult to imagine that two unrelated 
phenomena can have such similar features. 
Sunspot Number 
Sea Surface Temperature .01 K Departure 
from Mean 
Source: www.swpc.noaa.gov/AboutUs/Review2000/Solar_Irrad_Poster.ppt
CONCLUSIONS 
 Solar irradiance variability ranges from 0.1% to factors or 10 or more depending on 
wavelength. There is strong evidence that the past solar output has changed and this 
change has been responsible for changes in the climate. If the sun is cyclic in nature, it 
may be possible to forecast future solar irradiance changes. 
 Forcing is very weak (in visible spectrum), only ±0.1-0.2%, so climate response should 
be weak. 
 Climate response is actually quite high - still not sure why. 
 One possibility is UV part of spectrum - much greater changes (±10%) 
… suggests that global climate is very sensitive
REFERNCES 
 Eddy, J.A. 1981: Climate and the role of the Sun. In Rotberg and Rabb , 145--67 (5) (1981). 
 Wang, L., Wheeler, J. C., Li, Z., & Clocchiatti, A. , ApJ, 467, 435. First citation in article | Cross Ref |ADS 
(1996) 
 Radick, R. R., Lockwood, G. W. & Baliunas, S. L. Science 247, 39−44 (1990). 
 Willson, R. C. & Hudson, H. S. Nature 332, 810−812 (1988). 
 Weart, Spencer. Changing Sun, Changing Climate?. The Discovery of Global Warming . Harvard 
University Press. ISBN 0-674-01157-0. (2003) 
 Lean, Judith . Evolution of the Sun’s spectral Irradiance Since the Maunder Minimum. Geophysical 
Research Letters 27 (16): 2425–8.: (2000)
Solar variation and climatic changes

Solar variation and climatic changes

  • 1.
    SOLAR VARIATION ANDCLIMATIC CHANGES By- Dr. Vinay Kumar Pandey Dr. Ajai Mishra, Dr. Shashank Shekhar Mishra
  • 2.
    INTRODUCTION  Suncovers total 99.86% mass of our solar system and 3,33,000 times of the Earth mass.  Earth is IIIrd planet in the solar system and having a unique position due to life. Life on Earth depends on energy received from the sun.  The Sun is the source of energy that causes the motion of the atmosphere and thereby controls weather and climate. Any change in the energy from the sun received at the Earth’s surface will therefore affect climate.  The Earth climate has always being changing and well documented in historical as well as geological records.  The sun has a magnetic field that flips approximately every 11 years. Sunspots and solar flares are caused by the magnetic activity of the sun.  The sunspots and solar flares can affect the earth by changing the amount of incoming sunlight and interacting with the earth’s magnetic field.
  • 3.
  • 4.
    OBJECTIVE  Discussthe solar variation and its effect on Earth & climate.  Discuss the Past climate change and solar variation Effect of Solar Activity on Earth Climate
  • 5.
    MEASURMENT OF SOLARVARIATION  Solar variation is the change in the amount of radiation emitted by the Sun and in its spectral distribution over years to millennia. These variations have periodic components, the main one being the approximately 11-year solar cycle. In recent decades, solar activity has been measured by satellites, while before it was estimated using proxy variables .  Variations in total solar irradiance were too small to detect with technology available before the satellite era, although the small fraction in ultra violet light has recently been found to vary significantly more than previously thought over the course of a solar cycle. Total solar output is now measured to vary (over the last three 11-year sunspot cycles) by approximately 0.1%,or about 1.3 Watts per square meter (W/m2) peak-to-trough from solar maximum to solar minimum during the 11-year sunspot cycle. (Weart & Spencer, 2003)  The intensity of solar radiation reaching Earth has been relatively constant through the last 2000 years, with variations estimated at around 0.1–0.2%. Solar variation, together with volcanic activity are hypothesized to have contributed to climate change, for example during the Maunder Minimum Changes in solar brightness are too weak to explain recent climate change. (Scafetta N., West B. J., 2006)
  • 6.
    RECORD OF SOLARACTIVITY  Chinese observation 1000 year earlier (through loess clouds).  European telescopic observation began 1610.  14C/12C ratio is high when sunspot number is low.  Dating of tree rings demonstrates a pattern of deviations. (Merril and Mc Elhinny, 1983)  An active sun result in a strong solar wind; deflects cosmic rays and decrease 14C production: positive 14C anomaly= cold climate (Wang et al. 1996).  Satellite observations indicate that during 11 year cycle sunspot minimum, solar irradiance is lower (0.1%), interplanetary magnetic field weaker. (Radick,1990; Wang et al., 1996; Willson, & Hudson 1988; Willson, et al. 1985) .
  • 7.
    SOLAR VARIATION ANDCLIMATE CHANGE  From 1645 to 1715 there were almost no sunspots. This period is called the Maunder minimum, the peak of the Little Ice Age, a cool period affecting Europe from the 1300s to the 1800s. (Eddy, J.A., 1981)  Data from 8000 year old bristle cone pine tree indicate 18 periods of sunspot minima in the last 7800 years. Maxima of sunspot cycle length occurred in 1770, 1845 & 1940 (Eddy, J.A., 1981).  The Dalton minimum, a 25 year span at the beginning of the 1800s when sunspots were half as numerous as normal, corresponds to the end of the Little Ice Age.  Some people claim there is a connection between the 22 year solar cycle and the roughly 20 year drought cycle in the Great Plains.  One interesting bit of information is the ozone layer tends to reach a maximum at the same time as the solar maximum, allowing the ozone layer to absorb the excess radiation.  This is thought to affect the tropical Hadley cell circulation and the tracks of mid-latitude cyclones.
  • 9.
    Milankovitch Cycles (Solarirradiance) and Temperature received at 65° N in July (Source: http://www.climatedata.info/Forcing /Forcing/milankovitchcycles_ files/BIGw02-milankovitch-and-temperature. gif.gif
  • 10.
  • 11.
    SUNSPOT CYCLES Veryweak forcing, but significant climate responses to it. - Sunspots + Source: http://oilprice.com/Energy/Energy-General/The-Natural-Chaos-Of-Climate.html
  • 12.
    LITTLE ICE AGE(1500-1850 AD) Cooling was the result of lower solar radiation and some big volcanic eruptions.
  • 13.
    NEW DIRECTIONS INSOLAR VARIABILITY AND CLIMATE CHANGE • The Total Solar Irradiance has changed by only 0.3-0.6% since the early 1800s. • The climate has warmed by 0.5 to 1.0 degrees C in the same period. • The correlation between the solar and climate records can be seen in this figure comparing polynomial fits to the sunspot record and the global mean sea-surface temperature. The Similarity is remarkable. • It is difficult to imagine that two unrelated phenomena can have such similar features. Sunspot Number Sea Surface Temperature .01 K Departure from Mean Source: www.swpc.noaa.gov/AboutUs/Review2000/Solar_Irrad_Poster.ppt
  • 14.
    CONCLUSIONS  Solarirradiance variability ranges from 0.1% to factors or 10 or more depending on wavelength. There is strong evidence that the past solar output has changed and this change has been responsible for changes in the climate. If the sun is cyclic in nature, it may be possible to forecast future solar irradiance changes.  Forcing is very weak (in visible spectrum), only ±0.1-0.2%, so climate response should be weak.  Climate response is actually quite high - still not sure why.  One possibility is UV part of spectrum - much greater changes (±10%) … suggests that global climate is very sensitive
  • 15.
    REFERNCES  Eddy,J.A. 1981: Climate and the role of the Sun. In Rotberg and Rabb , 145--67 (5) (1981).  Wang, L., Wheeler, J. C., Li, Z., & Clocchiatti, A. , ApJ, 467, 435. First citation in article | Cross Ref |ADS (1996)  Radick, R. R., Lockwood, G. W. & Baliunas, S. L. Science 247, 39−44 (1990).  Willson, R. C. & Hudson, H. S. Nature 332, 810−812 (1988).  Weart, Spencer. Changing Sun, Changing Climate?. The Discovery of Global Warming . Harvard University Press. ISBN 0-674-01157-0. (2003)  Lean, Judith . Evolution of the Sun’s spectral Irradiance Since the Maunder Minimum. Geophysical Research Letters 27 (16): 2425–8.: (2000)