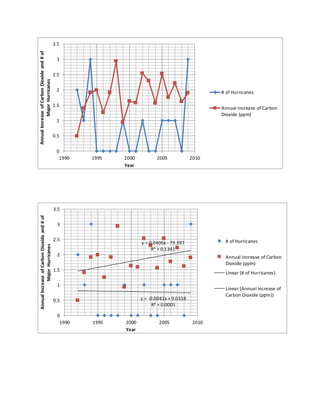
SlideShare a Scribd company logo
1 of 14
The Annual Increase of Carbon Dioxide Levels in Mauna Loa, Hawaii in relation to the
Frequency of Major Hurricanes in the Pacific Ocean (1992- 2009)
Laura Rook
Fort Hays State University
January 11, 2013
Abstract
An experiment was performed to determine the correlation between the annual increase
of carbon dioxide in Mauna Loa, Hawaii and the frequency of major hurricanes in the Pacific
Ocean. The relationship between the two variables is important because it could allow scientists
to better predict when a major hurricane might occur. To determine the relationship between
carbon dioxide and major hurricanes, two sets of data were used. The first data set used
contained the number of hurricanes in the Pacific Ocean from the 1800s to 2011. The data set
was obtained from the National Oceanic and Atmospheric Administration and the Central Pacific
Hurricane Center. The second data set used contained carbon dioxide levels collected in Mauna
Loa, Hawaii from1959-2011. The data set was obtained from the National Climate Data Center
and the National Oceanic and Atmosphere Administration. The data was analyzed for the years
1992-2009 by determining a correlation coefficient as well as a coefficient of determination. It
was found that there is a negative correlation between the two variables which does not agree
with the hypothesis.
Introduction
The question of this project addresses how the annual increase of carbon dioxide affects
the frequency of major hurricanes in the Pacific Ocean. The level of carbon dioxide in the
atmosphere has increased by 35% over the last 150 years alone (Justus, Fletcher, 2001). The
objective of this project is to determine the correlation between the annual increase of carbon
dioxide in Mauna Loa, Hawaii and the frequency of major hurricanes in the Pacific Ocean from
1992 to 2009.
Topics similar to this project have been addressed before but the results were
inconclusive. In the past, scientists have researched whether global warming is a possible source
for an increase in hurricane activity in the Atlantic Ocean. However, the results varied.
According to a report discussing the causes and implications of an increase in Atlantic hurricane
activity, some scientists found an increase in hurricane activity due to global warming while
others found that there was a decrease in hurricane activity (Goldenberg, S. B., Landsea, C. W.,
Mestas-Nuñez, A. M., & Gray, W. M. (2001).
Carbon dioxide is a major component of global warming (Justus, Fletcher, 2001). Human
activities, such as the burning of fossil fuels, have contributed to increased atmospheric carbon
dioxide (CO2) and other trace greenhouse gases. If these gases continue to increase in the
atmosphere at the rate they are going, scientists believe the effects of global warming would
increase significantly through the Earth’s natural heat-trapping “greenhouse effect.” (Justus,
Fletcher, 2001). The increasing levels of carbon dioxide in the Earth’s atmosphere can also cause
an increase in precipitation and surface temperature of the oceans. (Andrews, Timothy, Forster,
Piers M, 2010). Global warming is also causing an underwater heat wave which in turn is
causing ocean temperatures to rise (House of Representatives, 2010). As the temperature of
water increases, it expands. During the last 40 years, this expansion has contributed to 25 percent
of the rising sea level (House of Representatives, 2010). Global warming is causing the sea level
to rise because increasing temperatures are melting ice in the ocean such as glaciers and ice
sheets (Solomon, S., Plattner, G.-K., Knutti, R., & Friedlingstein, P. (2009). A recent study used
current ice discharge data to propose that melting ice sheets will contribute to the rising sea level
by 1-2 meters by 2100 (Solomon, S., Plattner, G.-K., Knutti, R., & Friedlingstein, P. (2009).
Rising sea levels also pose a threat to coastal communities and wildlife by increasing the
vulnerability of tropical storms (House of Representatives, 2010).This is crucial to the
experiment considering that the primary controlling factor for tropical cyclone formation is sea
surface temperature (Anthes, Corell, Holland, Hurrell, MacCracken, Trenberth, 2006). As sea
surface temperatures are increasing, the likelihood of a hurricane increases because warm ocean
water of 82°F provides ample moisture and water vapor to the atmosphere to drive the hurricane
engine (US Department of Commerce, NOAA).
A number of scientists speculate that human activities, which have increased the level of
carbon dioxide (CO2) in the atmosphere by 35% over the last 150 years, are causing an increase
in global temperatures (Justus, Fletcher, 2001). Global temperatures have risen 0.6 C in the last
100 years, and are estimated to rise anywhere from 1.8 C to 7.1C over the next 100 years
(Justus, Fletcher, 2001). The relationships between tropical cyclones and global climate change
are scientifically complex, with great implications for society (Anthes, Corell, Holland, Hurrell,
MacCracken, Trenberth, 2006). An example of this is how a minimal rise in sea level can have
catastrophic consequences when major storms strike (Anthes, Corell, Holland, Hurrell,
MacCracken, Trenberth, 2006). Global-mean precipitation is an important part of the Earth’s
climate system. When the Earth’s global-mean precipitation changes, it can affect many aspects
of the climate system such as surface temperature of the ocean. When the surface temperature
changes, it can cause changes in water vapor, clouds, atmospheric stability and lapse rates. Thus,
changes in surface temperature can influence precipitation processes and lead to changes in
precipitation as well (Andrews, Forster, 2010). Changes in tropical cyclone activity are among
the more consequential results of global climate change. Storm intensity generally increases with
global warming but the results vary in different areas. Storm frequency tends to decreases in the
Southern Hemisphere and North Indian Ocean, but increases in the western North Pacific
(Emanuel, K., Sundararajan, R., & Williams, J. (2008). The five year time period from 1995 to
2000 had the highest level of hurricane activity on record in the North Atlantic Ocean
(Goldenberg, S. B., Landsea, C. W., Mestas-Nuñez, A. M., & Gray, W. M. (2001). The high
level of hurricane activity during the five year time period was the result of increases of North
Atlantic sea surface temperatures and decreases in vertical wind shear (Goldenberg, S. B.,
Landsea, C. W., Mestas-Nuñez, A. M., & Gray, W. M. (2001). The high level of hurricane
activity is expected to continue for another 10 to 40 years (Goldenberg, S. B., Landsea, C. W.,
Mestas-Nuñez, A. M., & Gray, W. M. (2001).
Methodology
As carbon dioxide levels increase in Mauna Loa, Hawaii (Figure 1), the frequency of
major hurricanes in the Pacific Ocean will also increase. This hypothesis was based on the fact
that carbon dioxide is a main component in global warming (Justus, Fletcher, 2001), and the
assumption that the effects of global warming have cause sea surface temperatures to increase.
Since the primary controlling factor for tropical cyclone formation is sea surface temperature
(Anthes, Corell, Holland, Hurrell, MacCracken, Trenberth, 2006), if the sea surface temperature
increased, so would the likelihood of a hurricane. The likelihood of a hurricane would increase
because warm ocean water of 82°F provides ample moisture and water vapor to the atmosphere
to drive the hurricane engine (US Department of Commerce, NOAA). Thus, as carbon dioxide
levels increase, the frequency of major hurricanes will also increase.
The hypothesis was first tested by formatting the two data sets into a Microsoft Excel
spreadsheet. From there the data sets were graphed as shown in Figure 1 and Figure 2, with the
year placed on the X-axis, and the increase of carbon dioxide along with the number of major
hurricanes on the Y-axis. The correlation between the two variables was determined by finding
the correlation coefficient, the coefficient of determination, and a critical value. A correlation
coefficient measures the strength and relationship between two variables (Bluman, A. G. (1995).
Possible values for a correlation coefficient range from negative one to positive one. A value of
negative one represents a strong negative linear correlation between the two variables whereas a
value of positive one represents a strong positive correlation between the two variables (Bluman,
A. G (1995). When there is a weak relationship between the variables the correlation coefficient
will be closer to zero (Bluman, A. G (1995). The symbol r stands for the correlation coefficient
and the coefficient of determination is represented by the symbol r2 (Cox, D. R., & Wermuth, N.
(1992). In order to find the critical value, the coefficient of determination value was multiplied
by 100. If the critical value was found to have a value of ninety five percent or greater than the
critical value was considered significant. However, if the critical value was lower than ninety
five percent then the critical value was not significant. If the value of the correlation coefficient
was found to be significant then the next step in analyzing the data was to find the equation of
the regression line. The regression line is the data’s line of best fit (Bluman, A. G. (1995).
Determining the equation of the regression line helps the researcher to see trends in the data and
make predictions upon the data (Bluman, A. G. (1995).
For this project, two data sets were used. The first was a table containing the number of
hurricanes in the Pacific Ocean for the years 1992 to 2009. The table provided the date and time
of the storm, latitude and longitude, and pressure and wind speed. The table also identified what
category the hurricane was classified as. For this project only hurricanes that reached a wind
speed of 100 mph or greater were classified as major hurricanes. The Saffir-Simpson scale for
categorizing hurricane wind speed and damage potential is being used more and more by
hurricane forecasters. The hurricane categories in the scale are associated by 1-min wind speeds
(Simiu, E., Vickery, P., & Kareem, A. (2007). According to the Saffir- Simpson Hurricane Wind
Scale, hurricanes reaching Category 3 and higher are considered major hurricanes because of
their potential for significant loss of life and damage. However, category 1 and 2 hurricanes are
still very dangerous. Hurricanes with a wind speed of 96 to 110 mph are classified as category 2
hurricanes (NOAA). Both data sets were found on the National Climatic Data Center online
database as well as National Oceanic and Atmospheric Administration and the Central Pacific
Hurricane Center online database.
The first step in processing the data was to format each data set into Microsoft Excel.
This was accomplished my manually typing each data set into an excel spreadsheet. Once both
sets of data were formatted into excel spreadsheets, the data was graphed to provide a visual aide
of the relationship between the two variables during the given time period (Figure 2). The type of
graph that was used was a scatter plot. A scatter plot was chosen because it best represented the
data. The next step in analyzing the data was to determine a correlation coefficient, a coefficient
of determination, and a critical value. The correlation coefficient was determined by using the
CORREL function in Microsoft Excel to find out if the correlation between the annual increase
of carbon dioxide and major hurricanes was positive or negative. The coefficient of
determination was found by squaring the correlation coefficient. The coefficient of determination
was needed to figure the percent of variability on how the frequency of major hurricanes in the
Pacific Ocean was affected by the annual mean increase of carbon dioxide in Mauna Loa,
Hawaii. The critical value was determined by multiplying the coefficient of determination by one
hundred to see whether or not there was a significant correlation.
Results
After processing and analyzing the data, the correlation coefficient between the two data
sets was found to be -0.1429. The correlation coefficient of -0.1429 produced a coefficient of
determination of 0.0204 and a critical value of 2.042%. There were multiple errors within the
data sets for the project. For the hurricane data, these errors included the accuracy of pressure
and wind speed. There were errors within the accuracy of pressure and wind speed because it
may be difficult to measure the exact pressure and wind speed at a specific time. Also, an error in
this data set is the number of hurricanes monitored. There is an error in the number of monitored
hurricanes because if a hurricane was not seen on radar, it would have not been included in the
data set. Also, hurricanes that did not reach a landmass may not have been reported and thus not
included in the data set. There was also an error within the carbon dioxide data however the data
collected from Mauna Loa gives the uncertainty within the data set. The uncertainty of the
annual increase of carbon dioxide in Mauna Loa, Hawaii for each year from 1992 to 2009 is
0.11.
Conclusions and Discussions
The objective of the project was successfully accomplished. The relationship between the
annual increase of carbon dioxide in Mauna Loa, Hawaii and the frequency of major hurricanes
in the Pacific Ocean from 1992 to 2009 was found. The hypothesis stated that as the annual level
of carbon dioxide increases in Mauna Loa, Hawaii, the frequency of major hurricanes in the
Pacific Ocean will also increase. The hypothesis predicted that there would be a positive
correlation between the two variables. However, the hypothesis was found to be incorrect .The
correlation coefficient was found to be -0.1429 which means that the variables had a negative
correlation, not a positive correlation. The negative correlation means that as carbon dioxide
levels are increasing, the frequency of major hurricanes is decreasing. The correlation coefficient
also falls below the critical value which was 2.042%. The research is limited by the number of
major hurricanes that have occurred between 1992 and 2009 in the Pacific Ocean. There were
only a total of fourteen major hurricanes during this time period and there were some years
where no hurricanes occurred.
There are many ways that the research for this project could be extended. First, hurricane
data from the Atlantic Ocean could be used as well as data from the Pacific Ocean. Using data
from both the Atlantic and Pacific Ocean would mean more hurricanes, which would allow the
research of this project to continue. While the results of this project showed that the correlation
between carbon dioxide and hurricanes in the pacific was negative, there may be a different
correlation between carbon dioxide and hurricanes in the Atlantic Ocean. Secondly, carbon
dioxide data collected from regions other than Mauna Loa, Hawaii could be used. This data
could be used instead of the Mauna Loa, Hawaii data or along with the Mauna Loa data. Carbon
dioxide trends could be different depending on the area where the carbon dioxide data was
collected. Carbon dioxide levels in one region might increase while carbon dioxide levels in
another region may decrease. Also, the levels of carbon dioxide in one area might not be as high
as carbon dioxide levels in another area. Another factor that could extend the research of this
project would be to add in more variables to the project. Possible variables that could extend the
research of this project might be precipitation and sea surface temperature. If precipitation and
sea surface temperature were accounted for in the project, scientists would be able to narrow
down exactly what factors affect the frequency of major hurricanes. This could be done by
finding the relationships between each variable and the frequency of major hurricanes. If a
variable was found to have no affect on the frequency of major hurricanes, this would lead
scientists in the right direction to find exactly what variables do affect the frequency of major
hurricanes. Both the precipitation data as well as sea surface temperature data could be found
through the National Climatic Data Center. Also, a possibility for extending the research of this
project would be to change the question of the project entirely. Instead of only focusing on the
relationship between carbon dioxide and major hurricanes, researchers could investigate the
relationship between all tropical systems and carbon dioxide. All tropical systems would include;
hurricanes, tropical depressions, and tropical storms. The results of researching the correlation
between all tropical systems and the annual increase on carbon dioxide could produce an entirely
different correlation all together. By expanding major hurricanes into all tropical systems could
result in a positive correlation rather than the negative correlation produced in the original
experiment. Another possibility for extending the research of this project would be to use a
broader range of data instead of only using data from 1992 until 2009. Using a broader range of
data would allow researchers to look at trends from tropical systems and carbon dioxide in the
past that could be used to predict trends in the future. Thus, using more data in the project could
produce different results than what was originally concluded in this research project.
References
Andrews, T., & Forster, P. M. (2010). The transient response of global-mean precipitation to
increasing carbon dioxide levels. Environmental Research Letters, 5(2), 025212.
doi:10.1088/1748-9326/5/2/025212
Anthes, R. A., Corell, R. W., Holland, G., Hurrell, J. W., MacCracken, M. C., & Trenberth, K. E.
(2006). Hurricanes and global warming-Potential linkages and consequences. Bulletin of the
American Meteorological Society, 87(5), 623–628.
Cao, L., Bala, G., & Caldeira, K. (2011). Why is there a short-term increase in global precipitation in
response to diminished CO2 forcing? Geophysical Research Letters, 38(6), L06703.
doi:10.1029/2011GL046713
Donald R Cahoon, & Geological Survey (U. S.). (1997). Global warming, sea-level rise, and coastal
marsh survival. Reston, Va: USDeptof the Interior, USGeological Survey.
Goldenberg, S. B., Landsea, C. W., Mestas-Nuñez, A. M., & Gray, W. M. (2001). The Recent
Increase in Atlantic Hurricane Activity: Causes and Implications. Science, 293(5529), 474–479.
doi:10.1126/science.1060040
Justus, J. R., & Fletcher, S. R. (2001). Global climate change.
Makarieva, A. M., & Gorshkov, V. G. (2009). Condensation-induced kinematics and dynamics of
cyclones, hurricanes and tornadoes. Physics Letters A, 373(46), 4201–4205.
doi:10.1016/j.physleta.2009.09.023
United States. Congress. House. Select Committee on Energy Independence and Global Warming.
(2010). Rising tides, rising temperatures global warming’s impacts on the oceans : hearing
before the Select Committee on Energy Independence and Global Warming, House of
Representatives, One Hundred Tenth Congress, second session, April 29, 2008.Washington:
USGPO.
Chan, J. C. L. (2006). Comment on “Changes in Tropical Cyclone Number, Duration, and Intensity in
a Warming Environment”. Science,311(5768), 1713b–1713b. doi:10.1126/science.1121522
Solomon, S., Plattner, G.-K., Knutti, R., & Friedlingstein, P. (2009). Irreversible climate change due
to carbon dioxide emissions. Proceedings of the National Academy of Sciences, 106(6), 1704–
1709. doi:10.1073/pnas.0812721106
Emanuel, K., Sundararajan, R., & Williams, J. (2008). Hurricanes and global warming: Results from
downscaling IPCC AR4 simulations. Bulletin of the American Meteorological Society, 89(3),
347–367.
Simiu, E., Vickery, P., & Kareem, A. (2007). Relation between Saffir–Simpson Hurricane Scale Wind
Speeds and Peak 3-s Gust Speeds over Open Terrain. Journal of Structural Engineering, 133(7),
1043–1045. doi:10.1061/(ASCE)0733-9445(2007)133:7(1043)
Bluman, A. G. (1995).Elementary statistics. Brown Melbourne.
Cox, D. R., & Wermuth, N. (1992). A comment on the coefficient of determination for binary
responses. The American Statistician, 46(1), 1–4.
0
0.5
1
1.5
2
2.5
3
3.5
1990 1995 2000 2005 2010
AnnualIncreaseofCarbonDioxideand#of
MajorHurricanes
Year
# of Hurricanes
Annual Increase of Carbon
Dioxide (ppm)
y = -0.0041x + 9.0358
R² = 0.0005
y = 0.0406x - 79.397
R² = 0.1341
0
0.5
1
1.5
2
2.5
3
3.5
1990 1995 2000 2005 2010
AnnualIncreaseofCarbonDioxideand#of
MajorHurricanes
Year
# of Hurricanes
Annual Increase of Carbon
Dioxide (ppm)
Linear (# of Hurricanes)
Linear (Annual Increase of
Carbon Dioxide (ppm))

More Related Content

What's hot

IPCC 2013 report on Climate Change - The Physical Basis
IPCC 2013 report on Climate Change - The Physical BasisIPCC 2013 report on Climate Change - The Physical Basis
IPCC 2013 report on Climate Change - The Physical BasisGreenFacts
 
Animal agriculture adaptation planning guide (climate change)
Animal agriculture adaptation planning guide (climate change)Animal agriculture adaptation planning guide (climate change)
Animal agriculture adaptation planning guide (climate change)LPE Learning Center
 
CSER-Feb 26 2016 v2 no movie.pptx (Read-Only)
CSER-Feb 26 2016 v2 no movie.pptx (Read-Only)CSER-Feb 26 2016 v2 no movie.pptx (Read-Only)
CSER-Feb 26 2016 v2 no movie.pptx (Read-Only)Charlie Kennel
 
Is it weather or is it climate? What is the difference?
Is it weather or is it climate? What is the difference?Is it weather or is it climate? What is the difference?
Is it weather or is it climate? What is the difference?LPE Learning Center
 
Was there a Little Ice Age
Was there a Little Ice AgeWas there a Little Ice Age
Was there a Little Ice AgeAdam Jones
 
Since the introduction of co2
Since the introduction of co2Since the introduction of co2
Since the introduction of co2Attili1996
 
Burntwood 2013 - Why climate models are the greatest feat of modern science, ...
Burntwood 2013 - Why climate models are the greatest feat of modern science, ...Burntwood 2013 - Why climate models are the greatest feat of modern science, ...
Burntwood 2013 - Why climate models are the greatest feat of modern science, ...IES / IAQM
 
Arctic climate Change: observed and modelled temperature and sea-ice variability
Arctic climate Change: observed and modelled temperature and sea-ice variabilityArctic climate Change: observed and modelled temperature and sea-ice variability
Arctic climate Change: observed and modelled temperature and sea-ice variabilitySimoneBoccuccia
 
Modeling the Climate System: Is model-based science like model-based engineer...
Modeling the Climate System: Is model-based science like model-based engineer...Modeling the Climate System: Is model-based science like model-based engineer...
Modeling the Climate System: Is model-based science like model-based engineer...Steve Easterbrook
 
Chelsea Gondeck - Final Thesis
Chelsea Gondeck - Final ThesisChelsea Gondeck - Final Thesis
Chelsea Gondeck - Final ThesisChelsea Gondeck
 
Impact of Future Climate Change on water availability in Kupang City
Impact of Future Climate Change on water availability in Kupang CityImpact of Future Climate Change on water availability in Kupang City
Impact of Future Climate Change on water availability in Kupang CityWillem Sidharno
 
2006 mac michael-climate-human-health
2006 mac michael-climate-human-health2006 mac michael-climate-human-health
2006 mac michael-climate-human-healthLuz Marina
 
Incorporating Climate Tipping Points Into Policy Analysis
Incorporating Climate Tipping Points Into Policy AnalysisIncorporating Climate Tipping Points Into Policy Analysis
Incorporating Climate Tipping Points Into Policy AnalysisOECD Environment
 

What's hot (19)

IPCC 2013 report on Climate Change - The Physical Basis
IPCC 2013 report on Climate Change - The Physical BasisIPCC 2013 report on Climate Change - The Physical Basis
IPCC 2013 report on Climate Change - The Physical Basis
 
Climate Change
Climate ChangeClimate Change
Climate Change
 
Why does climate change?
Why does climate change?Why does climate change?
Why does climate change?
 
Animal agriculture adaptation planning guide (climate change)
Animal agriculture adaptation planning guide (climate change)Animal agriculture adaptation planning guide (climate change)
Animal agriculture adaptation planning guide (climate change)
 
Climate and climate modelling
Climate and climate modellingClimate and climate modelling
Climate and climate modelling
 
CSER-Feb 26 2016 v2 no movie.pptx (Read-Only)
CSER-Feb 26 2016 v2 no movie.pptx (Read-Only)CSER-Feb 26 2016 v2 no movie.pptx (Read-Only)
CSER-Feb 26 2016 v2 no movie.pptx (Read-Only)
 
Is it weather or is it climate? What is the difference?
Is it weather or is it climate? What is the difference?Is it weather or is it climate? What is the difference?
Is it weather or is it climate? What is the difference?
 
Was there a Little Ice Age
Was there a Little Ice AgeWas there a Little Ice Age
Was there a Little Ice Age
 
Avoid ws2 d1_31_fire
Avoid ws2 d1_31_fireAvoid ws2 d1_31_fire
Avoid ws2 d1_31_fire
 
Since the introduction of co2
Since the introduction of co2Since the introduction of co2
Since the introduction of co2
 
Burntwood 2013 - Why climate models are the greatest feat of modern science, ...
Burntwood 2013 - Why climate models are the greatest feat of modern science, ...Burntwood 2013 - Why climate models are the greatest feat of modern science, ...
Burntwood 2013 - Why climate models are the greatest feat of modern science, ...
 
Arctic climate Change: observed and modelled temperature and sea-ice variability
Arctic climate Change: observed and modelled temperature and sea-ice variabilityArctic climate Change: observed and modelled temperature and sea-ice variability
Arctic climate Change: observed and modelled temperature and sea-ice variability
 
Climate change
Climate changeClimate change
Climate change
 
Modeling the Climate System: Is model-based science like model-based engineer...
Modeling the Climate System: Is model-based science like model-based engineer...Modeling the Climate System: Is model-based science like model-based engineer...
Modeling the Climate System: Is model-based science like model-based engineer...
 
Chelsea Gondeck - Final Thesis
Chelsea Gondeck - Final ThesisChelsea Gondeck - Final Thesis
Chelsea Gondeck - Final Thesis
 
Swanston - Climate change Frequently Asked Questions
Swanston - Climate change Frequently Asked QuestionsSwanston - Climate change Frequently Asked Questions
Swanston - Climate change Frequently Asked Questions
 
Impact of Future Climate Change on water availability in Kupang City
Impact of Future Climate Change on water availability in Kupang CityImpact of Future Climate Change on water availability in Kupang City
Impact of Future Climate Change on water availability in Kupang City
 
2006 mac michael-climate-human-health
2006 mac michael-climate-human-health2006 mac michael-climate-human-health
2006 mac michael-climate-human-health
 
Incorporating Climate Tipping Points Into Policy Analysis
Incorporating Climate Tipping Points Into Policy AnalysisIncorporating Climate Tipping Points Into Policy Analysis
Incorporating Climate Tipping Points Into Policy Analysis
 

Viewers also liked

Características de adobe flash
Características de adobe flashCaracterísticas de adobe flash
Características de adobe flashDaniela Yunuen
 
CTI Event Solutions
CTI Event SolutionsCTI Event Solutions
CTI Event SolutionsTom Koch
 
Radio Frequency Identification
Radio Frequency IdentificationRadio Frequency Identification
Radio Frequency IdentificationNadeem Raza
 
Ալիսա Գլորիկ
Ալիսա ԳլորիկԱլիսա Գլորիկ
Ալիսա Գլորիկashkhen1983
 
好美的晨霧
好美的晨霧好美的晨霧
好美的晨霧Jaing Lai
 
Presentación1 bullying
Presentación1 bullyingPresentación1 bullying
Presentación1 bullyingcarhuavilca
 
Alutec - Les lunettes hightech
Alutec - Les lunettes hightechAlutec - Les lunettes hightech
Alutec - Les lunettes hightechMinnovarc
 
Tutorial 1 gbi (1)
Tutorial 1 gbi (1)Tutorial 1 gbi (1)
Tutorial 1 gbi (1)YinettC
 
Practica pp slideshare
Practica pp slidesharePractica pp slideshare
Practica pp slidesharesaul350
 

Viewers also liked (19)

1escr trabad-bl
1escr trabad-bl1escr trabad-bl
1escr trabad-bl
 
Digipatum nare
Digipatum nareDigipatum nare
Digipatum nare
 
Características de adobe flash
Características de adobe flashCaracterísticas de adobe flash
Características de adobe flash
 
DNA REPARATION
DNA REPARATIONDNA REPARATION
DNA REPARATION
 
The Backup Care Alternative
The Backup Care AlternativeThe Backup Care Alternative
The Backup Care Alternative
 
CTI Event Solutions
CTI Event SolutionsCTI Event Solutions
CTI Event Solutions
 
Gmlyat
GmlyatGmlyat
Gmlyat
 
Calendario feb2014
Calendario feb2014Calendario feb2014
Calendario feb2014
 
Radio Frequency Identification
Radio Frequency IdentificationRadio Frequency Identification
Radio Frequency Identification
 
Ալիսա Գլորիկ
Ալիսա ԳլորիկԱլիսա Գլորիկ
Ալիսա Գլորիկ
 
Hipster
HipsterHipster
Hipster
 
Juego didactico
Juego didacticoJuego didactico
Juego didactico
 
好美的晨霧
好美的晨霧好美的晨霧
好美的晨霧
 
Presentación1 bullying
Presentación1 bullyingPresentación1 bullying
Presentación1 bullying
 
Alutec - Les lunettes hightech
Alutec - Les lunettes hightechAlutec - Les lunettes hightech
Alutec - Les lunettes hightech
 
Tutorial 1 gbi (1)
Tutorial 1 gbi (1)Tutorial 1 gbi (1)
Tutorial 1 gbi (1)
 
Practica pp slideshare
Practica pp slidesharePractica pp slideshare
Practica pp slideshare
 
Choro Bororo (deutsch)
Choro Bororo (deutsch)Choro Bororo (deutsch)
Choro Bororo (deutsch)
 
Oficina 2.0
Oficina 2.0Oficina 2.0
Oficina 2.0
 

Similar to UndergradResearch

diurnal temperature range trend over North Carolina and the associated mechan...
diurnal temperature range trend over North Carolina and the associated mechan...diurnal temperature range trend over North Carolina and the associated mechan...
diurnal temperature range trend over North Carolina and the associated mechan...Sayem Zaman, Ph.D, PE.
 
Running head GLOBAL WARMING1 .docx
Running head GLOBAL WARMING1 .docxRunning head GLOBAL WARMING1 .docx
Running head GLOBAL WARMING1 .docxjeanettehully
 
Research Proposal
Research ProposalResearch Proposal
Research Proposaltrisol1
 
IB Extended Essay Sample APA 2018-2019 by WritingMetier.com
IB Extended Essay Sample APA 2018-2019 by WritingMetier.comIB Extended Essay Sample APA 2018-2019 by WritingMetier.com
IB Extended Essay Sample APA 2018-2019 by WritingMetier.comWriting Metier
 
Netherlands.14 november2012 james hansen
Netherlands.14 november2012 james hansenNetherlands.14 november2012 james hansen
Netherlands.14 november2012 james hansenUrgenda
 
Running Head CLIMATE CHANGE 1CLIMATE CHANGE 1CLIMAT.docx
Running Head CLIMATE CHANGE 1CLIMATE CHANGE 1CLIMAT.docxRunning Head CLIMATE CHANGE 1CLIMATE CHANGE 1CLIMAT.docx
Running Head CLIMATE CHANGE 1CLIMATE CHANGE 1CLIMAT.docxjoellemurphey
 
2006 macmichael-climate-human-health-130820192905-phpapp01
2006 macmichael-climate-human-health-130820192905-phpapp012006 macmichael-climate-human-health-130820192905-phpapp01
2006 macmichael-climate-human-health-130820192905-phpapp01Yasbleidy Pulgarin
 
Global Warming and Climate Change Global Warming and Climate C.docx
Global Warming and Climate Change Global Warming and Climate C.docxGlobal Warming and Climate Change Global Warming and Climate C.docx
Global Warming and Climate Change Global Warming and Climate C.docxgilbertkpeters11344
 
A Brief Note On Floods And Its Effects On Human Beings
A Brief Note On Floods And Its Effects On Human BeingsA Brief Note On Floods And Its Effects On Human Beings
A Brief Note On Floods And Its Effects On Human BeingsHeather Dionne
 
Kc 1BProENGL 130214 October 2019Climate ChangeIntrod.docx
Kc 1BProENGL 130214 October 2019Climate ChangeIntrod.docxKc 1BProENGL 130214 October 2019Climate ChangeIntrod.docx
Kc 1BProENGL 130214 October 2019Climate ChangeIntrod.docxcroysierkathey
 
Climate, Hurricanes, & Truth
Climate, Hurricanes, & TruthClimate, Hurricanes, & Truth
Climate, Hurricanes, & TruthPaul H. Carr
 
WebbACPM15gdhjggder59jgfhjfsfhhbvvgv.ppt
WebbACPM15gdhjggder59jgfhjfsfhhbvvgv.pptWebbACPM15gdhjggder59jgfhjfsfhhbvvgv.ppt
WebbACPM15gdhjggder59jgfhjfsfhhbvvgv.pptSravyaPendem1
 
Climate Change Effects on Dengue Fever and Chagas' Disease
Climate Change Effects on Dengue Fever and Chagas' DiseaseClimate Change Effects on Dengue Fever and Chagas' Disease
Climate Change Effects on Dengue Fever and Chagas' DiseaseAbigail Lukowicz
 
impactos del cambio climatico en ecosistemas costeros
 impactos del cambio climatico en ecosistemas costeros impactos del cambio climatico en ecosistemas costeros
impactos del cambio climatico en ecosistemas costerosXin San
 
Climate Change in a Nutshell
Climate Change in a NutshellClimate Change in a Nutshell
Climate Change in a NutshellPadraig Fagan
 

Similar to UndergradResearch (20)

diurnal temperature range trend over North Carolina and the associated mechan...
diurnal temperature range trend over North Carolina and the associated mechan...diurnal temperature range trend over North Carolina and the associated mechan...
diurnal temperature range trend over North Carolina and the associated mechan...
 
Running head GLOBAL WARMING1 .docx
Running head GLOBAL WARMING1 .docxRunning head GLOBAL WARMING1 .docx
Running head GLOBAL WARMING1 .docx
 
Research Proposal
Research ProposalResearch Proposal
Research Proposal
 
shweta singh4.pdf
shweta singh4.pdfshweta singh4.pdf
shweta singh4.pdf
 
Climate Science Explained by Team Norvergence
Climate Science Explained by Team NorvergenceClimate Science Explained by Team Norvergence
Climate Science Explained by Team Norvergence
 
An Expanded Critique of Some Climate Conclusions
An Expanded Critique of Some Climate ConclusionsAn Expanded Critique of Some Climate Conclusions
An Expanded Critique of Some Climate Conclusions
 
IB Extended Essay Sample APA 2018-2019 by WritingMetier.com
IB Extended Essay Sample APA 2018-2019 by WritingMetier.comIB Extended Essay Sample APA 2018-2019 by WritingMetier.com
IB Extended Essay Sample APA 2018-2019 by WritingMetier.com
 
Netherlands.14 november2012 james hansen
Netherlands.14 november2012 james hansenNetherlands.14 november2012 james hansen
Netherlands.14 november2012 james hansen
 
Running Head CLIMATE CHANGE 1CLIMATE CHANGE 1CLIMAT.docx
Running Head CLIMATE CHANGE 1CLIMATE CHANGE 1CLIMAT.docxRunning Head CLIMATE CHANGE 1CLIMATE CHANGE 1CLIMAT.docx
Running Head CLIMATE CHANGE 1CLIMATE CHANGE 1CLIMAT.docx
 
2006 macmichael-climate-human-health-130820192905-phpapp01
2006 macmichael-climate-human-health-130820192905-phpapp012006 macmichael-climate-human-health-130820192905-phpapp01
2006 macmichael-climate-human-health-130820192905-phpapp01
 
Global Warming and Climate Change Global Warming and Climate C.docx
Global Warming and Climate Change Global Warming and Climate C.docxGlobal Warming and Climate Change Global Warming and Climate C.docx
Global Warming and Climate Change Global Warming and Climate C.docx
 
A Brief Note On Floods And Its Effects On Human Beings
A Brief Note On Floods And Its Effects On Human BeingsA Brief Note On Floods And Its Effects On Human Beings
A Brief Note On Floods And Its Effects On Human Beings
 
Kc 1BProENGL 130214 October 2019Climate ChangeIntrod.docx
Kc 1BProENGL 130214 October 2019Climate ChangeIntrod.docxKc 1BProENGL 130214 October 2019Climate ChangeIntrod.docx
Kc 1BProENGL 130214 October 2019Climate ChangeIntrod.docx
 
Climate, Hurricanes, & Truth
Climate, Hurricanes, & TruthClimate, Hurricanes, & Truth
Climate, Hurricanes, & Truth
 
WebbACPM15gdhjggder59jgfhjfsfhhbvvgv.ppt
WebbACPM15gdhjggder59jgfhjfsfhhbvvgv.pptWebbACPM15gdhjggder59jgfhjfsfhhbvvgv.ppt
WebbACPM15gdhjggder59jgfhjfsfhhbvvgv.ppt
 
Climate Change Effects on Dengue Fever and Chagas' Disease
Climate Change Effects on Dengue Fever and Chagas' DiseaseClimate Change Effects on Dengue Fever and Chagas' Disease
Climate Change Effects on Dengue Fever and Chagas' Disease
 
impactos del cambio climatico en ecosistemas costeros
 impactos del cambio climatico en ecosistemas costeros impactos del cambio climatico en ecosistemas costeros
impactos del cambio climatico en ecosistemas costeros
 
Avoid ws2 d1_31_fire
Avoid ws2 d1_31_fireAvoid ws2 d1_31_fire
Avoid ws2 d1_31_fire
 
SeaSurfaceHeight
SeaSurfaceHeightSeaSurfaceHeight
SeaSurfaceHeight
 
Climate Change in a Nutshell
Climate Change in a NutshellClimate Change in a Nutshell
Climate Change in a Nutshell
 

UndergradResearch

  • 1. The Annual Increase of Carbon Dioxide Levels in Mauna Loa, Hawaii in relation to the Frequency of Major Hurricanes in the Pacific Ocean (1992- 2009) Laura Rook Fort Hays State University January 11, 2013
  • 2. Abstract An experiment was performed to determine the correlation between the annual increase of carbon dioxide in Mauna Loa, Hawaii and the frequency of major hurricanes in the Pacific Ocean. The relationship between the two variables is important because it could allow scientists to better predict when a major hurricane might occur. To determine the relationship between carbon dioxide and major hurricanes, two sets of data were used. The first data set used contained the number of hurricanes in the Pacific Ocean from the 1800s to 2011. The data set was obtained from the National Oceanic and Atmospheric Administration and the Central Pacific Hurricane Center. The second data set used contained carbon dioxide levels collected in Mauna Loa, Hawaii from1959-2011. The data set was obtained from the National Climate Data Center and the National Oceanic and Atmosphere Administration. The data was analyzed for the years 1992-2009 by determining a correlation coefficient as well as a coefficient of determination. It was found that there is a negative correlation between the two variables which does not agree with the hypothesis.
  • 3. Introduction The question of this project addresses how the annual increase of carbon dioxide affects the frequency of major hurricanes in the Pacific Ocean. The level of carbon dioxide in the atmosphere has increased by 35% over the last 150 years alone (Justus, Fletcher, 2001). The objective of this project is to determine the correlation between the annual increase of carbon dioxide in Mauna Loa, Hawaii and the frequency of major hurricanes in the Pacific Ocean from 1992 to 2009. Topics similar to this project have been addressed before but the results were inconclusive. In the past, scientists have researched whether global warming is a possible source for an increase in hurricane activity in the Atlantic Ocean. However, the results varied. According to a report discussing the causes and implications of an increase in Atlantic hurricane activity, some scientists found an increase in hurricane activity due to global warming while others found that there was a decrease in hurricane activity (Goldenberg, S. B., Landsea, C. W., Mestas-Nuñez, A. M., & Gray, W. M. (2001). Carbon dioxide is a major component of global warming (Justus, Fletcher, 2001). Human activities, such as the burning of fossil fuels, have contributed to increased atmospheric carbon dioxide (CO2) and other trace greenhouse gases. If these gases continue to increase in the atmosphere at the rate they are going, scientists believe the effects of global warming would increase significantly through the Earth’s natural heat-trapping “greenhouse effect.” (Justus,
  • 4. Fletcher, 2001). The increasing levels of carbon dioxide in the Earth’s atmosphere can also cause an increase in precipitation and surface temperature of the oceans. (Andrews, Timothy, Forster, Piers M, 2010). Global warming is also causing an underwater heat wave which in turn is causing ocean temperatures to rise (House of Representatives, 2010). As the temperature of water increases, it expands. During the last 40 years, this expansion has contributed to 25 percent of the rising sea level (House of Representatives, 2010). Global warming is causing the sea level to rise because increasing temperatures are melting ice in the ocean such as glaciers and ice sheets (Solomon, S., Plattner, G.-K., Knutti, R., & Friedlingstein, P. (2009). A recent study used current ice discharge data to propose that melting ice sheets will contribute to the rising sea level by 1-2 meters by 2100 (Solomon, S., Plattner, G.-K., Knutti, R., & Friedlingstein, P. (2009). Rising sea levels also pose a threat to coastal communities and wildlife by increasing the vulnerability of tropical storms (House of Representatives, 2010).This is crucial to the experiment considering that the primary controlling factor for tropical cyclone formation is sea surface temperature (Anthes, Corell, Holland, Hurrell, MacCracken, Trenberth, 2006). As sea surface temperatures are increasing, the likelihood of a hurricane increases because warm ocean water of 82°F provides ample moisture and water vapor to the atmosphere to drive the hurricane engine (US Department of Commerce, NOAA). A number of scientists speculate that human activities, which have increased the level of carbon dioxide (CO2) in the atmosphere by 35% over the last 150 years, are causing an increase in global temperatures (Justus, Fletcher, 2001). Global temperatures have risen 0.6 C in the last 100 years, and are estimated to rise anywhere from 1.8 C to 7.1C over the next 100 years (Justus, Fletcher, 2001). The relationships between tropical cyclones and global climate change are scientifically complex, with great implications for society (Anthes, Corell, Holland, Hurrell,
  • 5. MacCracken, Trenberth, 2006). An example of this is how a minimal rise in sea level can have catastrophic consequences when major storms strike (Anthes, Corell, Holland, Hurrell, MacCracken, Trenberth, 2006). Global-mean precipitation is an important part of the Earth’s climate system. When the Earth’s global-mean precipitation changes, it can affect many aspects of the climate system such as surface temperature of the ocean. When the surface temperature changes, it can cause changes in water vapor, clouds, atmospheric stability and lapse rates. Thus, changes in surface temperature can influence precipitation processes and lead to changes in precipitation as well (Andrews, Forster, 2010). Changes in tropical cyclone activity are among the more consequential results of global climate change. Storm intensity generally increases with global warming but the results vary in different areas. Storm frequency tends to decreases in the Southern Hemisphere and North Indian Ocean, but increases in the western North Pacific (Emanuel, K., Sundararajan, R., & Williams, J. (2008). The five year time period from 1995 to 2000 had the highest level of hurricane activity on record in the North Atlantic Ocean (Goldenberg, S. B., Landsea, C. W., Mestas-Nuñez, A. M., & Gray, W. M. (2001). The high level of hurricane activity during the five year time period was the result of increases of North Atlantic sea surface temperatures and decreases in vertical wind shear (Goldenberg, S. B., Landsea, C. W., Mestas-Nuñez, A. M., & Gray, W. M. (2001). The high level of hurricane activity is expected to continue for another 10 to 40 years (Goldenberg, S. B., Landsea, C. W., Mestas-Nuñez, A. M., & Gray, W. M. (2001). Methodology As carbon dioxide levels increase in Mauna Loa, Hawaii (Figure 1), the frequency of major hurricanes in the Pacific Ocean will also increase. This hypothesis was based on the fact
  • 6. that carbon dioxide is a main component in global warming (Justus, Fletcher, 2001), and the assumption that the effects of global warming have cause sea surface temperatures to increase. Since the primary controlling factor for tropical cyclone formation is sea surface temperature (Anthes, Corell, Holland, Hurrell, MacCracken, Trenberth, 2006), if the sea surface temperature increased, so would the likelihood of a hurricane. The likelihood of a hurricane would increase because warm ocean water of 82°F provides ample moisture and water vapor to the atmosphere to drive the hurricane engine (US Department of Commerce, NOAA). Thus, as carbon dioxide levels increase, the frequency of major hurricanes will also increase. The hypothesis was first tested by formatting the two data sets into a Microsoft Excel spreadsheet. From there the data sets were graphed as shown in Figure 1 and Figure 2, with the year placed on the X-axis, and the increase of carbon dioxide along with the number of major hurricanes on the Y-axis. The correlation between the two variables was determined by finding the correlation coefficient, the coefficient of determination, and a critical value. A correlation coefficient measures the strength and relationship between two variables (Bluman, A. G. (1995). Possible values for a correlation coefficient range from negative one to positive one. A value of negative one represents a strong negative linear correlation between the two variables whereas a value of positive one represents a strong positive correlation between the two variables (Bluman, A. G (1995). When there is a weak relationship between the variables the correlation coefficient will be closer to zero (Bluman, A. G (1995). The symbol r stands for the correlation coefficient and the coefficient of determination is represented by the symbol r2 (Cox, D. R., & Wermuth, N. (1992). In order to find the critical value, the coefficient of determination value was multiplied by 100. If the critical value was found to have a value of ninety five percent or greater than the critical value was considered significant. However, if the critical value was lower than ninety
  • 7. five percent then the critical value was not significant. If the value of the correlation coefficient was found to be significant then the next step in analyzing the data was to find the equation of the regression line. The regression line is the data’s line of best fit (Bluman, A. G. (1995). Determining the equation of the regression line helps the researcher to see trends in the data and make predictions upon the data (Bluman, A. G. (1995). For this project, two data sets were used. The first was a table containing the number of hurricanes in the Pacific Ocean for the years 1992 to 2009. The table provided the date and time of the storm, latitude and longitude, and pressure and wind speed. The table also identified what category the hurricane was classified as. For this project only hurricanes that reached a wind speed of 100 mph or greater were classified as major hurricanes. The Saffir-Simpson scale for categorizing hurricane wind speed and damage potential is being used more and more by hurricane forecasters. The hurricane categories in the scale are associated by 1-min wind speeds (Simiu, E., Vickery, P., & Kareem, A. (2007). According to the Saffir- Simpson Hurricane Wind Scale, hurricanes reaching Category 3 and higher are considered major hurricanes because of their potential for significant loss of life and damage. However, category 1 and 2 hurricanes are still very dangerous. Hurricanes with a wind speed of 96 to 110 mph are classified as category 2 hurricanes (NOAA). Both data sets were found on the National Climatic Data Center online database as well as National Oceanic and Atmospheric Administration and the Central Pacific Hurricane Center online database. The first step in processing the data was to format each data set into Microsoft Excel. This was accomplished my manually typing each data set into an excel spreadsheet. Once both sets of data were formatted into excel spreadsheets, the data was graphed to provide a visual aide of the relationship between the two variables during the given time period (Figure 2). The type of
  • 8. graph that was used was a scatter plot. A scatter plot was chosen because it best represented the data. The next step in analyzing the data was to determine a correlation coefficient, a coefficient of determination, and a critical value. The correlation coefficient was determined by using the CORREL function in Microsoft Excel to find out if the correlation between the annual increase of carbon dioxide and major hurricanes was positive or negative. The coefficient of determination was found by squaring the correlation coefficient. The coefficient of determination was needed to figure the percent of variability on how the frequency of major hurricanes in the Pacific Ocean was affected by the annual mean increase of carbon dioxide in Mauna Loa, Hawaii. The critical value was determined by multiplying the coefficient of determination by one hundred to see whether or not there was a significant correlation. Results After processing and analyzing the data, the correlation coefficient between the two data sets was found to be -0.1429. The correlation coefficient of -0.1429 produced a coefficient of determination of 0.0204 and a critical value of 2.042%. There were multiple errors within the data sets for the project. For the hurricane data, these errors included the accuracy of pressure and wind speed. There were errors within the accuracy of pressure and wind speed because it may be difficult to measure the exact pressure and wind speed at a specific time. Also, an error in this data set is the number of hurricanes monitored. There is an error in the number of monitored hurricanes because if a hurricane was not seen on radar, it would have not been included in the data set. Also, hurricanes that did not reach a landmass may not have been reported and thus not included in the data set. There was also an error within the carbon dioxide data however the data collected from Mauna Loa gives the uncertainty within the data set. The uncertainty of the
  • 9. annual increase of carbon dioxide in Mauna Loa, Hawaii for each year from 1992 to 2009 is 0.11. Conclusions and Discussions The objective of the project was successfully accomplished. The relationship between the annual increase of carbon dioxide in Mauna Loa, Hawaii and the frequency of major hurricanes in the Pacific Ocean from 1992 to 2009 was found. The hypothesis stated that as the annual level of carbon dioxide increases in Mauna Loa, Hawaii, the frequency of major hurricanes in the Pacific Ocean will also increase. The hypothesis predicted that there would be a positive correlation between the two variables. However, the hypothesis was found to be incorrect .The correlation coefficient was found to be -0.1429 which means that the variables had a negative correlation, not a positive correlation. The negative correlation means that as carbon dioxide levels are increasing, the frequency of major hurricanes is decreasing. The correlation coefficient also falls below the critical value which was 2.042%. The research is limited by the number of major hurricanes that have occurred between 1992 and 2009 in the Pacific Ocean. There were only a total of fourteen major hurricanes during this time period and there were some years where no hurricanes occurred. There are many ways that the research for this project could be extended. First, hurricane data from the Atlantic Ocean could be used as well as data from the Pacific Ocean. Using data from both the Atlantic and Pacific Ocean would mean more hurricanes, which would allow the research of this project to continue. While the results of this project showed that the correlation between carbon dioxide and hurricanes in the pacific was negative, there may be a different correlation between carbon dioxide and hurricanes in the Atlantic Ocean. Secondly, carbon dioxide data collected from regions other than Mauna Loa, Hawaii could be used. This data
  • 10. could be used instead of the Mauna Loa, Hawaii data or along with the Mauna Loa data. Carbon dioxide trends could be different depending on the area where the carbon dioxide data was collected. Carbon dioxide levels in one region might increase while carbon dioxide levels in another region may decrease. Also, the levels of carbon dioxide in one area might not be as high as carbon dioxide levels in another area. Another factor that could extend the research of this project would be to add in more variables to the project. Possible variables that could extend the research of this project might be precipitation and sea surface temperature. If precipitation and sea surface temperature were accounted for in the project, scientists would be able to narrow down exactly what factors affect the frequency of major hurricanes. This could be done by finding the relationships between each variable and the frequency of major hurricanes. If a variable was found to have no affect on the frequency of major hurricanes, this would lead scientists in the right direction to find exactly what variables do affect the frequency of major hurricanes. Both the precipitation data as well as sea surface temperature data could be found through the National Climatic Data Center. Also, a possibility for extending the research of this project would be to change the question of the project entirely. Instead of only focusing on the relationship between carbon dioxide and major hurricanes, researchers could investigate the relationship between all tropical systems and carbon dioxide. All tropical systems would include; hurricanes, tropical depressions, and tropical storms. The results of researching the correlation between all tropical systems and the annual increase on carbon dioxide could produce an entirely different correlation all together. By expanding major hurricanes into all tropical systems could result in a positive correlation rather than the negative correlation produced in the original experiment. Another possibility for extending the research of this project would be to use a broader range of data instead of only using data from 1992 until 2009. Using a broader range of
  • 11. data would allow researchers to look at trends from tropical systems and carbon dioxide in the past that could be used to predict trends in the future. Thus, using more data in the project could produce different results than what was originally concluded in this research project.
  • 12. References Andrews, T., & Forster, P. M. (2010). The transient response of global-mean precipitation to increasing carbon dioxide levels. Environmental Research Letters, 5(2), 025212. doi:10.1088/1748-9326/5/2/025212 Anthes, R. A., Corell, R. W., Holland, G., Hurrell, J. W., MacCracken, M. C., & Trenberth, K. E. (2006). Hurricanes and global warming-Potential linkages and consequences. Bulletin of the American Meteorological Society, 87(5), 623–628. Cao, L., Bala, G., & Caldeira, K. (2011). Why is there a short-term increase in global precipitation in response to diminished CO2 forcing? Geophysical Research Letters, 38(6), L06703. doi:10.1029/2011GL046713 Donald R Cahoon, & Geological Survey (U. S.). (1997). Global warming, sea-level rise, and coastal marsh survival. Reston, Va: USDeptof the Interior, USGeological Survey. Goldenberg, S. B., Landsea, C. W., Mestas-Nuñez, A. M., & Gray, W. M. (2001). The Recent Increase in Atlantic Hurricane Activity: Causes and Implications. Science, 293(5529), 474–479. doi:10.1126/science.1060040 Justus, J. R., & Fletcher, S. R. (2001). Global climate change. Makarieva, A. M., & Gorshkov, V. G. (2009). Condensation-induced kinematics and dynamics of cyclones, hurricanes and tornadoes. Physics Letters A, 373(46), 4201–4205. doi:10.1016/j.physleta.2009.09.023 United States. Congress. House. Select Committee on Energy Independence and Global Warming. (2010). Rising tides, rising temperatures global warming’s impacts on the oceans : hearing before the Select Committee on Energy Independence and Global Warming, House of
  • 13. Representatives, One Hundred Tenth Congress, second session, April 29, 2008.Washington: USGPO. Chan, J. C. L. (2006). Comment on “Changes in Tropical Cyclone Number, Duration, and Intensity in a Warming Environment”. Science,311(5768), 1713b–1713b. doi:10.1126/science.1121522 Solomon, S., Plattner, G.-K., Knutti, R., & Friedlingstein, P. (2009). Irreversible climate change due to carbon dioxide emissions. Proceedings of the National Academy of Sciences, 106(6), 1704– 1709. doi:10.1073/pnas.0812721106 Emanuel, K., Sundararajan, R., & Williams, J. (2008). Hurricanes and global warming: Results from downscaling IPCC AR4 simulations. Bulletin of the American Meteorological Society, 89(3), 347–367. Simiu, E., Vickery, P., & Kareem, A. (2007). Relation between Saffir–Simpson Hurricane Scale Wind Speeds and Peak 3-s Gust Speeds over Open Terrain. Journal of Structural Engineering, 133(7), 1043–1045. doi:10.1061/(ASCE)0733-9445(2007)133:7(1043) Bluman, A. G. (1995).Elementary statistics. Brown Melbourne. Cox, D. R., & Wermuth, N. (1992). A comment on the coefficient of determination for binary responses. The American Statistician, 46(1), 1–4.
  • 14. 0 0.5 1 1.5 2 2.5 3 3.5 1990 1995 2000 2005 2010 AnnualIncreaseofCarbonDioxideand#of MajorHurricanes Year # of Hurricanes Annual Increase of Carbon Dioxide (ppm) y = -0.0041x + 9.0358 R² = 0.0005 y = 0.0406x - 79.397 R² = 0.1341 0 0.5 1 1.5 2 2.5 3 3.5 1990 1995 2000 2005 2010 AnnualIncreaseofCarbonDioxideand#of MajorHurricanes Year # of Hurricanes Annual Increase of Carbon Dioxide (ppm) Linear (# of Hurricanes) Linear (Annual Increase of Carbon Dioxide (ppm))