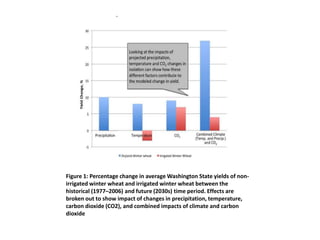
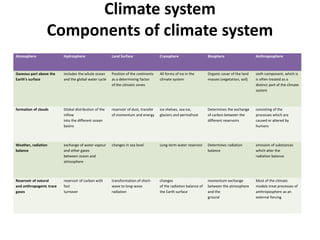
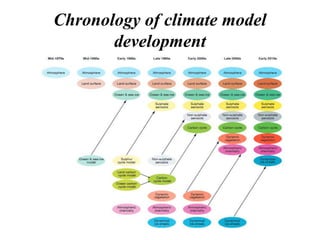
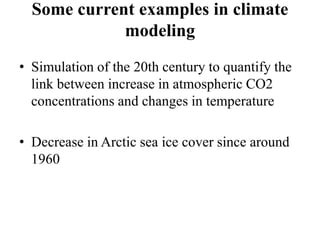
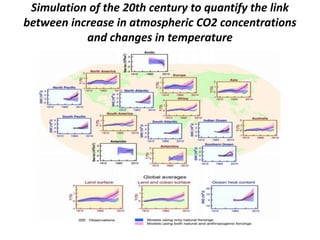
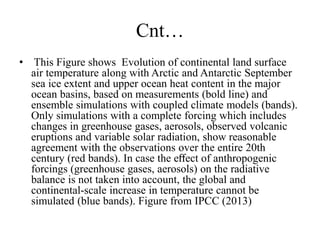
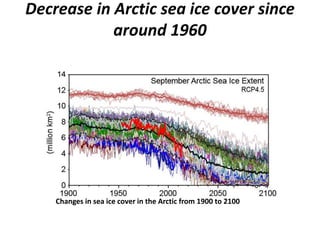
Descriptive modeling is a type of mathematical modeling that describes major historical events and relationships between elements that created those events. Descriptive climate models typically represent significant components of the climate system like the atmosphere, oceans, land, and their interactions. One strength is they can isolate factors contributing to climate change, like how changes in precipitation and temperature affect agricultural yields. Current examples include using descriptive models to simulate 20th century climate trends and the decrease in Arctic sea ice cover since 1960.