Downloaded 20 times
![ Prediction models continuous valued functions. Numeric prediction is the task of
predicting continues values for the given input.
Regression analysis is a statistical methodology that is often used for numerical
prediction
Linear/straight-line regression involves a response variable, y and a single
predictor variable, x. It models y as a function of x. [y=b+wx]
Multiple linear regression extends straight-line regression to models more than
one predictor variable
Nonlinear regression models polynomial terms
20](https://image.slidesharecdn.com/introductiontodatamining-140705100150-phpapp02/75/Introduction-to-data-mining-20-2048.jpg)

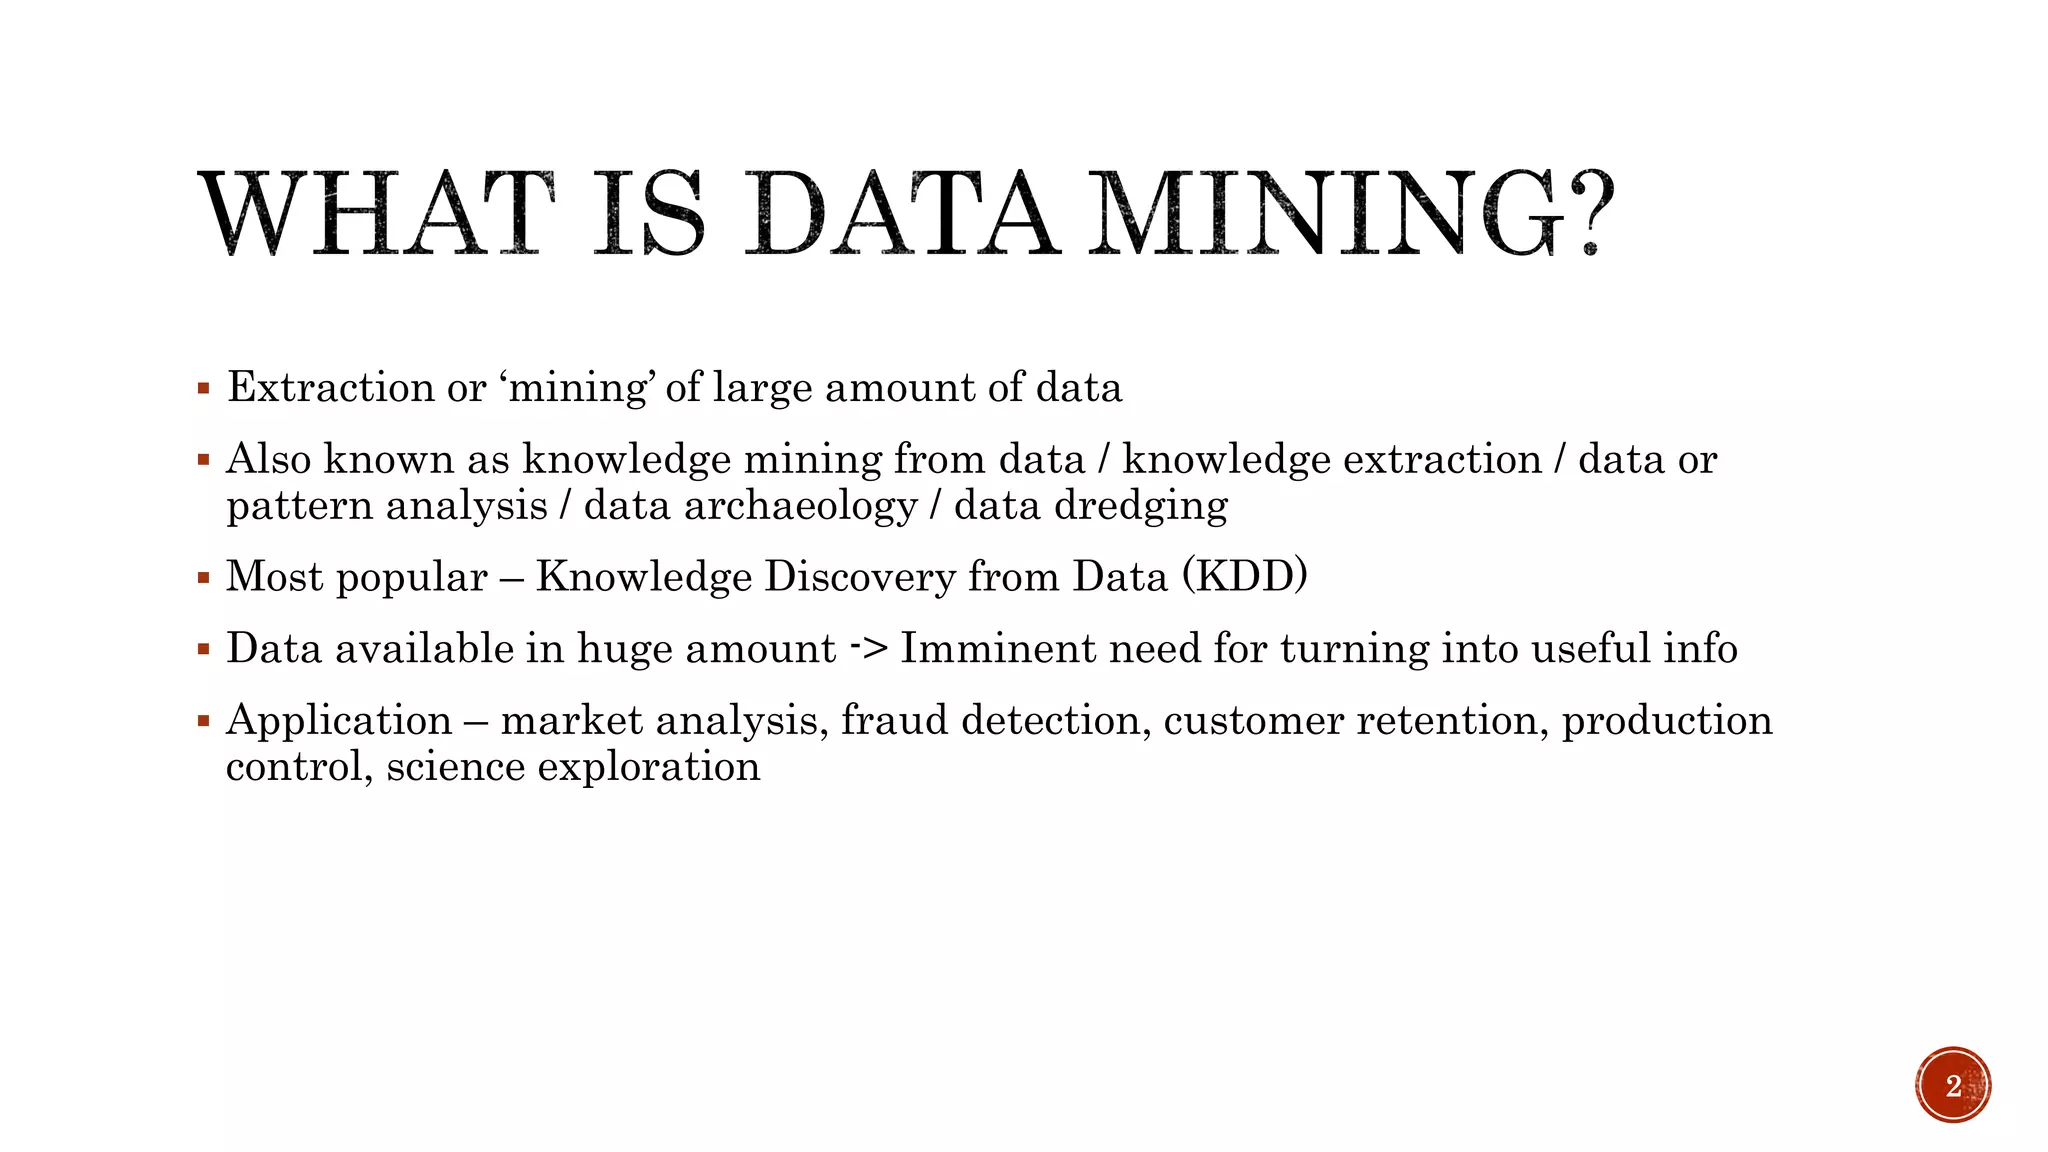
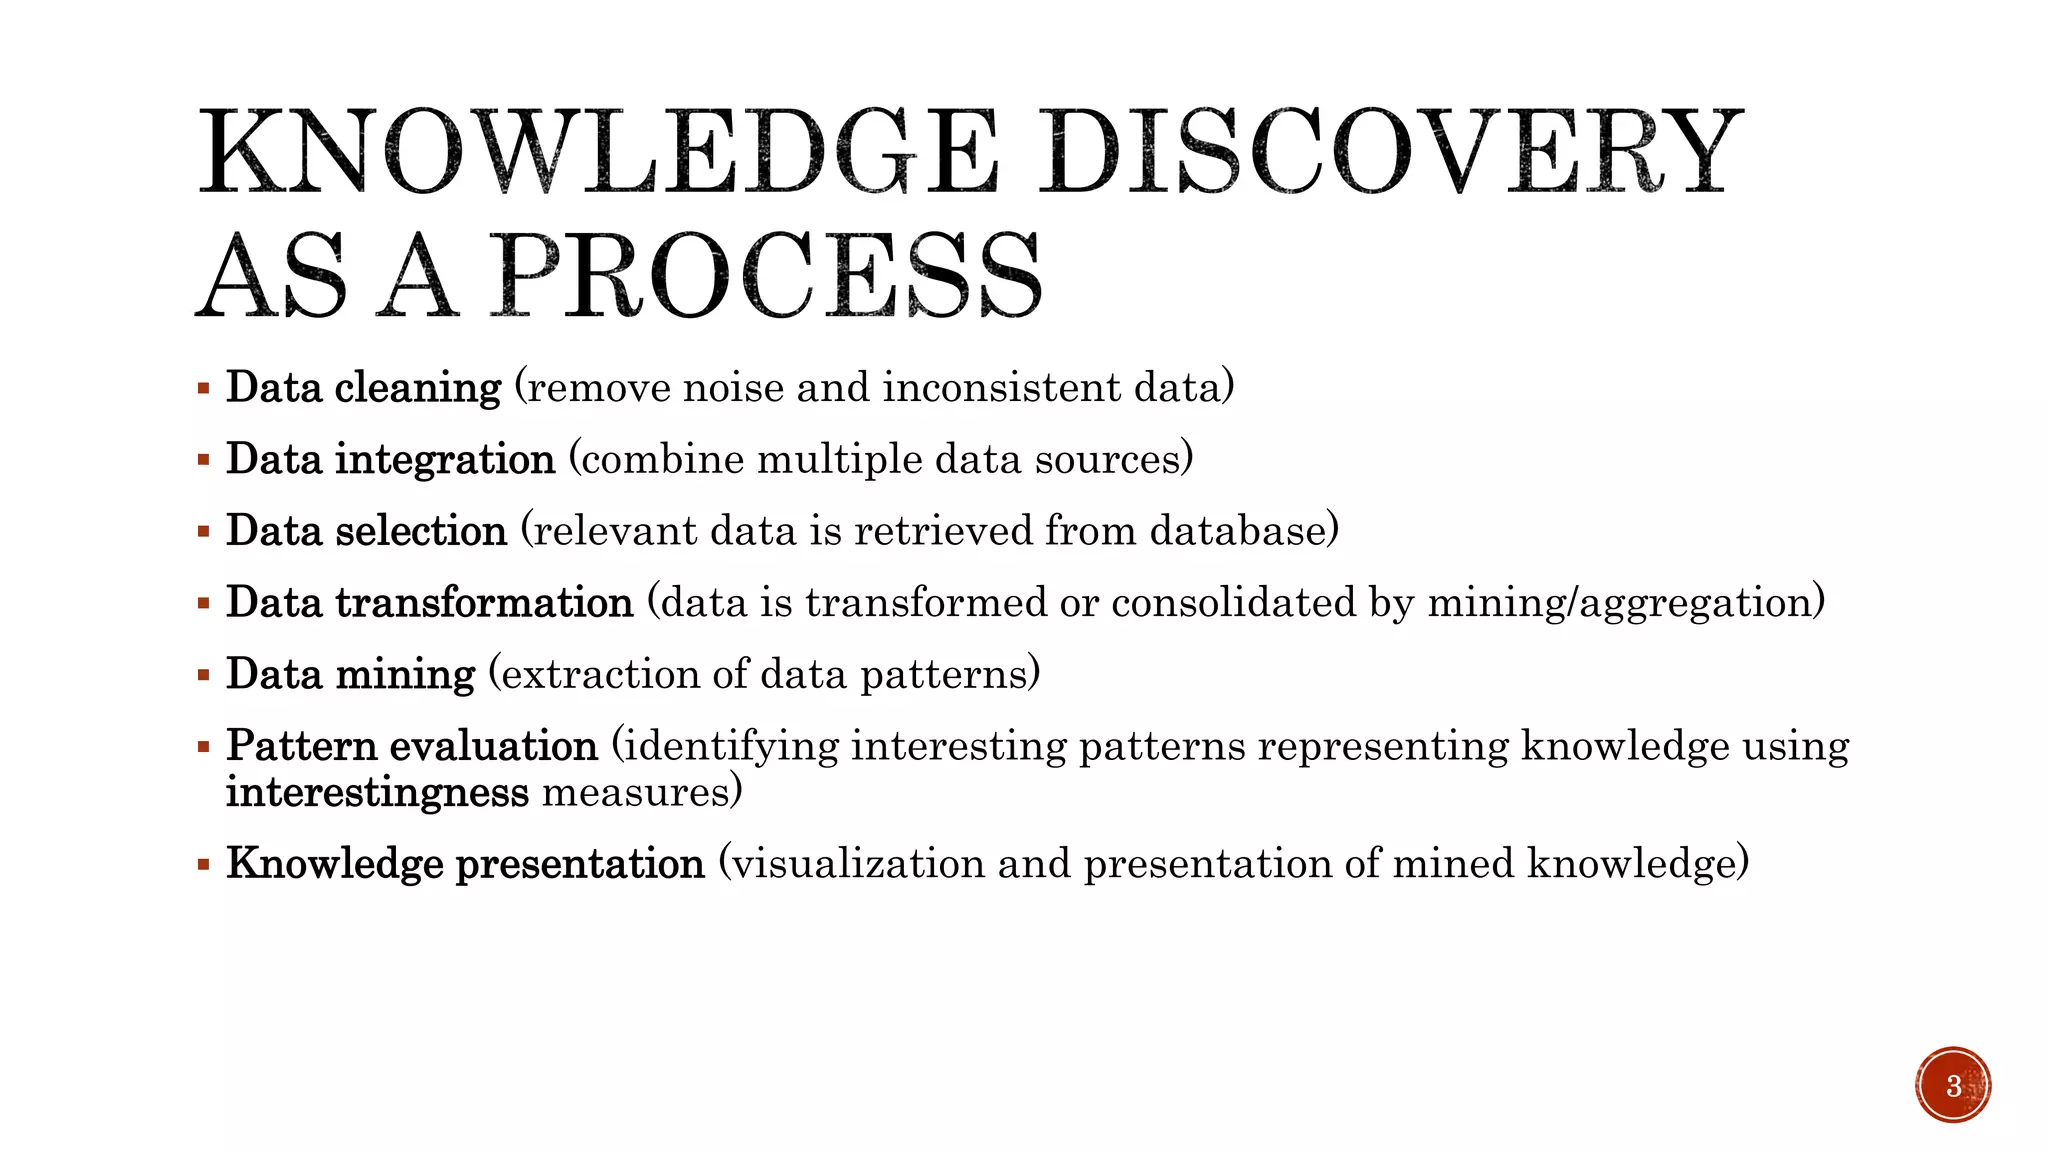
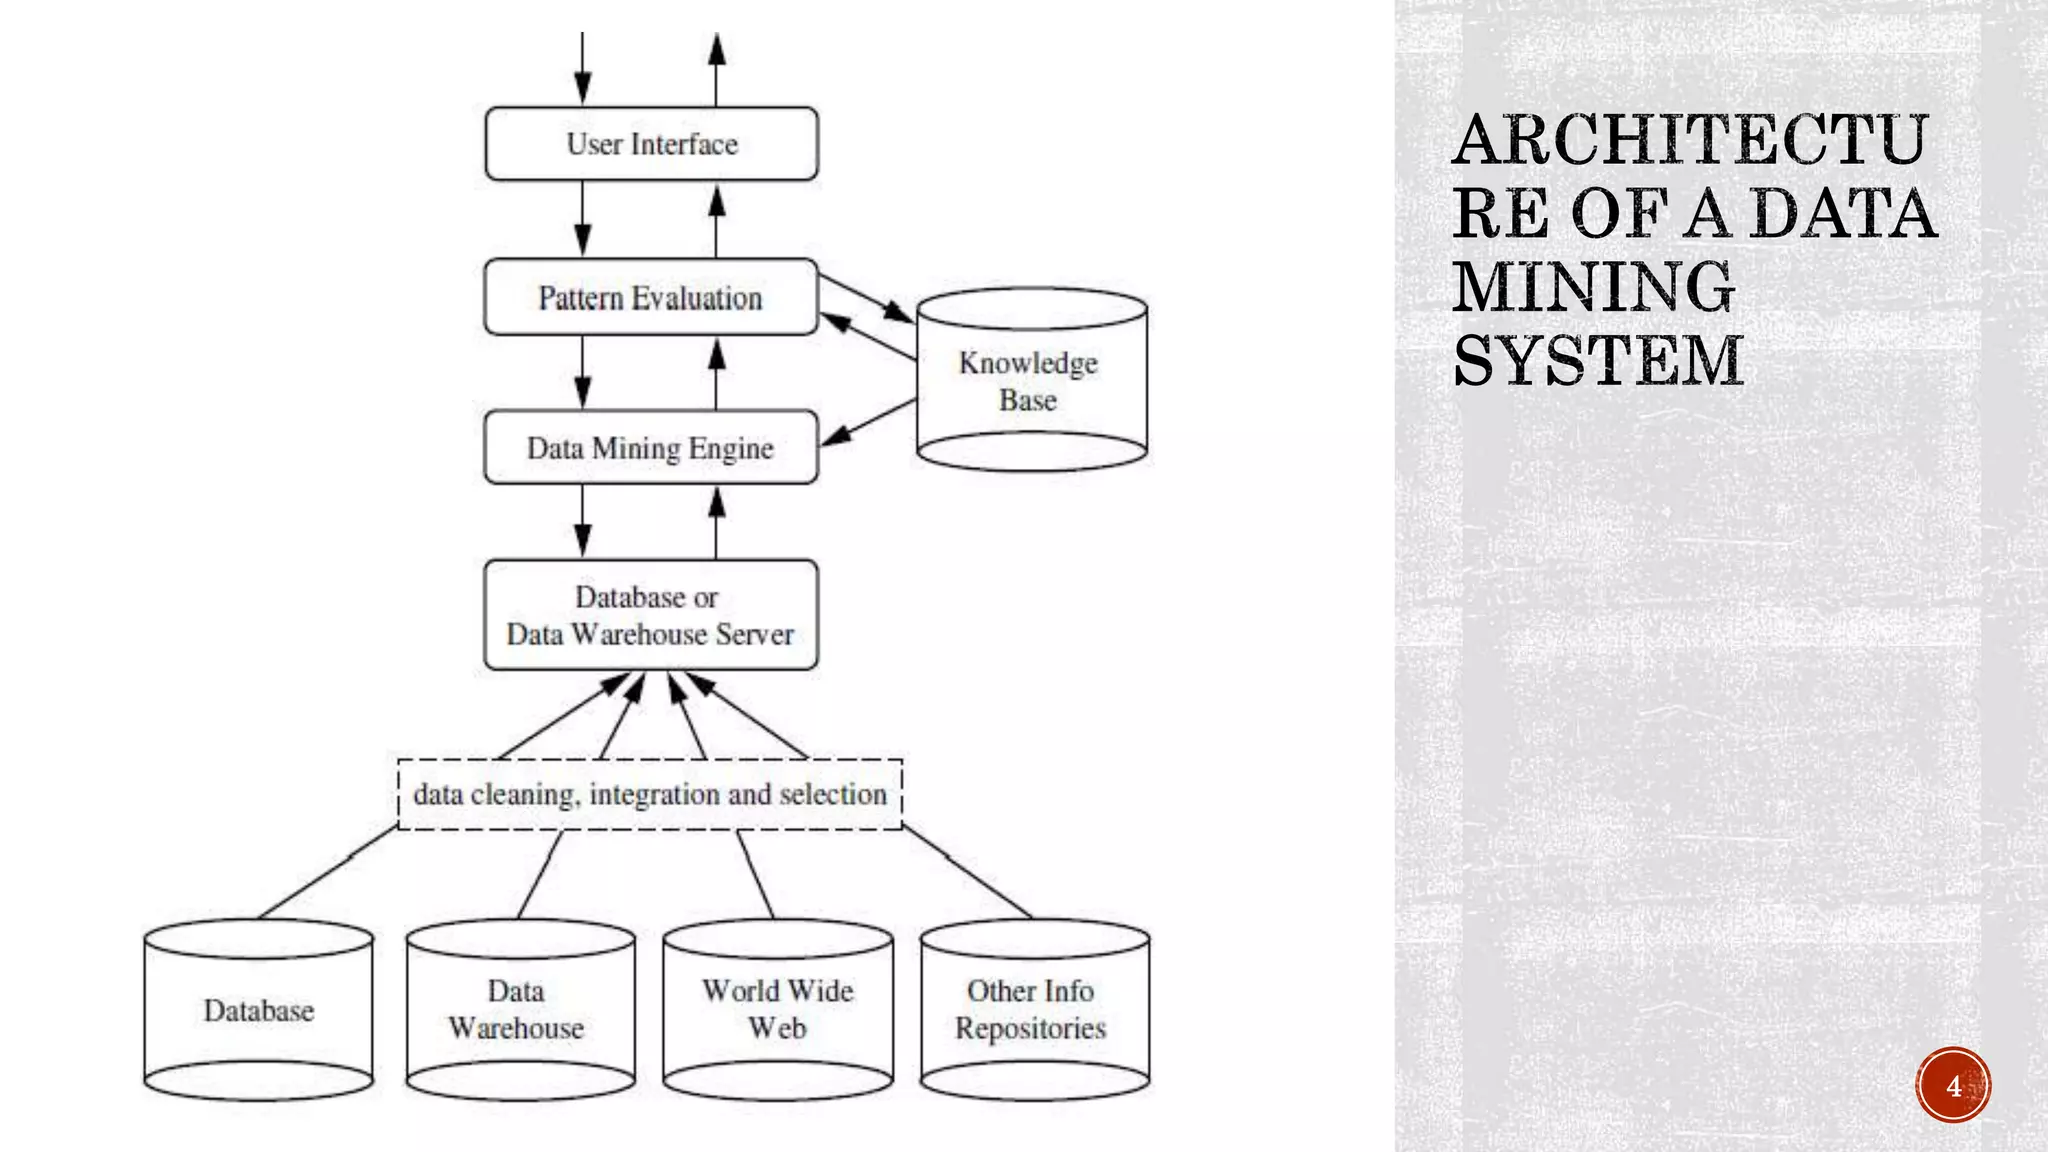
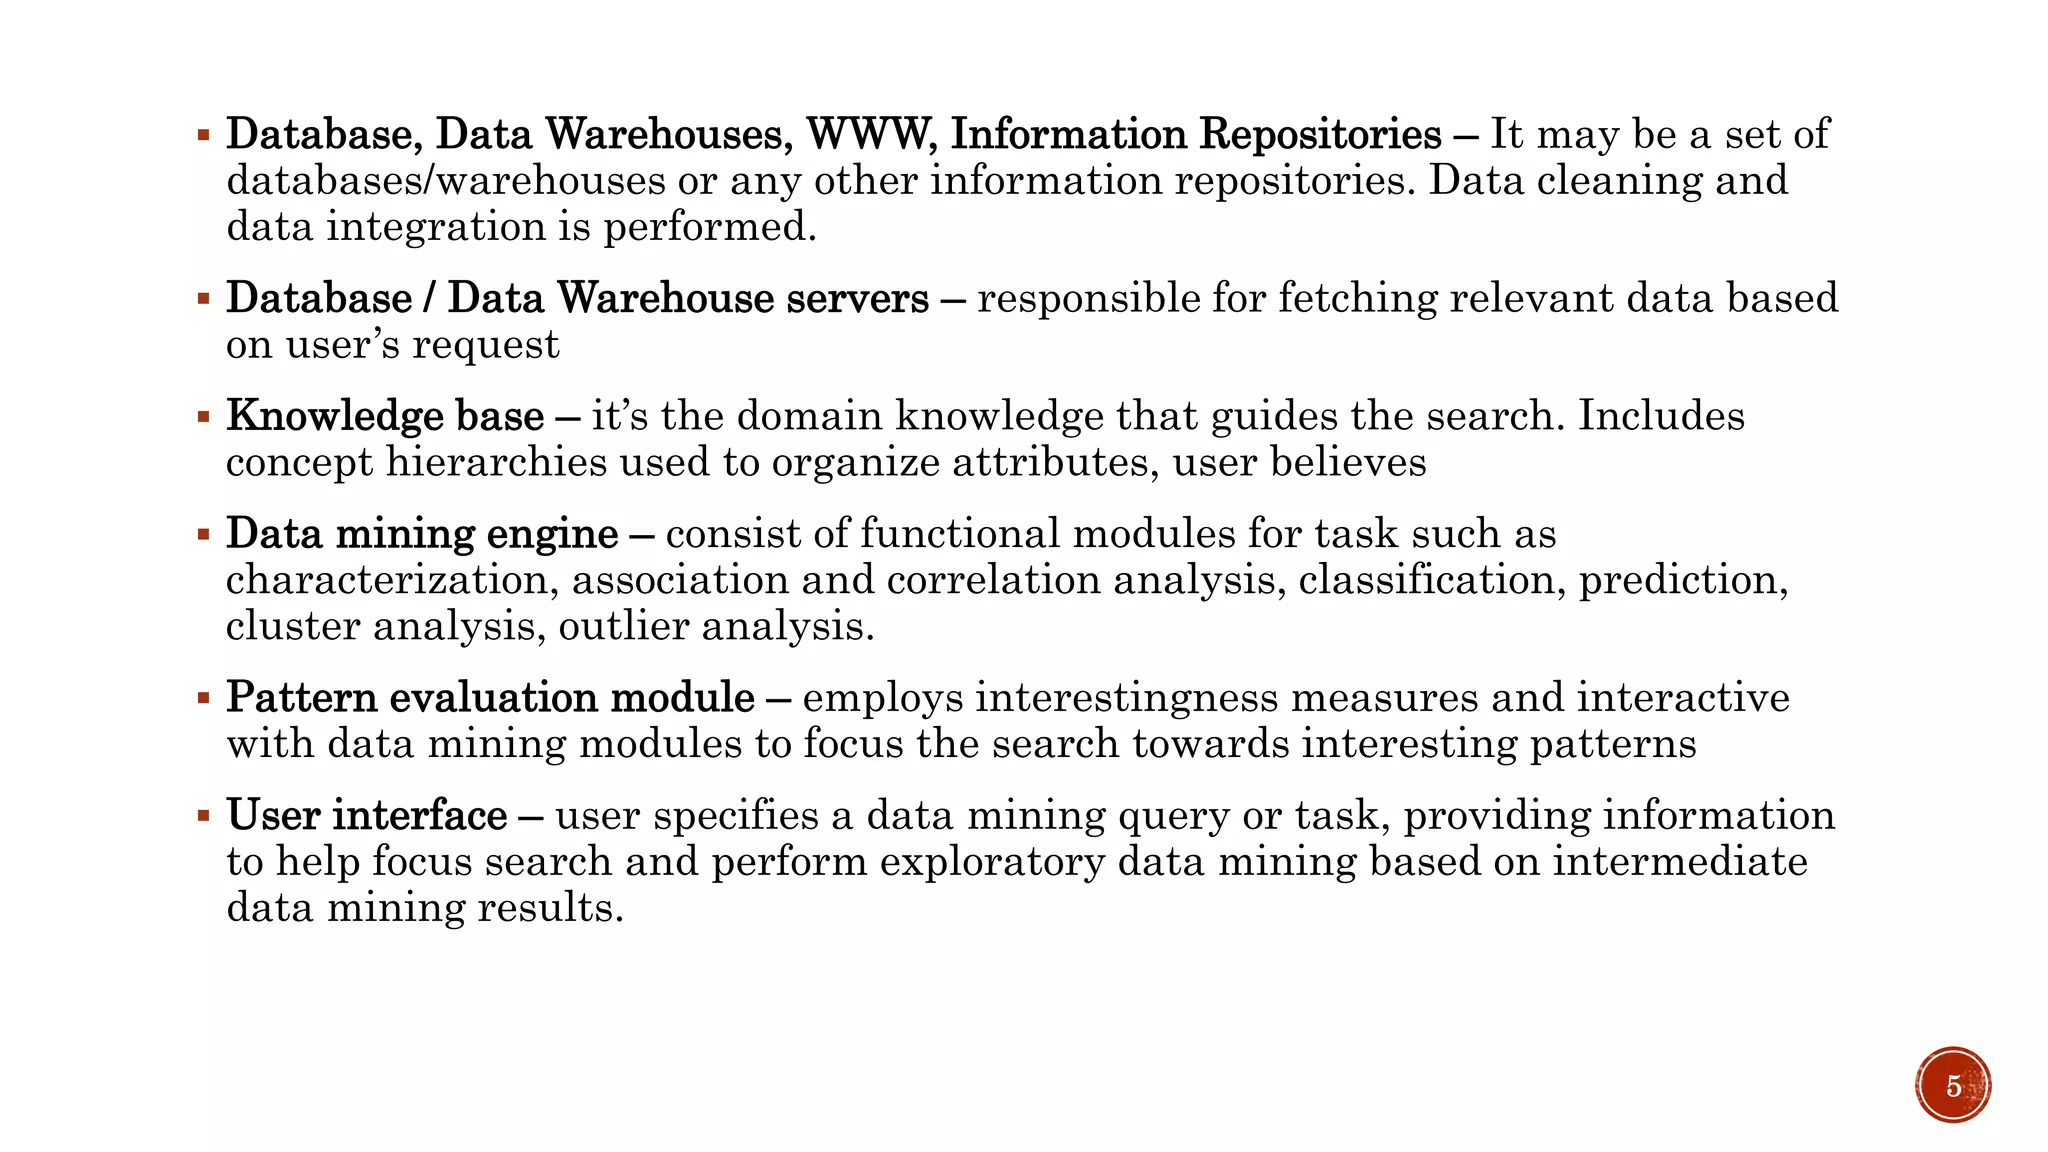
The document provides an introduction to data mining and knowledge discovery. It discusses how large amounts of data are extracted and transformed into useful information for applications like market analysis and fraud detection. The key steps in the knowledge discovery process are described as data cleaning, integration, selection, transformation, mining, pattern evaluation, and knowledge presentation. Common data sources, database architectures, and types of coupling between data mining systems and databases are also outlined.