IRJET - Stability Analysis of Islanded Microgrid During Fault using MATLAB Simulink
•
0 likes•2 views

The document analyzes the stability of an islanded microgrid during faults using MATLAB Simulink. It presents a model of a microgrid with distributed energy sources and loads and simulates line-to-ground, line-to-line, and triple-line faults at a load terminal. The results show the effect of faults on voltage and current waveforms at different points in the microgrid and how fault severity is highest closest to the fault location.

Recommended
Recommended
More Related Content
What's hot
What's hot (20)
Similar to IRJET - Stability Analysis of Islanded Microgrid During Fault using MATLAB Simulink
Similar to IRJET - Stability Analysis of Islanded Microgrid During Fault using MATLAB Simulink (20)
More from IRJET Journal
More from IRJET Journal (20)
Recently uploaded
Recently uploaded (20)
IRJET - Stability Analysis of Islanded Microgrid During Fault using MATLAB Simulink
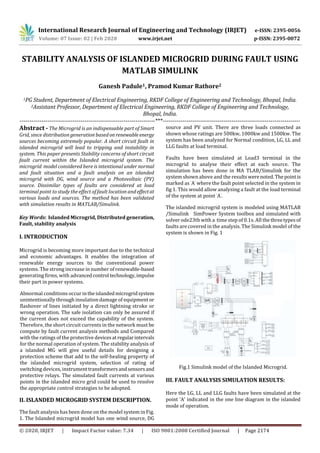
- 1. International Research Journal of Engineering and Technology (IRJET) e-ISSN: 2395-0056 Volume: 07 Issue: 02 | Feb 2020 www.irjet.net p-ISSN: 2395-0072 © 2020, IRJET | Impact Factor value: 7.34 | ISO 9001:2008 Certified Journal | Page 2174 STABILITY ANALYSIS OF ISLANDED MICROGRID DURING FAULT USING MATLAB SIMULINK Ganesh Padule1, Pramod Kumar Rathore2 1PG Student, Department of Electrical Engineering, RKDF College of Engineering and Technology, Bhopal, India. 2Assistant Professor, Department of Electrical Engineering, RKDF College of Engineering and Technology, Bhopal, India. ---------------------------------------------------------------------***---------------------------------------------------------------------- Abstract - The Microgrid is an indispensable part of Smart Grid, since distribution generation basedonrenewableenergy sources becoming extremely popular. A short circuit fault in islanded microgrid will lead to tripping and instability in system. This paper presents Stability concerns of short circuit fault current within the Islanded microgrid system. The microgrid model considered here is intentional under normal and fault situation and a fault analysis on an islanded microgrid with DG, wind source and a Photovoltaic (PV) source. Dissimilar types of faults are considered at load terminal point to study the effect of fault location andeffectat various loads and sources. The method has been validated with simulation results in MATLAB/Simulink. Key Words: Islanded Microgrid, Distributed generation, Fault, stability analysis I. INTRODUCTION Microgrid is becoming more important due to the technical and economic advantages. It enables the integration of renewable energy sources to the conventional power systems. The strong increase in number of renewable-based generating firms, with advancedcontrol technology,impulse their part in power systems. Abnormal conditions occur intheislandedmicrogridsystem unintentionally through insulation damage of equipment or flashover of lines initiated by a direct lightning stroke or wrong operation. The safe isolation can only be assured if the current does not exceed the capability of the system. Therefore, the short circuit currents in the network must be compute by fault current analysis methods and Compared with the ratings of the protective devicesatregularintervals for the normal operation of system. The stability analysis of a islanded MG will give useful details for designing a protection scheme that add to the self-healing property of the islanded microgrid system, selection of rating of switching devices, instrumenttransformersandsensorsand protective relays. The simulated fault currents at various points in the islanded micro grid could be used to resolve the appropriate control strategies to be adopted. II. ISLANDED MICROGRID SYSTEM DESCRIPTION. The fault analysis has been done on the model system in Fig. 1. The Islanded microgrid model has one wind source, DG source and PV unit. There are three loads connected as shown whose ratings are 500kw, 1000kw and 1500kw. The system has been analyzed for Normal condition, LG, LL and LLG faults at load terminal. Faults have been simulated at Load3 terminal in the microgrid to analyse their effect at each source. The simulation has been done in MA TLAB/Simulink for the system shown above and the resultswerenoted. Thepointis marked as 'A' where the fault point selected in the system in fig 1. This would allow analysing a fault at the load terminal of the system at point 'A'. The islanded microgrid system is modeled using MATLAB /Simulink SimPower System toolbox and simulated with solver ode23tb with a time step of 0.1s. All thethreetypesof faults are covered in the analysis. The Simulink model of the system is shown in Fig. 1 Fig.1 Simulink model of the Islanded Microgrid. III. FAULT ANALYSIS SIMULATION RESULTS: Here the LG, LL and LLG faults have been simulated at the point ‘A’ indicated in the one line diagram in the islanded mode of operation.
- 2. International Research Journal of Engineering and Technology (IRJET) e-ISSN: 2395-0056 Volume: 07 Issue: 02 | Feb 2020 www.irjet.net p-ISSN: 2395-0072 © 2020, IRJET | Impact Factor value: 7.34 | ISO 9001:2008 Certified Journal | Page 2175 At normal operating condition current and voltage waveforms are sinusoidal in nature shown in fig. 2-5. Fig.2 Voltage and Current at Wind Terminal at normal condition. Fig.3 Voltage and Current at DG and Load1 at normal condition Fig.4 Voltage and Current at Bus 1and 4 at normal condition Fig.5 Voltage and Current at PV array at normal condition LG Fault at the point ‘A’ Fault current and voltage at the point ‘A’ for LG fault is shown in Fig. 6-9. The voltage drops to zero and the current waveforms are as expected. Voltage and current supplied by the Wind, DG and PV Array during fault are shown in Fig. 7, Fig.8 and Fig. 9. This shows that the severity of the fault is maximum atthepointsclosest to it and is affected the most. The Load 3 being closest to it gets affected the most as seen from fig.6
- 3. International Research Journal of Engineering and Technology (IRJET) e-ISSN: 2395-0056 Volume: 07 Issue: 02 | Feb 2020 www.irjet.net p-ISSN: 2395-0072 © 2020, IRJET | Impact Factor value: 7.34 | ISO 9001:2008 Certified Journal | Page 2176 Fig.6 Voltage and Current at Bus1 and 4 at L-G fault at point ‘A’ Fig.7 Voltage and Current at Wind Terminal at L-G fault at point ‘A’ Fig.8 Voltage and Current at DG and Load1 at L-G fault at point ‘A’ Fig.9 Voltage and Current at PV Array at L-G fault at point ‘A’ LL Fault at the point ‘A’ Fault current and voltage at the point ‘A’ for LL fault is shown in Fig. 10-13. The voltage drops and the current waveforms are as expected. Voltage and current supplied by the Wind, DG and PV Array during fault are shown in Fig. 11, Fig.12 and Fig. 13. This shows that the severity of the fault is maximum at the points closest to it and is affected the most. The Load 3 being closest to it gets affected the more as seen from fig.10 Fig.10 Voltage and Current at Bus1 and 4 at L-L Fault at point ‘A’
- 4. International Research Journal of Engineering and Technology (IRJET) e-ISSN: 2395-0056 Volume: 07 Issue: 02 | Feb 2020 www.irjet.net p-ISSN: 2395-0072 © 2020, IRJET | Impact Factor value: 7.34 | ISO 9001:2008 Certified Journal | Page 2177 Fig.11 Voltage and Current at Wind at L-L Fault at point ‘A’ Fig.12 Voltage and Current at DG and Load 1 at L-L Fault at point ‘A’ Fig.13 Voltage and Current at PV Array at L-L Fault at point ‘A’ LLG Fault at the point ‘A’ Similar analysis has been done for LLG as well and the results were obtained. Fault current and voltageatthepoint ‘A’ for LLG fault is shown in Fig. 14-17. The voltage drops to Zero and the current waveforms are as expected. Voltage and current supplied by the Wind, DG and PV Array during fault are shown in Fig. 15, Fig.16 and Fig. 17. This showsthat the severity of the fault is maximum at the pointsclosesttoit and is affected the most. In case of LLG fault at PV Array more effect than LL fault. Fig.14 Voltage and Current at Bus 1 and at L-L-G Fault at point ‘A’ Fig.15 Voltage and Current at Wind at L-L-G Fault at point ‘A’
- 5. International Research Journal of Engineering and Technology (IRJET) e-ISSN: 2395-0056 Volume: 07 Issue: 02 | Feb 2020 www.irjet.net p-ISSN: 2395-0072 © 2020, IRJET | Impact Factor value: 7.34 | ISO 9001:2008 Certified Journal | Page 2178 Fig.16 Voltage and Current at DG and Load 1at L-L-G Fault at point ‘A’ Fig.17 Voltage and Current at PV Array at L-L-G Fault at point ‘A’ IV. CONCLUSION We create a islanded microgrid model in MatlabSimulink to analysis the fault current. We take analysis of current at normal condition and observed Voltage Current waveforms. After that create LG, LL and LLG fault at Load terminal, from analysis of fault Current we can observe that the nature of fault current at different location is change. This is shown in the form graph. REFERENCES: [1] Umar Maqbool, Umer Amir Khan, “FaultCurrentAnalysis for Grid Connected and Islanded Microgrid Modes,” [2] F.Katiraei, M. R. Iravani, P. W. Lehn, “Microgrid Autonomous OperationDuringAndSubsequentToIslanding Process,” IEEE Transactions on Power Delivery, Vol. 20, No. 1,pp 248-257 Jan 2005. [3] Manjeet Singh, Prasenjit Basak, “BehaviorOf Fault Current in Microgrid Systems,” 978-1-5090-4530-3/16 ©2016 IEEE. [4] JIN Qiang , ZHANG Shuo, LI Yong-li, “A Study Of Capacity Of Distributed Generation And Its Effect On Short Circuit Current At Microgrid Operation Mode,”978-1-4577-0365- 2/11 ©2011 IEEE. [5] Ritu Singh, MD Danish Raza Ansar S.P. Shukla, P.R. Thakura “Microgrid and its currentstatusinIndia:a review”, Research Journal of Engineering ISSN 2278 – 9472 Vol.7(1), 11-15, January (2018). [6] Ye Xu, Zhao-hong Shi, Jin-quan Wang, Peng-fei Hou”, Discussion on the Factors Affecting the StabilityofMicrogrid Based on Distributed Power Supply”, Energy and Power Engineering, 2013, 5, 1344-1346 doi:10.4236/epe.2013.54B254 Published Online July 2013 [7] Binh Phan, H. N. (2019). transient stability of low voltage micro grid. 2019 international conference on system scienceand engineering (pp. 1-5). vietnam: ICSSE. [8] D. P. Kothari And I. J. Nagrath “Modern Power System Analysis”, Tata McGraw Hill Education, New Delhi, 2003.