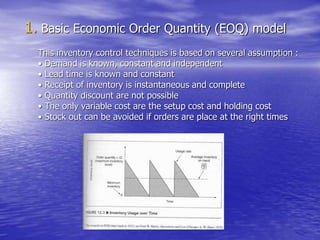
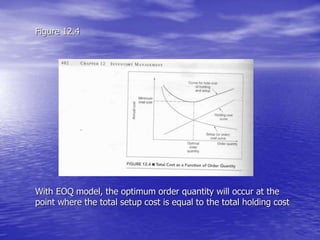
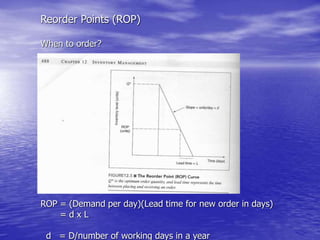
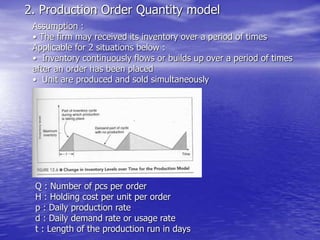
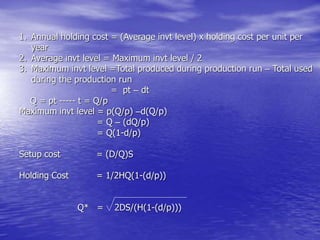
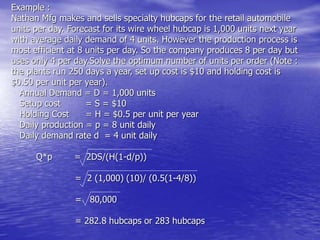
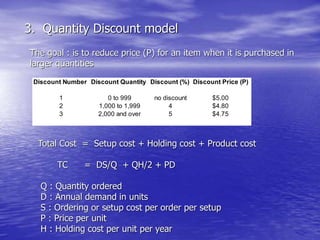
Inventory Management
Learning Objectives
• Understand the function and concerns of the
inventory
• Understand the inventory management
• Understand optimum order quantity to minimize
inventory cost but maintain customer service, How
much to order? When?
Function of having inventories
• To improve customer service (improve
responsiveness)
• Reduce cost :
- Economic scale of production
- Transportation cost/ ordering cost
- Quantity discounts
- Anticipate future inflation
- Anticipate uncertainties in the supply that impact to
the operating cost
Some concerns of having
inventory
• Inventories are considered waste full (Holding cost)
• Mask quality problems. Correcting quality problems can be slow
• Promotes an insular attitudes about management of the supply
channel.
Some cost concern about inventory :
• Holding Cost : The cost to keep or carry inventory in stock
• Ordering Cost : The cost of the ordering process
• Setup Cost : The cost to prepare a machine or process for
production
Type of Inventory
• Raw Material Inventory
• Work in Process Inventory (WIP)
• Maintenance/Repair/ Operating
Supplies (MRO) Inventory
• Finished good Inventory
• ABC Analysis – How inventory items can be
classified
- Using Pareto principle based on annual dollar usage.
- A item : 15% items ----rep 70%-80% of total $ usage
- B item : 30% items ----rep 15%-25% of total $ usage
- C item : 55% items ----rep 5% of total $ usage
Inventory Management
0
10
20
30
40
50
60
70
80
90
A Item B Item C Item
% of annual dollar usage
%ofinventoryitems
Series1
• Accurate inventory Record
- Record Accuracy :
Warehouse should be :
• Limited access,
• Good house keeping,
• Bins, shelf space and parts should be labeled accurately.
- Cycle Counting:
Items are counted, records are verified, inaccuracies are
periodically documented. The cause of inaccuracies are traced
and action are taken to fix it.
Past method : Annual physical inventory –
stock take
Address 2 questions : How much to order ? & When ?
3 Inventory control Models :
• Basic Economic Order Quantity (EOQ) model
• Production Order Quantity Model
• Quantity Discount Model
The goal is : Minimizing the total cost of
inventory
Inventory control Models
1. Basic Economic Order Quantity (EOQ) model
This inventory control techniques is based on several assumption :
• Demand is known, constant and independent
• Lead time is known and constant
• Receipt of inventory is instantaneous and complete
• Quantity discount are not possible
• The only variable cost are the setup cost and holding cost
• Stock out can be avoided if orders are place at the right times
Figure 12.4
With EOQ model, the optimum order quantity will occur at the
point where the total setup cost is equal to the total holding cost
Some formula’s to determine optimum order quantity at
minimum cost :
Q : number of pcs per order
Q* : optimum number of pcs per order (EOQ)
D : Annual demand in units for the inventory item
S : Setup or ordering cost per unit per year
H : Holding or carrying cost per unit per year
1. Annual setup cost : (D/Q)S
2. Annual Holding Cost : (Q/2)H
3. Optimum Order Quantity :
Annual setup cost = Annual Holding cost
(D/Q)S = (Q/2)H
Q* = 2DS/H
Reorder Points (ROP)
When to order?
Figure 12.5
ROP = (Demand per day)(Lead time for new order in days)
= d x L
d = D/number of working days in a year
Example :
Electronic assembler has a demand for 8,000 television per year.
The firm operates a 250 working days per year. On average,
delivery of an order take 3 working days. We calculate reorder
point as :
d = D/Number of working days in a year
= 8,000/ 250
= 32 unit.
ROP = d x L
= 32 unit x 3 days
= 96 unit.
So when inventory drop to 96 unit, an order should be placed.
2. Production Order Quantity model
Assumption :
• The firm may received its inventory over a period of times
Applicable for 2 situations below :
• Inventory continuously flows or builds up over a period of times
after an order has been placed
• Unit are produced and sold simultaneously
Q : Number of pcs per order
H : Holding cost per unit per order
p : Daily production rate
d : Daily demand rate or usage rate
t : Length of the production run in days
1. Annual holding cost = (Average invt level) x holding cost per unit per
year
2. Average invt level = Maximum invt level / 2
3. Maximum invt level =Total produced during production run – Total used
during the production run
= pt – dt
Q = pt ----- t = Q/p
Maximum invt level = p(Q/p) –d(Q/p)
= Q – (dQ/p)
= Q(1-d/p)
Setup cost = (D/Q)S
Holding Cost = 1/2HQ(1-(d/p))
Q* = 2DS/(H(1-(d/p)))
Example :
Nathan Mfg makes and sells specialty hubcaps for the retail automobile
units per day. Forecast for its wire wheel hubcap is 1,000 units next year
with average daily demand of 4 units. However the production process is
most efficient at 8 units per day. So the company produces 8 per day but
uses only 4 per day.Solve the optimum number of units per order (Note :
the plants run 250 days a year, set up cost is $10 and holding cost is
$0.50 per unit per year).
Annual Demand = D = 1,000 units
Setup cost = S = $10
Holding Cost = H = $0.5 per unit per year
Daily production = p = 8 unit daily
Daily demand rate d = 4 unit daily
Q*p = 2DS/(H(1-d/p))
= 2 (1,000) (10)/ (0.5(1-4/8))
= 80,000
= 282.8 hubcaps or 283 hubcaps
3. Quantity Discount model
The goal : is to reduce price (P) for an item when it is purchased in
larger quantities
Discount Number Discount Quantity Discount (%) Discount Price (P)
1 0 to 999 no discount $5.00
2 1,000 to 1,999 4 $4.80
3 2,000 and over 5 $4.75
Total Cost = Setup cost + Holding cost + Product cost
TC = DS/Q + QH/2 + PD
Q : Quantity ordered
D : Annual demand in units
S : Ordering or setup cost per order per setup
P : Price per unit
H : Holding cost per unit per year
The Steps to determine Optimum Quantity order :
1. Calculate value of optimum order for each discount Q* = 2DS/IP,
Holding cost (I) as percentage of unit price (P)
2. If order quantity is too low, adjust the order qty upward to the lowest
qty that will qualify for the discount
3. Compute Total cost for each
4. Select Q* with the lowest total cost
Example : The store stocks toy race cars. Recently, the store has been
given a quantity discount schedule for these cars. The normal cost for
the race car is $5.00. For orders between 1,000 and 1,999 units, the
unit cost drops to $4.80; for orders 2,000 or more units, the unit cost
is only$4.75. Furthermore, ordering cost is $49.00 per order, annual
demand is 5,000 race cars and inventory carrying charge as a percent
of cost is 20%. What order quantity will minimize the total inventory
cost?
1. Q1* = 2DS/IP = 2(5,000)(49)/(20%)(5.00) = 700 cars order
Q2* = 2DS/IP = 2(5,000)(49)/(20%)(4.80) = 714 cars order
Q3* = 2DS/IP = 2(5,000)(49)/(20%)(4.75) = 718 cars order
2.
Q1* = 700
Q2* = 1,000 adjusted
Q3* = 2,000 adjusted
3. Calculate Total Cost each discount
TC = DS/Q + QH/2 + PD
Annual Product Cost = PD
Annual ordering cost = DS/Q
Annual Holding cost = QH/2 = QIP/2
4. Select Order Quantity at the lowest cost
1,000 units
Discount
Number Unit rice (P) Order Quantity
Annual Product
Cost
Annual
Ordering Cost
Annual
Holding Cost
Total
Cost
1 $5.00 700 $25,000.00 $350 $350 $25,700
2 $4.80 1,000 $24,000.00 $245 $480 $24,725
3 $4.75 2,000 $23,750.00 $122,5 $950 $24,823

Inventory management1

  • 1.
  • 2.
    Learning Objectives • Understandthe function and concerns of the inventory • Understand the inventory management • Understand optimum order quantity to minimize inventory cost but maintain customer service, How much to order? When?
  • 3.
    Function of havinginventories • To improve customer service (improve responsiveness) • Reduce cost : - Economic scale of production - Transportation cost/ ordering cost - Quantity discounts - Anticipate future inflation - Anticipate uncertainties in the supply that impact to the operating cost
  • 4.
    Some concerns ofhaving inventory • Inventories are considered waste full (Holding cost) • Mask quality problems. Correcting quality problems can be slow • Promotes an insular attitudes about management of the supply channel. Some cost concern about inventory : • Holding Cost : The cost to keep or carry inventory in stock • Ordering Cost : The cost of the ordering process • Setup Cost : The cost to prepare a machine or process for production
  • 5.
    Type of Inventory •Raw Material Inventory • Work in Process Inventory (WIP) • Maintenance/Repair/ Operating Supplies (MRO) Inventory • Finished good Inventory
  • 6.
    • ABC Analysis– How inventory items can be classified - Using Pareto principle based on annual dollar usage. - A item : 15% items ----rep 70%-80% of total $ usage - B item : 30% items ----rep 15%-25% of total $ usage - C item : 55% items ----rep 5% of total $ usage Inventory Management 0 10 20 30 40 50 60 70 80 90 A Item B Item C Item % of annual dollar usage %ofinventoryitems Series1
  • 7.
    • Accurate inventoryRecord - Record Accuracy : Warehouse should be : • Limited access, • Good house keeping, • Bins, shelf space and parts should be labeled accurately. - Cycle Counting: Items are counted, records are verified, inaccuracies are periodically documented. The cause of inaccuracies are traced and action are taken to fix it. Past method : Annual physical inventory – stock take
  • 8.
    Address 2 questions: How much to order ? & When ? 3 Inventory control Models : • Basic Economic Order Quantity (EOQ) model • Production Order Quantity Model • Quantity Discount Model The goal is : Minimizing the total cost of inventory Inventory control Models
  • 9.
    1. Basic EconomicOrder Quantity (EOQ) model This inventory control techniques is based on several assumption : • Demand is known, constant and independent • Lead time is known and constant • Receipt of inventory is instantaneous and complete • Quantity discount are not possible • The only variable cost are the setup cost and holding cost • Stock out can be avoided if orders are place at the right times
  • 10.
    Figure 12.4 With EOQmodel, the optimum order quantity will occur at the point where the total setup cost is equal to the total holding cost
  • 11.
    Some formula’s todetermine optimum order quantity at minimum cost : Q : number of pcs per order Q* : optimum number of pcs per order (EOQ) D : Annual demand in units for the inventory item S : Setup or ordering cost per unit per year H : Holding or carrying cost per unit per year 1. Annual setup cost : (D/Q)S 2. Annual Holding Cost : (Q/2)H 3. Optimum Order Quantity : Annual setup cost = Annual Holding cost (D/Q)S = (Q/2)H Q* = 2DS/H
  • 12.
    Reorder Points (ROP) Whento order? Figure 12.5 ROP = (Demand per day)(Lead time for new order in days) = d x L d = D/number of working days in a year
  • 13.
    Example : Electronic assemblerhas a demand for 8,000 television per year. The firm operates a 250 working days per year. On average, delivery of an order take 3 working days. We calculate reorder point as : d = D/Number of working days in a year = 8,000/ 250 = 32 unit. ROP = d x L = 32 unit x 3 days = 96 unit. So when inventory drop to 96 unit, an order should be placed.
  • 14.
    2. Production OrderQuantity model Assumption : • The firm may received its inventory over a period of times Applicable for 2 situations below : • Inventory continuously flows or builds up over a period of times after an order has been placed • Unit are produced and sold simultaneously Q : Number of pcs per order H : Holding cost per unit per order p : Daily production rate d : Daily demand rate or usage rate t : Length of the production run in days
  • 15.
    1. Annual holdingcost = (Average invt level) x holding cost per unit per year 2. Average invt level = Maximum invt level / 2 3. Maximum invt level =Total produced during production run – Total used during the production run = pt – dt Q = pt ----- t = Q/p Maximum invt level = p(Q/p) –d(Q/p) = Q – (dQ/p) = Q(1-d/p) Setup cost = (D/Q)S Holding Cost = 1/2HQ(1-(d/p)) Q* = 2DS/(H(1-(d/p)))
  • 16.
    Example : Nathan Mfgmakes and sells specialty hubcaps for the retail automobile units per day. Forecast for its wire wheel hubcap is 1,000 units next year with average daily demand of 4 units. However the production process is most efficient at 8 units per day. So the company produces 8 per day but uses only 4 per day.Solve the optimum number of units per order (Note : the plants run 250 days a year, set up cost is $10 and holding cost is $0.50 per unit per year). Annual Demand = D = 1,000 units Setup cost = S = $10 Holding Cost = H = $0.5 per unit per year Daily production = p = 8 unit daily Daily demand rate d = 4 unit daily Q*p = 2DS/(H(1-d/p)) = 2 (1,000) (10)/ (0.5(1-4/8)) = 80,000 = 282.8 hubcaps or 283 hubcaps
  • 17.
    3. Quantity Discountmodel The goal : is to reduce price (P) for an item when it is purchased in larger quantities Discount Number Discount Quantity Discount (%) Discount Price (P) 1 0 to 999 no discount $5.00 2 1,000 to 1,999 4 $4.80 3 2,000 and over 5 $4.75 Total Cost = Setup cost + Holding cost + Product cost TC = DS/Q + QH/2 + PD Q : Quantity ordered D : Annual demand in units S : Ordering or setup cost per order per setup P : Price per unit H : Holding cost per unit per year
  • 18.
    The Steps todetermine Optimum Quantity order : 1. Calculate value of optimum order for each discount Q* = 2DS/IP, Holding cost (I) as percentage of unit price (P) 2. If order quantity is too low, adjust the order qty upward to the lowest qty that will qualify for the discount 3. Compute Total cost for each 4. Select Q* with the lowest total cost Example : The store stocks toy race cars. Recently, the store has been given a quantity discount schedule for these cars. The normal cost for the race car is $5.00. For orders between 1,000 and 1,999 units, the unit cost drops to $4.80; for orders 2,000 or more units, the unit cost is only$4.75. Furthermore, ordering cost is $49.00 per order, annual demand is 5,000 race cars and inventory carrying charge as a percent of cost is 20%. What order quantity will minimize the total inventory cost? 1. Q1* = 2DS/IP = 2(5,000)(49)/(20%)(5.00) = 700 cars order Q2* = 2DS/IP = 2(5,000)(49)/(20%)(4.80) = 714 cars order Q3* = 2DS/IP = 2(5,000)(49)/(20%)(4.75) = 718 cars order
  • 19.
    2. Q1* = 700 Q2*= 1,000 adjusted Q3* = 2,000 adjusted 3. Calculate Total Cost each discount TC = DS/Q + QH/2 + PD Annual Product Cost = PD Annual ordering cost = DS/Q Annual Holding cost = QH/2 = QIP/2 4. Select Order Quantity at the lowest cost 1,000 units Discount Number Unit rice (P) Order Quantity Annual Product Cost Annual Ordering Cost Annual Holding Cost Total Cost 1 $5.00 700 $25,000.00 $350 $350 $25,700 2 $4.80 1,000 $24,000.00 $245 $480 $24,725 3 $4.75 2,000 $23,750.00 $122,5 $950 $24,823