Downloaded 205 times

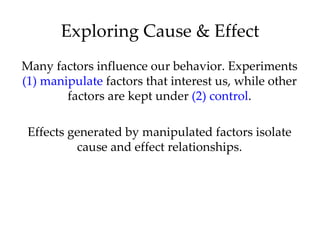
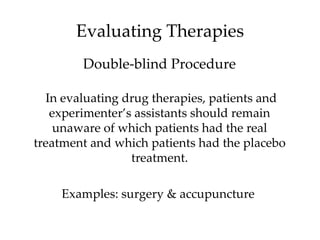
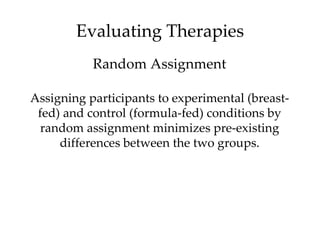
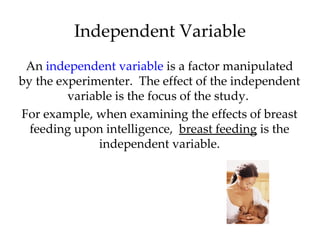
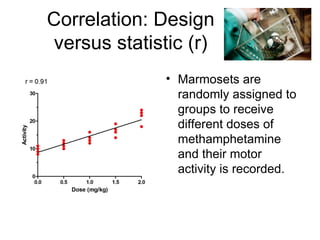
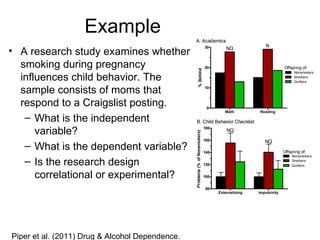
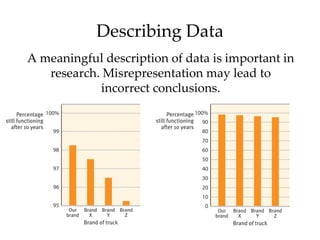
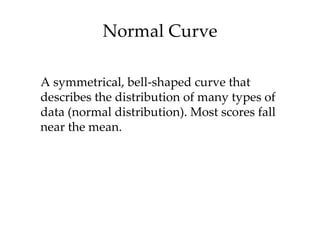
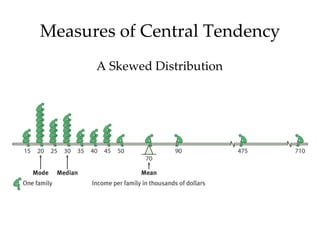
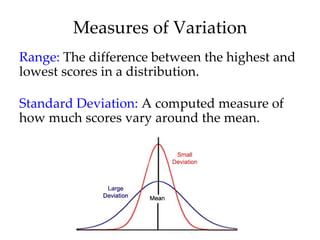
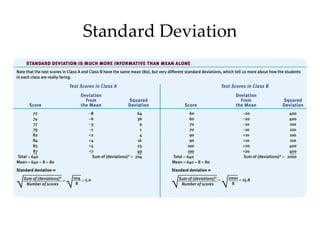
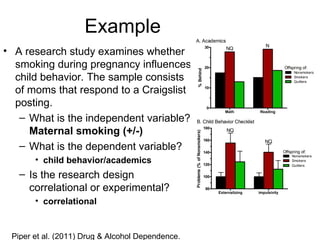

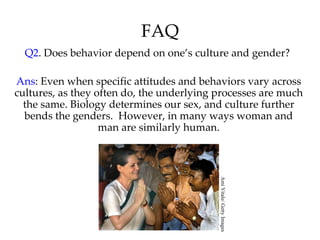
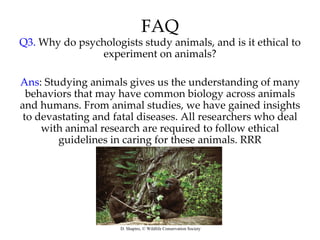

The document discusses essential concepts in psychological research, including theories, hypotheses, research methods such as case studies, surveys, and experiments, and the importance of correlation and causation. It also highlights criteria for conducting reliable experiments and making inferences about data, alongside the role of ethics in psychological research. Furthermore, it addresses common questions about the application and implications of psychology in understanding human behavior.