Downloaded 686 times


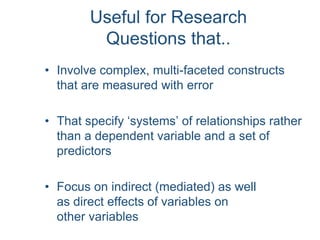


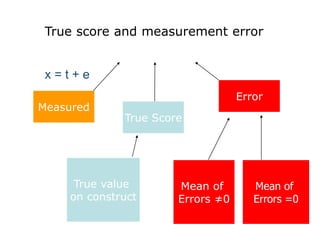

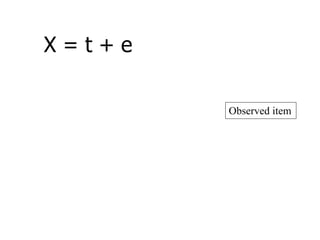
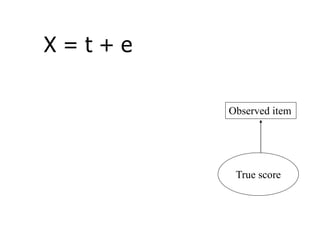
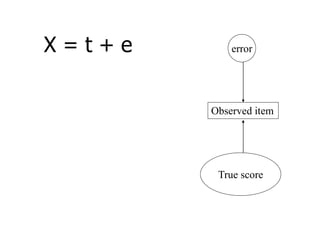
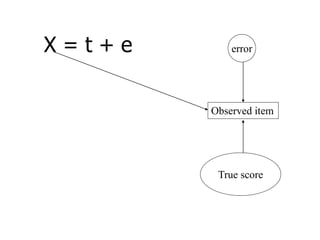
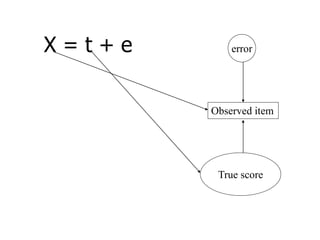

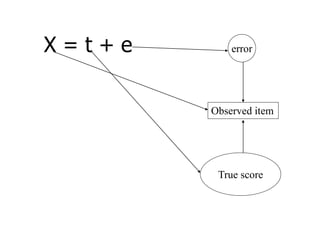
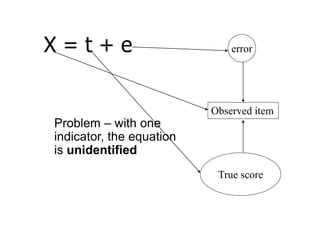
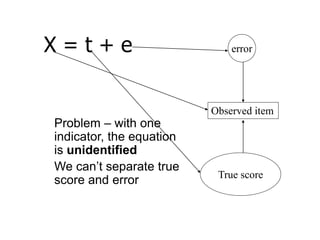

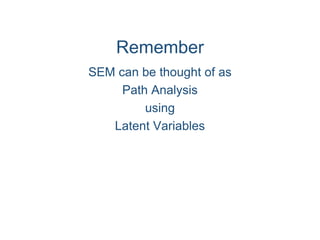


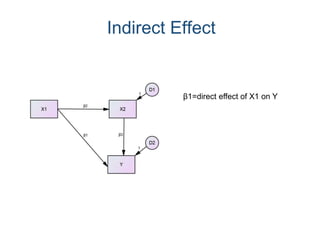
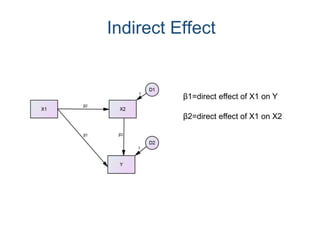
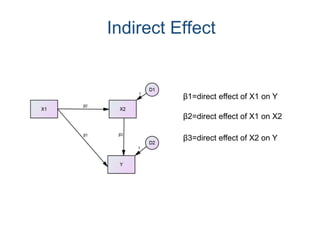
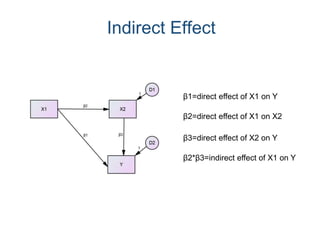
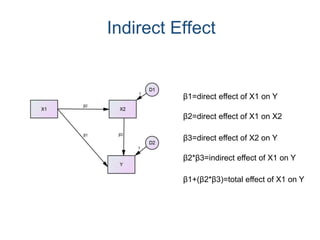
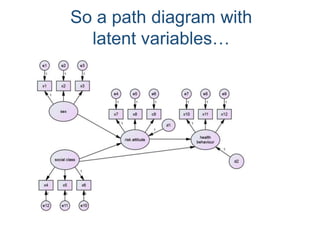
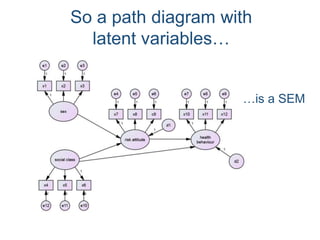


SEM is not a single statistical technique but rather integrates multiple multivariate techniques like factor analysis, path analysis, and regression into a unified framework. It allows modeling of complex latent constructs that are measured with error through multiple observed variables. Path analysis using latent variables can partition variance between true scores on latent variables and measurement error, and examine direct, indirect, and total effects in a system of relationships between variables.