Download as PDF, PPTX

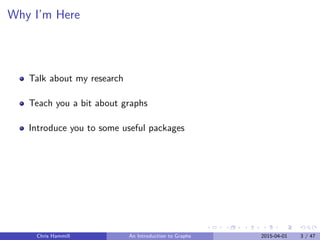
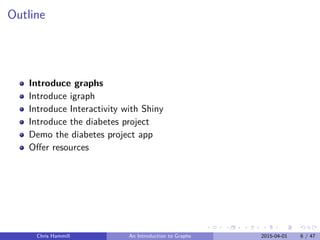


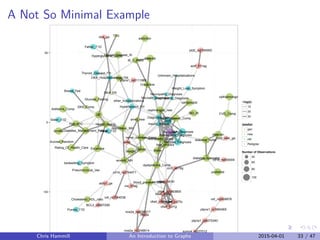
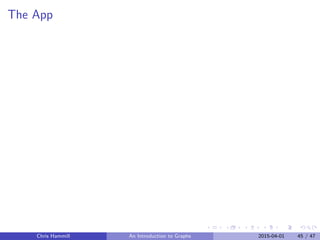
![Summary Statistics
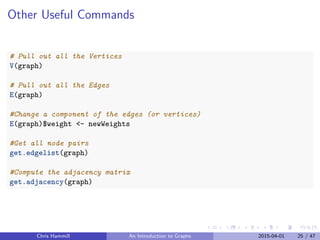
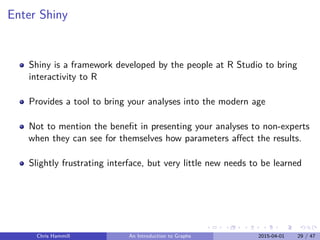
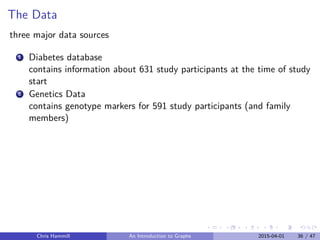
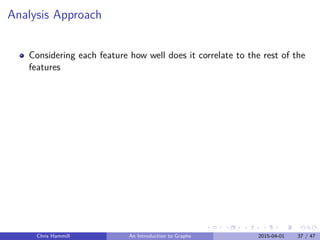
Diameter
diameter(randomGraph)
## [1] 4
Path Length
average.path.length(randomGraph)
## [1] 2.052632
Chris Hammill An Introduction to Graphs 2015-04-01 24 / 47](https://image.slidesharecdn.com/graphswithr-150413170508-conversion-gate01/85/Introduction-To-Igraph-and-Shiny-27-320.jpg)
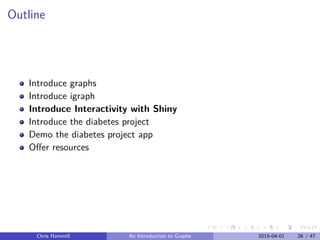
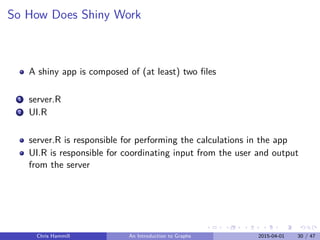
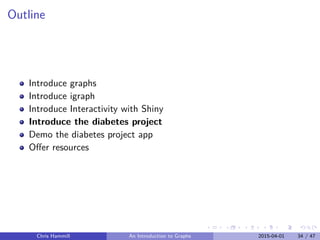
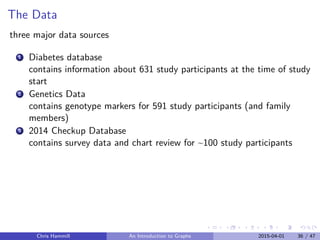
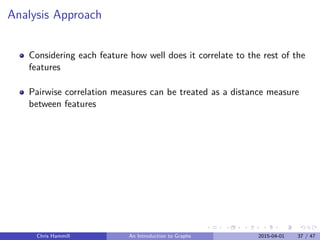
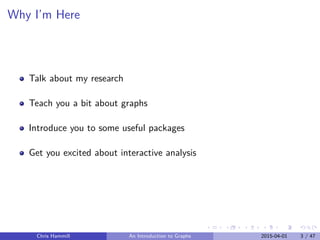
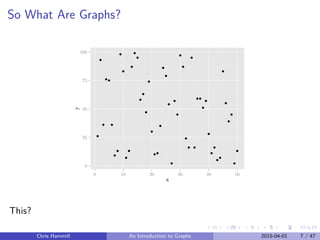
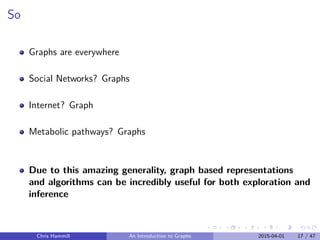
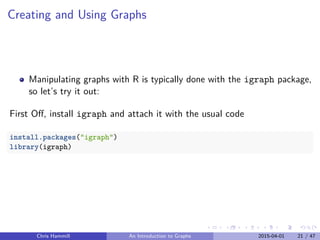
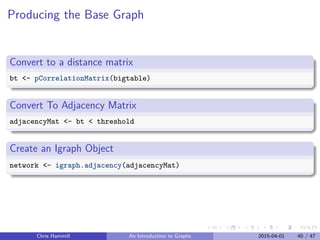
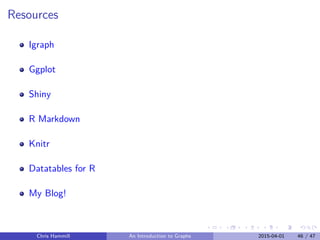
![Creating the Graph
Challenge in going from
Spread Sheet Representation
head(bigtable[25:28,c(1,21,23, 41)])
## Pedigree dietician_new nephrologist_new Hgb_A1C_new
## 25 93001 0 0 8.7
## 26 94001 3 0 10.2
## 27 101001 0 0 9.2
## 28 105001 0 0 13.7
Chris Hammill An Introduction to Graphs 2015-04-01 38 / 47](https://image.slidesharecdn.com/graphswithr-150413170508-conversion-gate01/85/Introduction-To-Igraph-and-Shiny-48-320.jpg)
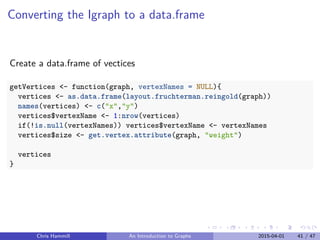
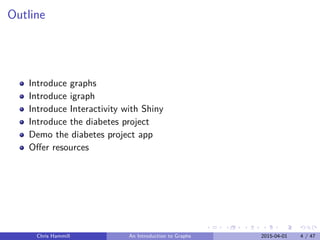
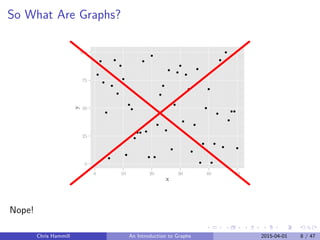
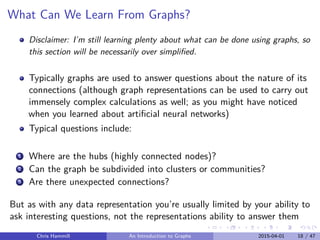
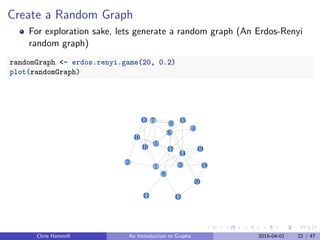
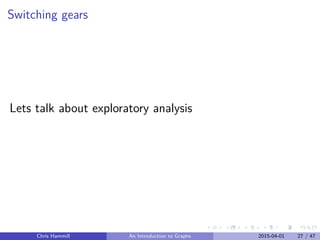
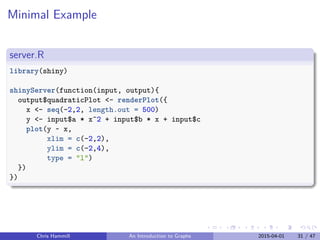
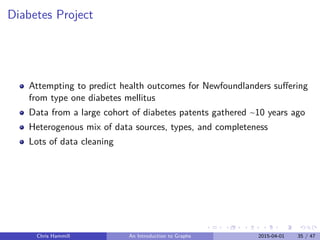
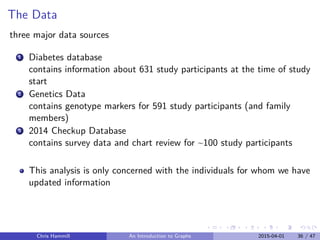
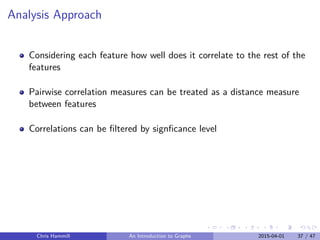
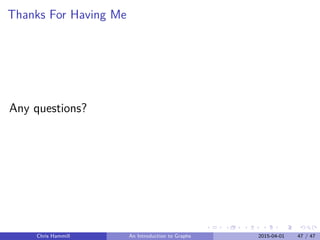
![Converting the Igraph to a data.frame
Create a data.frame of edges
getEdges <- function(graph, vertices){
edgeLocations <- get.edgelist(graph)
edgeCoords <- mapply(function(v1,v2){
c(vertices[v1,], vertices[v2,])
}, edgeLocations[,1], edgeLocations[,2])
edgeFrame <- as.data.frame(t(edgeCoords))[,c(1,2,5,6)]
edgeFrame[,1:4] <- lapply(edgeFrame[,1:4], as.numeric)
edgeFrame$weight <- get.edge.attribute(graph, "weight")
edgeFrame$npo <- get.edge.attribute(graph, "npo")
names(edgeFrame) <- c("x0", "y0", "x1", "y1", "weight", "npo")
return(edgeFrame)
}
Chris Hammill An Introduction to Graphs 2015-04-01 42 / 47](https://image.slidesharecdn.com/graphswithr-150413170508-conversion-gate01/85/Introduction-To-Igraph-and-Shiny-52-320.jpg)


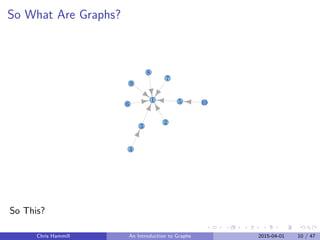
The document provides an introduction to graphs presented by Chris Hammill. It begins with an outline of the topics to be covered, which include introducing graphs and the igraph package in R, interactive analysis using Shiny, the diabetes research project, demonstrating a Shiny app for the project, and offering additional resources. The goal is to teach about graphs through discussing Hammill's research, demonstrating useful R packages, and getting the audience excited about interactive data analysis.


![谷歌留痕技术 [ 𝙩𝙤𝙥 𝟮𝟯𝟯. 𝙘 𝙤𝙢 ]](https://cdn.slidesharecdn.com/ss_thumbnails/top233-260130174328-3833018c-thumbnail.jpg?width=640&height=640&fit=bounds)