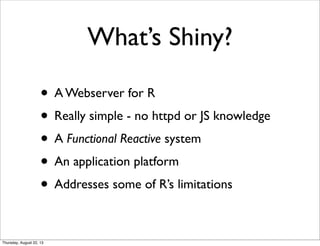
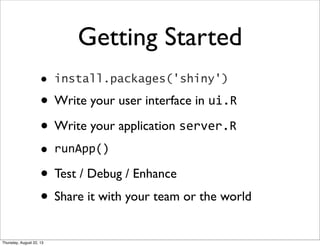
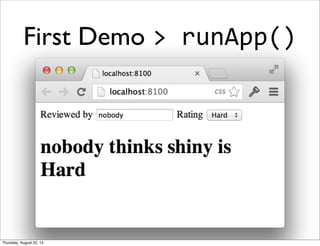
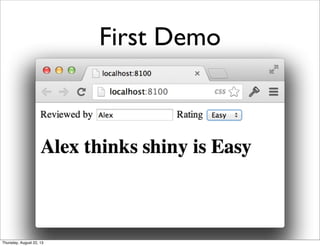
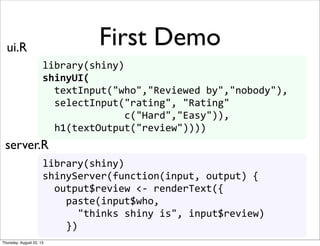
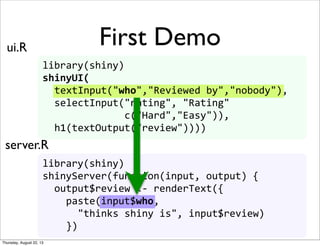
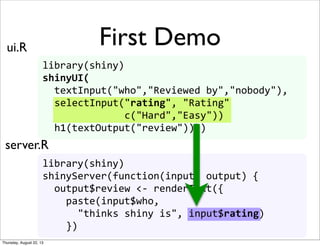
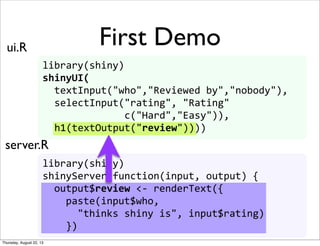
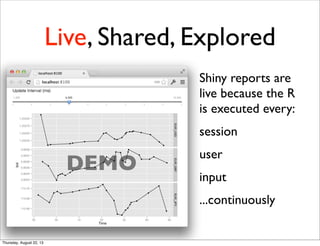
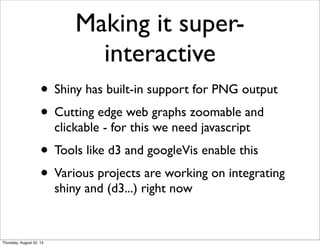
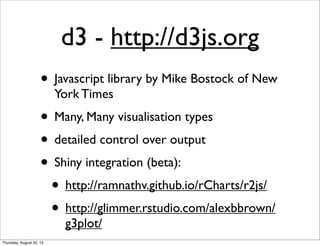
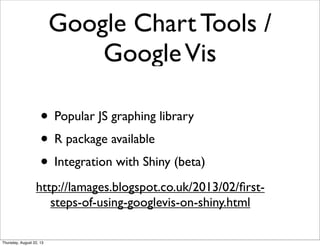
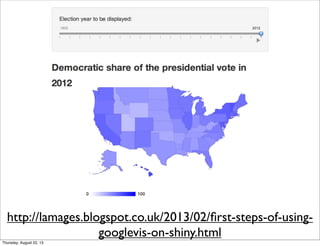
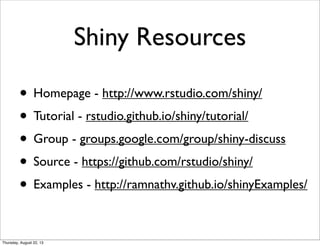
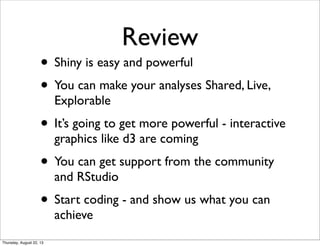
Shiny
Live / Shared / Explored
BARUG May 2013 Alex B Brown
Thursday, August 22, 13
Agenda
• Why Shiny?
• First steps in shiny - text and graphics
• Shiny and d3
• Resources
Thursday, August 22, 13
R today
) Excellent statistics platform
) Fabulous graphics
• A personal experience - not a shared one
( Graphics are typically static - manipulated
in code, not in the visualisation
( Too slow and memory hungry
( Single threaded
Thursday, August 22, 13
What’s Shiny?
• A Webserver for R
• Really simple - no httpd or JS knowledge
• A Functional Reactive system
• An application platform
• Addresses some of R’s limitations
Thursday, August 22, 13
Getting Started
• install.packages('shiny')
• Write your user interface in ui.R
• Write your application server.R
• runApp()
• Test / Debug / Enhance
• Share it with your team or the world
Thursday, August 22, 13
First Demo
library(shiny)
shinyUI(
	
  	
  textInput("who","Reviewed	
  by","nobody"),
	
  	
  selectInput("rating",	
  "Rating"


  c("Hard","Easy")),
	
  	
  h1(textOutput("review"))))
library(shiny)
shinyServer(function(input,	
  output)	
  {	


  output$review	
  <-­‐	
  renderText({


  paste(input$who,	


  "thinks	
  shiny	
  is",	
  input$rating)


  })
ui.R
server.R
always use library(shiny)
at the start of ui.R and
server.R
Thursday, August 22, 13
First Demo >	
  runApp()
Thursday, August 22, 13
First Demo
Thursday, August 22, 13
library(shiny)
shinyUI(
	
  	
  textInput("who","Reviewed	
  by","nobody"),
	
  	
  selectInput("rating",	
  "Rating"


  c("Hard","Easy")),
	
  	
  h1(textOutput("review"))))
library(shiny)
shinyServer(function(input,	
  output)	
  {	


  output$review	
  <-­‐	
  renderText({


  paste(input$who,	


  "thinks	
  shiny	
  is",	
  input$review)


  })
First Demoui.R
server.R
Thursday, August 22, 13
library(shiny)
shinyUI(
	
  	
  textInput("who","Reviewed	
  by","nobody"),
	
  	
  selectInput("rating",	
  "Rating"


  c("Hard","Easy")),
	
  	
  h1(textOutput("review"))))
library(shiny)
shinyServer(function(input,	
  output)	
  {	


  output$review	
  <-­‐	
  renderText({


  paste(input$who,	


  "thinks	
  shiny	
  is",	
  input$review)


  })
input$who
First Demoui.R
server.R
textInput("who","Reviewed	
  by","nobody")
Thursday, August 22, 13
library(shiny)
shinyUI(
	
  	
  textInput("who","Reviewed	
  by","nobody"),
	
  	
  selectInput("rating",	
  "Rating"


  c("Hard","Easy")),
	
  	
  h1(textOutput("review"))))
selectInput("rating",	
  "Rating"


  c("Hard","Easy"))
library(shiny)
shinyServer(function(input,	
  output)	
  {	


  output$review	
  <-­‐	
  renderText({


  paste(input$who,	


  "thinks	
  shiny	
  is",	
  input$review)


  })
First Demoui.R
server.R
input$rating
Thursday, August 22, 13
library(shiny)
shinyUI(
	
  	
  textInput("who","Reviewed	
  by","nobody"),
	
  	
  selectInput("rating",	
  "Rating"


  c("Hard","Easy")),
	
  	
  h1(textOutput("review"))))
library(shiny)
shinyServer(function(input,	
  output)	
  {	


  output$review	
  <-­‐	
  renderText({


  paste(input$who,	


  "thinks	
  shiny	
  is",	
  input$review)


  })
	
  	
  output$review	
  <-­‐	
  renderText({


  paste(input$who,	


  "thinks	
  shiny	
  is",	
  input$rating)


  })
First Demoui.R
server.R
h1(textOutput("review"))
Thursday, August 22, 13
First Demo - Review
• html input “who” is linked to R input$who
• R output$review is linked to html #review
• updates re-evaluate code automatically
• no javascript knowledge required
• this is the Function Reactive Web-server at
work
Thursday, August 22, 13
First Plot
shinyUI(div(
	
  	
  numericInput("binwidth","Bin	
  width",1),
	
  	
  selectInput("measurement","Measurement",
c("mpg","hp")),
	
  	
  plotOutput("myplot")))
shinyServer(function(input,	
  output)	
  {	


  output$myplot	
  <-­‐	
  renderPlot({
	
  print(ggplot(data=mtcars,
	
  	
  aes_string(x=input$measurement))+
	
  	
  geom_dotplot(binwidth=input$binwidth))	


})})
ui.R
server.R
Here ggplot2 needs to be
‘required’ at the start of
server.R only.
Thursday, August 22, 13
First Plot >	
  runApp()
Thursday, August 22, 13
First Plot Review
• Shiny supports all R plot types via ‘PNG’
• renderPlot foo is linked to plotOutput #foo
• Anything can be parameterised - numbers,
strings, functions, columns, methods, code
• Enables powerful ‘exploration’ of design
parameters for you
• Enables final user to adjust parameters
Thursday, August 22, 13
Live, Shared, Explored
Shiny reports are
live because the R
is executed every:
session
user
input
...continuously
DEMO
Thursday, August 22, 13
Live, Shared, Explored
Your reports are shared because:
Your whole team can see the most recent
version of the report - just share the URL
Your whole team can get involved in the
analysis
You can save and share where you navigated to
(* extra work required)
Thursday, August 22, 13
Live, Shared, Explored
Using tabs to select between datasets, reports
and visualisation - each with custom inputs and
outputs, you can enable your team to make
new discoveries in the data you already have.
Tabs allow whole new sets of inputs and graphs
to appear - completely customised in R using
ReactiveUI
Thursday, August 22, 13
Examples - stocks
• http://glimmer.rstudio.com/winston/stocks/
Thursday, August 22, 13
Making it super-
interactive
• Shiny has built-in support for PNG output
• Cutting edge web graphs zoomable and
clickable - for this we need javascript
• Tools like d3 and googleVis enable this
• Various projects are working on integrating
shiny and (d3...) right now
Thursday, August 22, 13
d3 - http://d3js.org
• Javascript library by Mike Bostock of New
York Times
• Many, Many visualisation types
• detailed control over output
• Shiny integration (beta):
• http://ramnathv.github.io/rCharts/r2js/
• http://glimmer.rstudio.com/alexbbrown/
g3plot/
Thursday, August 22, 13
d3 examples
Thursday, August 22, 13
• Popular JS graphing library
• R package available
• Integration with Shiny (beta)
Google Chart Tools /
GoogleVis
http://lamages.blogspot.co.uk/2013/02/first-
steps-of-using-googlevis-on-shiny.html
Thursday, August 22, 13
http://lamages.blogspot.co.uk/2013/02/first-steps-of-using-
googlevis-on-shiny.html
Thursday, August 22, 13
Shiny Resources
• Homepage - http://www.rstudio.com/shiny/
• Tutorial - rstudio.github.io/shiny/tutorial/
• Group - groups.google.com/group/shiny-discuss
• Source - https://github.com/rstudio/shiny/
• Examples - http://ramnathv.github.io/shinyExamples/
Thursday, August 22, 13
Review
• Shiny is easy and powerful
• You can make your analyses Shared, Live,
Explorable
• It’s going to get more powerful - interactive
graphics like d3 are coming
• You can get support from the community
and RStudio
• Start coding - and show us what you can
achieve
Thursday, August 22, 13
Q&A
• End of presentation
Thursday, August 22, 13

Shiny r, live shared and explored

  • 1.
    Shiny Live / Shared/ Explored BARUG May 2013 Alex B Brown Thursday, August 22, 13
  • 2.
    Agenda • Why Shiny? •First steps in shiny - text and graphics • Shiny and d3 • Resources Thursday, August 22, 13
  • 3.
    R today ) Excellentstatistics platform ) Fabulous graphics • A personal experience - not a shared one ( Graphics are typically static - manipulated in code, not in the visualisation ( Too slow and memory hungry ( Single threaded Thursday, August 22, 13
  • 4.
    What’s Shiny? • AWebserver for R • Really simple - no httpd or JS knowledge • A Functional Reactive system • An application platform • Addresses some of R’s limitations Thursday, August 22, 13
  • 5.
    Getting Started • install.packages('shiny') •Write your user interface in ui.R • Write your application server.R • runApp() • Test / Debug / Enhance • Share it with your team or the world Thursday, August 22, 13
  • 6.
    First Demo library(shiny) shinyUI(    textInput("who","Reviewed  by","nobody"),    selectInput("rating",  "Rating"                            c("Hard","Easy")),    h1(textOutput("review")))) library(shiny) shinyServer(function(input,  output)  {      output$review  <-­‐  renderText({        paste(input$who,              "thinks  shiny  is",  input$rating)        }) ui.R server.R always use library(shiny) at the start of ui.R and server.R Thursday, August 22, 13
  • 7.
    First Demo >  runApp() Thursday, August 22, 13
  • 8.
  • 9.
    library(shiny) shinyUI(    textInput("who","Reviewed  by","nobody"),    selectInput("rating",  "Rating"                            c("Hard","Easy")),    h1(textOutput("review")))) library(shiny) shinyServer(function(input,  output)  {      output$review  <-­‐  renderText({        paste(input$who,              "thinks  shiny  is",  input$review)        }) First Demoui.R server.R Thursday, August 22, 13
  • 10.
    library(shiny) shinyUI(    textInput("who","Reviewed  by","nobody"),    selectInput("rating",  "Rating"                            c("Hard","Easy")),    h1(textOutput("review")))) library(shiny) shinyServer(function(input,  output)  {      output$review  <-­‐  renderText({        paste(input$who,              "thinks  shiny  is",  input$review)        }) input$who First Demoui.R server.R textInput("who","Reviewed  by","nobody") Thursday, August 22, 13
  • 11.
    library(shiny) shinyUI(    textInput("who","Reviewed  by","nobody"),    selectInput("rating",  "Rating"                            c("Hard","Easy")),    h1(textOutput("review")))) selectInput("rating",  "Rating"                        c("Hard","Easy")) library(shiny) shinyServer(function(input,  output)  {      output$review  <-­‐  renderText({        paste(input$who,              "thinks  shiny  is",  input$review)        }) First Demoui.R server.R input$rating Thursday, August 22, 13
  • 12.
    library(shiny) shinyUI(    textInput("who","Reviewed  by","nobody"),    selectInput("rating",  "Rating"                            c("Hard","Easy")),    h1(textOutput("review")))) library(shiny) shinyServer(function(input,  output)  {      output$review  <-­‐  renderText({        paste(input$who,              "thinks  shiny  is",  input$review)        })    output$review  <-­‐  renderText({        paste(input$who,              "thinks  shiny  is",  input$rating)        }) First Demoui.R server.R h1(textOutput("review")) Thursday, August 22, 13
  • 13.
    First Demo -Review • html input “who” is linked to R input$who • R output$review is linked to html #review • updates re-evaluate code automatically • no javascript knowledge required • this is the Function Reactive Web-server at work Thursday, August 22, 13
  • 14.
    First Plot shinyUI(div(    numericInput("binwidth","Bin  width",1),    selectInput("measurement","Measurement", c("mpg","hp")),    plotOutput("myplot"))) shinyServer(function(input,  output)  {      output$myplot  <-­‐  renderPlot({  print(ggplot(data=mtcars,    aes_string(x=input$measurement))+    geom_dotplot(binwidth=input$binwidth))         })}) ui.R server.R Here ggplot2 needs to be ‘required’ at the start of server.R only. Thursday, August 22, 13
  • 15.
    First Plot >  runApp() Thursday, August 22, 13
  • 16.
    First Plot Review •Shiny supports all R plot types via ‘PNG’ • renderPlot foo is linked to plotOutput #foo • Anything can be parameterised - numbers, strings, functions, columns, methods, code • Enables powerful ‘exploration’ of design parameters for you • Enables final user to adjust parameters Thursday, August 22, 13
  • 17.
    Live, Shared, Explored Shinyreports are live because the R is executed every: session user input ...continuously DEMO Thursday, August 22, 13
  • 18.
    Live, Shared, Explored Yourreports are shared because: Your whole team can see the most recent version of the report - just share the URL Your whole team can get involved in the analysis You can save and share where you navigated to (* extra work required) Thursday, August 22, 13
  • 19.
    Live, Shared, Explored Usingtabs to select between datasets, reports and visualisation - each with custom inputs and outputs, you can enable your team to make new discoveries in the data you already have. Tabs allow whole new sets of inputs and graphs to appear - completely customised in R using ReactiveUI Thursday, August 22, 13
  • 20.
    Examples - stocks •http://glimmer.rstudio.com/winston/stocks/ Thursday, August 22, 13
  • 21.
    Making it super- interactive •Shiny has built-in support for PNG output • Cutting edge web graphs zoomable and clickable - for this we need javascript • Tools like d3 and googleVis enable this • Various projects are working on integrating shiny and (d3...) right now Thursday, August 22, 13
  • 22.
    d3 - http://d3js.org •Javascript library by Mike Bostock of New York Times • Many, Many visualisation types • detailed control over output • Shiny integration (beta): • http://ramnathv.github.io/rCharts/r2js/ • http://glimmer.rstudio.com/alexbbrown/ g3plot/ Thursday, August 22, 13
  • 23.
  • 24.
    • Popular JSgraphing library • R package available • Integration with Shiny (beta) Google Chart Tools / GoogleVis http://lamages.blogspot.co.uk/2013/02/first- steps-of-using-googlevis-on-shiny.html Thursday, August 22, 13
  • 25.
  • 26.
    Shiny Resources • Homepage- http://www.rstudio.com/shiny/ • Tutorial - rstudio.github.io/shiny/tutorial/ • Group - groups.google.com/group/shiny-discuss • Source - https://github.com/rstudio/shiny/ • Examples - http://ramnathv.github.io/shinyExamples/ Thursday, August 22, 13
  • 27.
    Review • Shiny iseasy and powerful • You can make your analyses Shared, Live, Explorable • It’s going to get more powerful - interactive graphics like d3 are coming • You can get support from the community and RStudio • Start coding - and show us what you can achieve Thursday, August 22, 13
  • 28.
    Q&A • End ofpresentation Thursday, August 22, 13