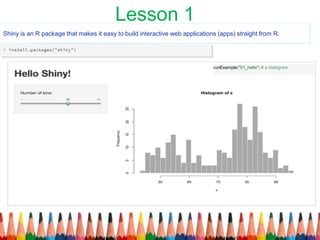
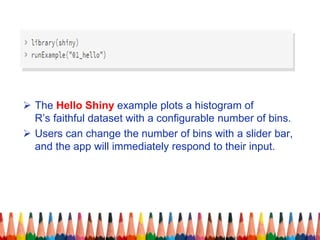
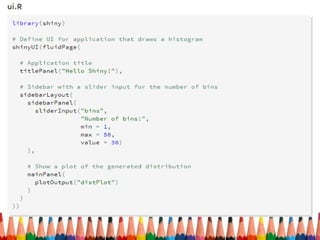
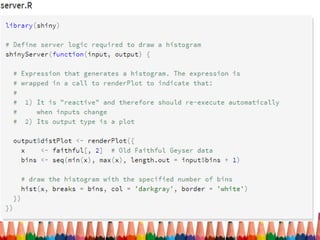
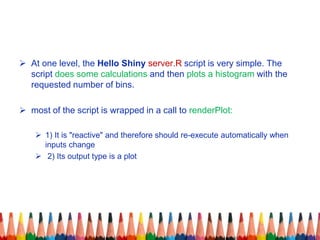
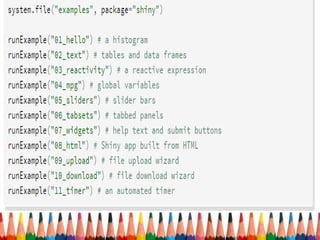
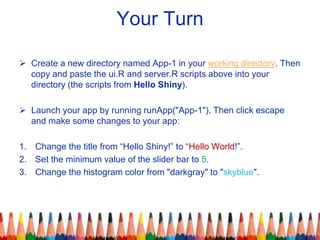
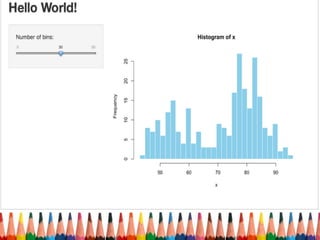
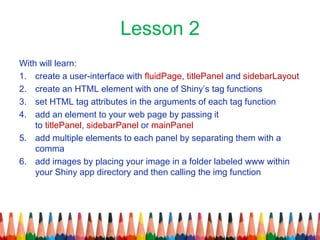
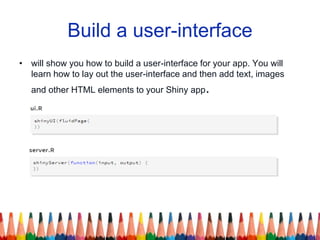
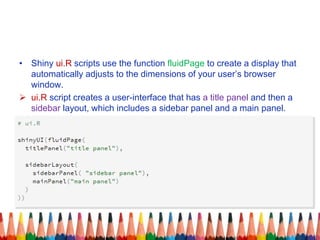
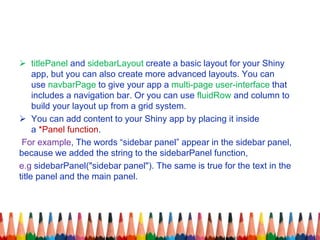
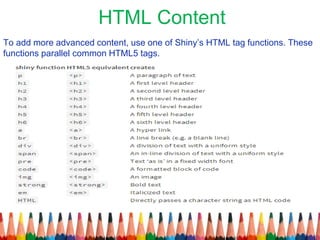
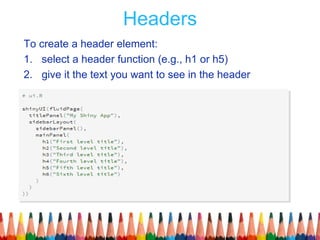
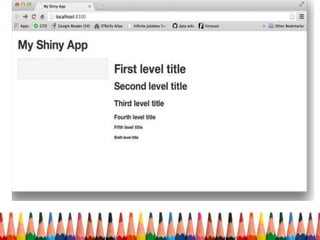
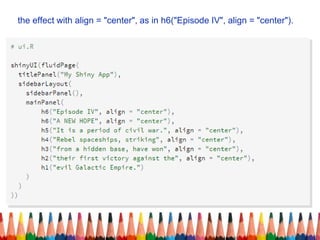
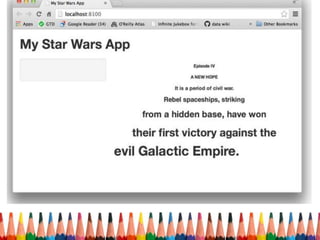
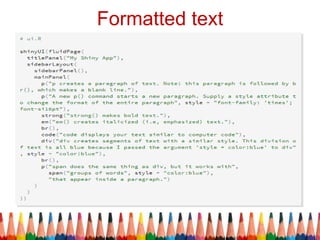
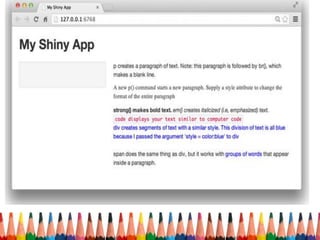
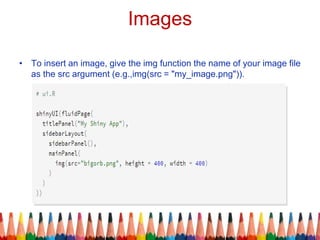
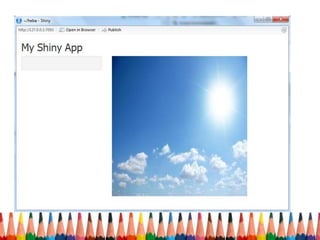
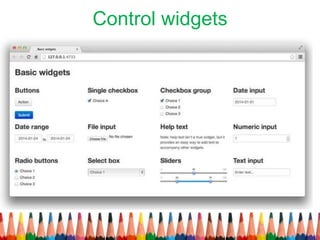
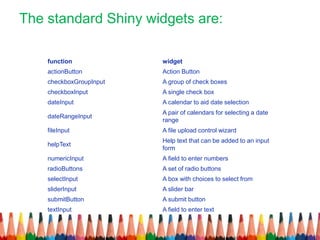
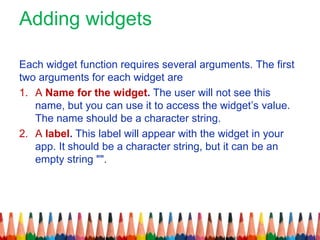
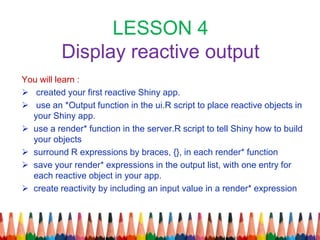
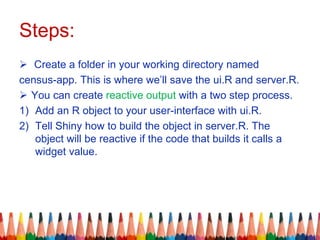
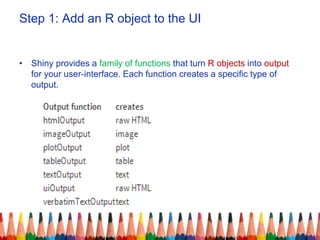
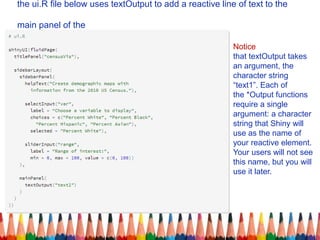
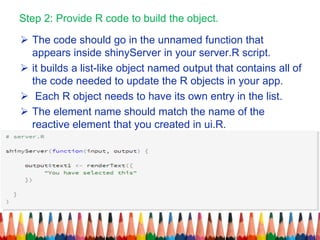
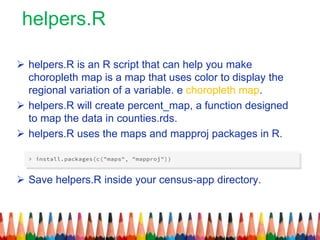
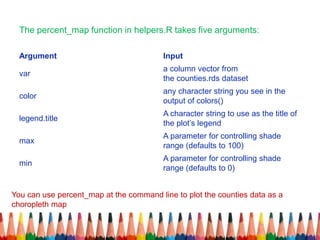
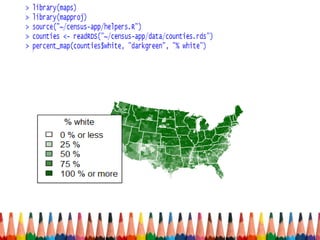
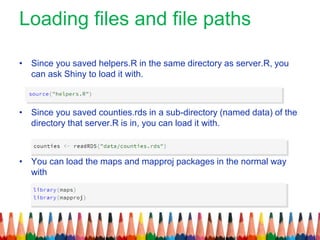
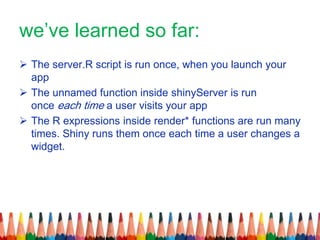
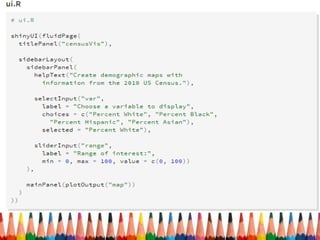
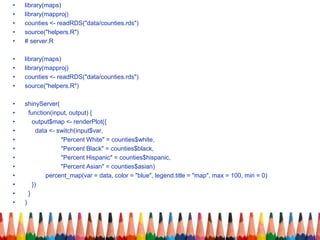
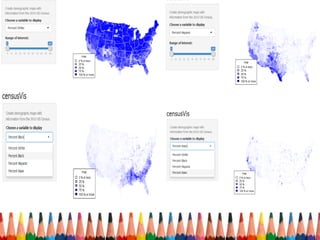
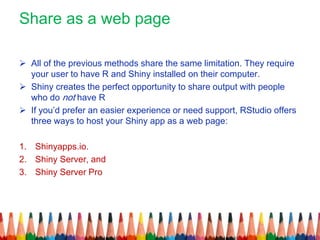
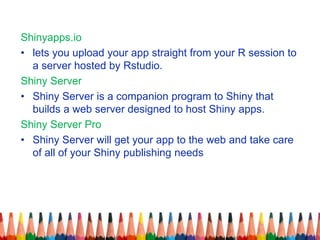
SlideShare a Scribd company logo
Chapter 5
Shiny
Shiny is an R package that makes it easy to build interactive web applications (apps) straight from R.
runExample("01_hello") # a histogram
Lesson 1
 The Hello Shiny example plots a histogram of
R’s faithful dataset with a configurable number of bins.
 Users can change the number of bins with a slider bar,
and the app will immediately respond to their input.
Structure of a Shiny App
Shiny apps have two components:
a user-interface (ui) script: controls the
layout and appearance of your app. It is
defined in a source script named ui.R.
The server.R script :contains the
instructions that your computer needs to
build your app.
 At one level, the Hello Shiny server.R script is very simple. The
script does some calculations and then plots a histogram with the
requested number of bins.
 most of the script is wrapped in a call to renderPlot:
 1) It is "reactive" and therefore should re-execute automatically when
inputs change
 2) Its output type is a plot
Your Turn
 Create a new directory named App-1 in your working directory. Then
copy and paste the ui.R and server.R scripts above into your
directory (the scripts from Hello Shiny).
 Launch your app by running runApp("App-1"). Then click escape
and make some changes to your app:
1. Change the title from “Hello Shiny!” to “Hello World!”.
2. Set the minimum value of the slider bar to 5.
3. Change the histogram color from "darkgray" to "skyblue".
Lesson 2
With will learn:
1. create a user-interface with fluidPage, titlePanel and sidebarLayout
2. create an HTML element with one of Shiny’s tag functions
3. set HTML tag attributes in the arguments of each tag function
4. add an element to your web page by passing it
to titlePanel, sidebarPanel or mainPanel
5. add multiple elements to each panel by separating them with a
comma
6. add images by placing your image in a folder labeled www within
your Shiny app directory and then calling the img function
Build a user-interface
• will show you how to build a user-interface for your app. You will
learn how to lay out the user-interface and then add text, images
and other HTML elements to your Shiny app.
• Shiny ui.R scripts use the function fluidPage to create a display that
automatically adjusts to the dimensions of your user’s browser
window.
 ui.R script creates a user-interface that has a title panel and then a
sidebar layout, which includes a sidebar panel and a main panel.
 Title Panel and sidebar Layout are the two most popular
elements to add to fluid Page.
 Sidebar Layout always takes two arguments:
1. sidebarPanel function output
2. mainPanel function output
• The sidebar panel will appear on the left side of your app by default.
You can move it to the right side by giving sidebar Layout the
optional argument position = "right".
 titlePanel and sidebarLayout create a basic layout for your Shiny
app, but you can also create more advanced layouts. You can
use navbarPage to give your app a multi-page user-interface that
includes a navigation bar. Or you can use fluidRow and column to
build your layout up from a grid system.
 You can add content to your Shiny app by placing it inside
a *Panel function.
For example, The words “sidebar panel” appear in the sidebar panel,
because we added the string to the sidebarPanel function,
e.g sidebarPanel("sidebar panel"). The same is true for the text in the
title panel and the main panel.
To add more advanced content, use one of Shiny’s HTML tag functions. These
functions parallel common HTML5 tags.
HTML Content
Headers
To create a header element:
1. select a header function (e.g., h1 or h5)
2. give it the text you want to see in the header
the effect with align = "center", as in h6("Episode IV", align = "center").
Formatted text
Images
• To insert an image, give the img function the name of your image file
as the src argument (e.g.,img(src = "my_image.png")).
LESSON 3
Add control widgets
This lesson will show you how to add control widgets to
your Shiny apps.
 widget :A web element that your users can interact with.
 Widgets provide a way for your users to send messages
to the Shiny app
 Shiny widgets collect a value from your user.
 When a user changes the widget, the value will change
as well.
Control widgets
The standard Shiny widgets are:
function widget
actionButton Action Button
checkboxGroupInput A group of check boxes
checkboxInput A single check box
dateInput A calendar to aid date selection
dateRangeInput
A pair of calendars for selecting a date
range
fileInput A file upload control wizard
helpText
Help text that can be added to an input
form
numericInput A field to enter numbers
radioButtons A set of radio buttons
selectInput A box with choices to select from
sliderInput A slider bar
submitButton A submit button
textInput A field to enter text
Adding widgets
Each widget function requires several arguments. The first
two arguments for each widget are
1. A Name for the widget. The user will not see this
name, but you can use it to access the widget’s value.
The name should be a character string.
2. A label. This label will appear with the widget in your
app. It should be a character string, but it can be an
empty string "".
LESSON 4
Display reactive output
You will learn :
 created your first reactive Shiny app.
 use an *Output function in the ui.R script to place reactive objects in
your Shiny app.
 use a render* function in the server.R script to tell Shiny how to build
your objects
 surround R expressions by braces, {}, in each render* function
 save your render* expressions in the output list, with one entry for
each reactive object in your app.
 create reactivity by including an input value in a render* expression
Steps:
 Create a folder in your working directory named
census-app. This is where we’ll save the ui.R and server.R.
 You can create reactive output with a two step process.
1) Add an R object to your user-interface with ui.R.
2) Tell Shiny how to build the object in server.R. The
object will be reactive if the code that builds it calls a
widget value.
Step 1: Add an R object to the UI
• Shiny provides a family of functions that turn R objects into output
for your user-interface. Each function creates a specific type of
output.
the ui.R file below uses textOutput to add a reactive line of text to the
main panel of the
Notice
that textOutput takes
an argument, the
character string
“text1”. Each of
the *Output functions
require a single
argument: a character
string that Shiny will
use as the name of
your reactive element.
Your users will not see
this name, but you will
use it later.
Step 2: Provide R code to build the object.
 The code should go in the unnamed function that
appears inside shinyServer in your server.R script.
 it builds a list-like object named output that contains all of
the code needed to update the R objects in your app.
 Each R object needs to have its own entry in the list.
 The element name should match the name of the
reactive element that you created in ui.R.
 You do not need to arrange for the unnamed function to return output in its
last line of code. R will automatically update output through reference class
semantics.
 Each entry to output should contain the output of one of
Shiny’s render* functions.
 Each render* function takes a single argument: an R expression surrounded
by braces, {}. The expression can be one simple line of text, or it can involve
many lines of code, as if it were a complicated function call.
 Think of this R expression as a set of instructions that you give Shiny to
store for later. Shiny will run the instructions when you first launch your app,
and then Shiny will re-run the instructions every time it needs to update your
object.
 For this to work, your expression should return the object you have in mind
(a piece of text, a plot, a data frame, etc). You will get an error if the
expression does not return an object, or if it returns the wrong type of object.
When you run the server.R script, the Shiny app will display “You have
selected this” in the main panel. However, the text will not be reactive.
It will not change even if you manipulate the widgets of your app.
Use widget values
• You can make the text reactive by asking Shiny to call a widget
value when it builds the text.
• Shiny will automatically make an object reactive if the object uses
an input value
• When a user changes a widget, Shiny will rebuild all of the outputs
that depend on the widget, using the new value of the widget as it
.goes
LESSON 5
Use R scripts and data
This lesson will show:
 how to load data, R Scripts, and packages to use in your
Shiny apps.
 Along the way, you will build a sophisticated app that
visualizes US Census data
counties.rds
 counties.rds is a dataset of demographic data for each
county in the United States, collected with
the UScensus2010 R package.
 Once you have it’s file :
1. Create a new folder named data in your census-
app directory.
2. Move counties.rds into the data folder.
The dataset in counties.rds contains
 the name of each county in the United States
 the total population of the county.
 the percent of residents in the county who are white,
black, hispanic, or asian
helpers.R
 helpers.R is an R script that can help you make
choropleth map is a map that uses color to display the
regional variation of a variable. e choropleth map.
 helpers.R will create percent_map, a function designed
to map the data in counties.rds.
 helpers.R uses the maps and mapproj packages in R.
 Save helpers.R inside your census-app directory.
The percent_map function in helpers.R takes five arguments:
Argument Input
var
a column vector from
the counties.rds dataset
color
any character string you see in the
output of colors()
legend.title
A character string to use as the title of
the plot’s legend
max
A parameter for controlling shade
range (defaults to 100)
min
A parameter for controlling shade
range (defaults to 0)
You can use percent_map at the command line to plot the counties data as a
choropleth map
Loading files and file paths
• Since you saved helpers.R in the same directory as server.R, you
can ask Shiny to load it with.
• Since you saved counties.rds in a sub-directory (named data) of the
directory that server.R is in, you can load it with.
• You can load the maps and mapproj packages in the normal way
with
Execution
 Shiny will execute all of these commands if you
place them in your server.R script.
 where you place them in server.R will determine
how many times they are run (or re-run), which
will in turn affect the performance of your app.
 Shiny will run some sections of server.R more
often than others.
 Shiny will run the whole script the first time you call runApp .This causes
Shiny to execute shinyServer.
 shinyServer then gives Shiny the unnamed function in its first argument.
Shiny saves the unnamed function until a new user arrives.
Each time a new user visits your app, Shiny runs the unnamed
function again, one time. The function helps Shiny build a distinct set of
reactive objects for each user.
As users change widgets, Shiny will re-run the R expressions assigned
to each reactive object. If your user is very active, these expressions
may be re-run many, many times a second.
we’ve learned so far:
 The server.R script is run once, when you launch your
app
 The unnamed function inside shinyServer is run
once each time a user visits your app
 The R expressions inside render* functions are run many
times. Shiny runs them once each time a user changes a
widget.
• library(maps)
• library(mapproj)
• counties <- readRDS("data/counties.rds")
• source("helpers.R")
• # server.R
• library(maps)
• library(mapproj)
• counties <- readRDS("data/counties.rds")
• source("helpers.R")
• shinyServer(
• function(input, output) {
• output$map <- renderPlot({
• data <- switch(input$var,
• "Percent White" = counties$white,
• "Percent Black" = counties$black,
• "Percent Hispanic" = counties$hispanic,
• "Percent Asian" = counties$asian)
• percent_map(var = data, color = "blue", legend.title = "map", max = 100, min = 0)
• })
• }
• )
LESSON 6
Use reactive expressions
You can make your apps faster by modularizing your code with reactive
expressions.
 A reactive expression takes input values, or values from other
reactive expressions, and returns a new value
 Reactive expressions save their results, and will only re-calculate if
their input has changed
 Create reactive expressions with reactive({ })
 Call reactive expressions with the name of the expression followed
by parentheses ()
 Only call reactive expressions from within other reactive expressions
or render* functions
• Shiny apps wow your users by running fast, instantly fast. But what if
your app needs to do a lot of slow computation?
• This lesson will show you how to streamline your Shiny apps with
reactive expressions.
• Reactive expressions let you control which parts of your app update
when, which prevents unnecessary work.
 To get started:
1. Create a new folder named stockVis in your working directory.
2. Download the following files and place them
inside stockVis: ui.R, server.R, and helpers.R.
3. Launch the app with runApp("stockVis")
StockVis relies heavily on two functions from
the quantmod package:
 It uses getSymbols to download financial data straight
into R from websites like Yahoo finance and the Federal
Reserve Bank of St. Louis.
 It uses chartSeries to display prices in an attractive
chart.
 StockVis also relies on an R script named helpers.R,
which contains a function that adjusts stock prices for
inflation.
Streamline computation
• Examine what will happen when you click “Plot y axis on the log
scale.” The value of input$log will change, which will cause the
entire expression in renderPlot to re-run:
Each time renderPlot re-runs
 it re-fetches the data from Yahoo finance with getSymbols, and
 it re-draws the chart with the correct axis.
This is not good, because you do not need to re-fetch the data to re-
draw the plot. In fact, Yahoo finance will cut you off if you re-fetch your
data too often (because you begin to look like a bot). But more
importantly, re-running getSymbols is unnecessary work, which can
slow down your app and consume server bandwidth.
Reactive expressions
You can limit what gets re-run during a reaction with reactive expr
 A reactive expression is an R expression that uses widget input and
returns a value. The reactive expression will update this value
whenever the original widget changes.
For example, here’s a reactive expression that uses the widgets of
stockVis to fetch data from Yahoo
• When you run the expression, it will run getSymbols and return the
results, a data frame of price data. You can use the expression to
access price data in renderPlot by calling dataInput().
 Reactive expressions are a bit smarter than regular R functions.
They cache their values and know when their values have become
outdated. What does this mean? The first time that you run a
reactive expression, the expression will save its result in your
computer’s memory. The next time you call the reactive expression,
it can return this saved result without doing any computation (which
will make your app fast
 The reactive expression will only return the saved result if it knows
that the result is up-to-date. If the reactive expression has learned
that the result is obsolete (because a widget has changed), the
expression will recalculate the result. It then returns the new result
and saves a new copy. The reactive expression will use this new
copy until it too becomes out of date. er).
Let’s summarize this behavior
• A reactive expression saves its result the first time you run it.
• The next time the reactive expression is called, it checks if the saved
value has become out of date (i.e., whether the widgets it depends
on have changed).
• If the value is out of date, the reactive object will recalculate it (and
then save the new result).
• If the value is up-to-date, the reactive expression will return the
saved value without doing any computation.
When you click “Plot y axis on the log scale”, input$log will
change and renderPlot will re-execute.
 renderPlot will call dataInput()
 dataInput will check that the dates and symb widgets
have not changed
 dataInput will return its saved data set of stock
prices without re-fetching data from Yahoo
 renderPlot will re-draw the chart with the correct axis.
LESSON 7
Share your apps
You will learn:
 Anyone can launch your app as long as they have a copy of R,
Shiny, and a copy of your app’s files.
 runUrl, runGitHub, and runGist make it simple to share and retrieve
Shiny files from web links.
 You can turn your app into a live web app at its own URL
with shinyapps.io.
 You can use the open source Shiny Server to build a Linux server
that hosts Shiny apps.
 If you need closer control, or want to manage large volumes of
traffic, you can purchase Shiny Server Pro from RStudio.
When it comes to sharing Shiny apps, you have two basic options:
 Share your Shiny app as two files: server.R and ui.R. This is the
simplest way to share an app, but it works only if your users have R
on their own computer (and know how to use it). Users can use
these scripts to launch the app from their own R session, just like
you’ve been launching the apps.
 Share your Shiny app as a web page. This is definitely the most
user friendly way to share a Shiny app. Your users can navigate to
your app through the internet with a web browser. They will find your
app fully rendered, up to date, and ready to go.
Share as two R files
Anyone with R can run your Shiny app.
 They will need a copy of your server.R and ui.R files, as well as any
supplementary materials used in your app (e.g., www folders
or helpers.R files).
 To send your files to another user, email the files (perhaps in a zip
file) or host the files online.
 Your user can place the files into an app directory in their working
directory. They can launch the app in R with the same commands
you used on your computer.
Shiny has three built in commands that make it easy to use files that
are hosted online: runUrl,runGitHub, and runGist.
runURL:
 Save your Shiny app’s directory as a zip file
 Host that zip file at its own link on a web page. Anyone with access
to the link can launch the app from inside R by running:
 runGitHub
 create a project repository on Github. Then store
your server.R andui.R files in the repository,
runGist
• Copy and paste your server.R and ui.R files to the Gist web page.
• Note the URL that Github gives the Gist.
• Once you’ve made a Gist, your users can launch the app
with runGist("<gist number>") where"<gist number>" is the number
that appears at the end of your Gist’s web address.
Share as a web page
 All of the previous methods share the same limitation. They require
your user to have R and Shiny installed on their computer.
 Shiny creates the perfect opportunity to share output with people
who do not have R
 If you’d prefer an easier experience or need support, RStudio offers
three ways to host your Shiny app as a web page:
1. Shinyapps.io.
2. Shiny Server, and
3. Shiny Server Pro
Shinyapps.io
• lets you upload your app straight from your R session to
a server hosted by Rstudio.
Shiny Server
• Shiny Server is a companion program to Shiny that
builds a web server designed to host Shiny apps.
Shiny Server Pro
• Shiny Server will get your app to the web and take care
of all of your Shiny publishing needs
Shiny in R

More Related Content

What's hot

2 database system concepts and architecture
2 database system concepts and architecture2 database system concepts and architecture
2 database system concepts and architectureKumar
 
Ionic & Angular
Ionic & AngularIonic & Angular
Ionic & Angular
Knoldus Inc.
 
Database design process
Database design processDatabase design process
Database design process
Tayyab Hameed
 
Visual basic databases
Visual basic databasesVisual basic databases
Visual basic databases
Speed Cyber Cafe
 
React + Redux for Web Developers
React + Redux for Web DevelopersReact + Redux for Web Developers
React + Redux for Web Developers
Jamal Sinclair O'Garro
 
Chapter1: NoSQL: It’s about making intelligent choices
Chapter1: NoSQL: It’s about making intelligent choicesChapter1: NoSQL: It’s about making intelligent choices
Chapter1: NoSQL: It’s about making intelligent choices
Maynooth University
 
React-JS.pptx
React-JS.pptxReact-JS.pptx
React-JS.pptx
AnmolPandita7
 
RichControl in Asp.net
RichControl in Asp.netRichControl in Asp.net
RichControl in Asp.netBhumivaghasiya
 
How the Web Works
How the Web WorksHow the Web Works
How the Web Works
Randy Connolly
 
Intro to React
Intro to ReactIntro to React
Intro to React
Justin Reock
 
React JS - A quick introduction tutorial
React JS - A quick introduction tutorialReact JS - A quick introduction tutorial
React JS - A quick introduction tutorial
Mohammed Fazuluddin
 
NEXT.JS
NEXT.JSNEXT.JS
Web application presentation
Web application presentationWeb application presentation
Web application presentation
Ehsan Ullah Kakar
 
Power BI Tutorial For Beginners | Power BI Tutorial | Power BI Demo | Power B...
Power BI Tutorial For Beginners | Power BI Tutorial | Power BI Demo | Power B...Power BI Tutorial For Beginners | Power BI Tutorial | Power BI Demo | Power B...
Power BI Tutorial For Beginners | Power BI Tutorial | Power BI Demo | Power B...
Edureka!
 
WEB DEVELOPMENT USING REACT JS
 WEB DEVELOPMENT USING REACT JS WEB DEVELOPMENT USING REACT JS
WEB DEVELOPMENT USING REACT JS
MuthuKumaran Singaravelu
 
React Native
React Native React Native
React Native
vishal kumar
 
Asp.Net Tutorials
Asp.Net TutorialsAsp.Net Tutorials
Asp.Net Tutorials
Ram Sagar Mourya
 
NOSQL- Presentation on NoSQL
NOSQL- Presentation on NoSQLNOSQL- Presentation on NoSQL
NOSQL- Presentation on NoSQL
Ramakant Soni
 
DISE - Database Concepts
DISE - Database ConceptsDISE - Database Concepts
DISE - Database Concepts
Rasan Samarasinghe
 

What's hot (20)

2 database system concepts and architecture
2 database system concepts and architecture2 database system concepts and architecture
2 database system concepts and architecture
 
Ionic & Angular
Ionic & AngularIonic & Angular
Ionic & Angular
 
Database design process
Database design processDatabase design process
Database design process
 
Express node js
Express node jsExpress node js
Express node js
 
Visual basic databases
Visual basic databasesVisual basic databases
Visual basic databases
 
React + Redux for Web Developers
React + Redux for Web DevelopersReact + Redux for Web Developers
React + Redux for Web Developers
 
Chapter1: NoSQL: It’s about making intelligent choices
Chapter1: NoSQL: It’s about making intelligent choicesChapter1: NoSQL: It’s about making intelligent choices
Chapter1: NoSQL: It’s about making intelligent choices
 
React-JS.pptx
React-JS.pptxReact-JS.pptx
React-JS.pptx
 
RichControl in Asp.net
RichControl in Asp.netRichControl in Asp.net
RichControl in Asp.net
 
How the Web Works
How the Web WorksHow the Web Works
How the Web Works
 
Intro to React
Intro to ReactIntro to React
Intro to React
 
React JS - A quick introduction tutorial
React JS - A quick introduction tutorialReact JS - A quick introduction tutorial
React JS - A quick introduction tutorial
 
NEXT.JS
NEXT.JSNEXT.JS
NEXT.JS
 
Web application presentation
Web application presentationWeb application presentation
Web application presentation
 
Power BI Tutorial For Beginners | Power BI Tutorial | Power BI Demo | Power B...
Power BI Tutorial For Beginners | Power BI Tutorial | Power BI Demo | Power B...Power BI Tutorial For Beginners | Power BI Tutorial | Power BI Demo | Power B...
Power BI Tutorial For Beginners | Power BI Tutorial | Power BI Demo | Power B...
 
WEB DEVELOPMENT USING REACT JS
 WEB DEVELOPMENT USING REACT JS WEB DEVELOPMENT USING REACT JS
WEB DEVELOPMENT USING REACT JS
 
React Native
React Native React Native
React Native
 
Asp.Net Tutorials
Asp.Net TutorialsAsp.Net Tutorials
Asp.Net Tutorials
 
NOSQL- Presentation on NoSQL
NOSQL- Presentation on NoSQLNOSQL- Presentation on NoSQL
NOSQL- Presentation on NoSQL
 
DISE - Database Concepts
DISE - Database ConceptsDISE - Database Concepts
DISE - Database Concepts
 

Similar to Shiny in R

Crash Course on R Shiny Package
Crash Course on R Shiny Package Crash Course on R Shiny Package
Crash Course on R Shiny Package
Rohit Dubey
 
shiny.pdf
shiny.pdfshiny.pdf
shiny.pdf
Ashwini Kalantri
 
Intro To C++ - Class 14 - Midterm Review
Intro To C++ - Class 14 - Midterm ReviewIntro To C++ - Class 14 - Midterm Review
Intro To C++ - Class 14 - Midterm Review
Blue Elephant Consulting
 
.NET Portfolio
.NET Portfolio.NET Portfolio
.NET Portfoliomwillmer
 
Android ui with xml
Android ui with xmlAndroid ui with xml
Android ui with xml
Egerton University
 
Build UI of the Future with React 360
Build UI of the Future with React 360Build UI of the Future with React 360
Build UI of the Future with React 360
RapidValue
 
Angular kickstart slideshare
Angular kickstart   slideshareAngular kickstart   slideshare
Angular kickstart slideshare
SaleemMalik52
 
OOP Programs
OOP ProgramsOOP Programs
OOP Programs
hirrahAzhar
 
Diving deep in compose.pdf
Diving deep in compose.pdfDiving deep in compose.pdf
Diving deep in compose.pdf
AnkurAgarwal151093
 
What is Android?
What is Android?What is Android?
What is Android?
ndalban
 
Introduction to interactive data visualisation using R Shiny
Introduction to interactive data visualisation using R ShinyIntroduction to interactive data visualisation using R Shiny
Introduction to interactive data visualisation using R Shiny
anamarisaguedes
 
Guide to Using React Router V6 in React Apps.pdf
Guide to Using React Router V6 in React Apps.pdfGuide to Using React Router V6 in React Apps.pdf
Guide to Using React Router V6 in React Apps.pdf
AdarshMathuri
 
Ap quiz app
Ap quiz appAp quiz app
Ap quiz app
angelicaurio
 
-Kotlin_Camp_Unit2.pptx
-Kotlin_Camp_Unit2.pptx-Kotlin_Camp_Unit2.pptx
-Kotlin_Camp_Unit2.pptx
RishiGandhi19
 
-Kotlin Camp Unit2.pptx
-Kotlin Camp Unit2.pptx-Kotlin Camp Unit2.pptx
-Kotlin Camp Unit2.pptx
IshwariKulkarni6
 
Redux and context api with react native app introduction, use cases, implemen...
Redux and context api with react native app introduction, use cases, implemen...Redux and context api with react native app introduction, use cases, implemen...
Redux and context api with react native app introduction, use cases, implemen...
Katy Slemon
 
Progressive Web Application by Citytech
Progressive Web Application by CitytechProgressive Web Application by Citytech
Progressive Web Application by Citytech
Ritwik Das
 
Markdown tutorial how to add markdown to rails app using redcarpet and codera...
Markdown tutorial how to add markdown to rails app using redcarpet and codera...Markdown tutorial how to add markdown to rails app using redcarpet and codera...
Markdown tutorial how to add markdown to rails app using redcarpet and codera...
Katy Slemon
 
ReactJS.pptx
ReactJS.pptxReactJS.pptx
ReactJS.pptx
SamyakShetty2
 

Similar to Shiny in R (20)

Crash Course on R Shiny Package
Crash Course on R Shiny Package Crash Course on R Shiny Package
Crash Course on R Shiny Package
 
shiny.pdf
shiny.pdfshiny.pdf
shiny.pdf
 
Intro To C++ - Class 14 - Midterm Review
Intro To C++ - Class 14 - Midterm ReviewIntro To C++ - Class 14 - Midterm Review
Intro To C++ - Class 14 - Midterm Review
 
.NET Portfolio
.NET Portfolio.NET Portfolio
.NET Portfolio
 
Android ui with xml
Android ui with xmlAndroid ui with xml
Android ui with xml
 
Build UI of the Future with React 360
Build UI of the Future with React 360Build UI of the Future with React 360
Build UI of the Future with React 360
 
Angular kickstart slideshare
Angular kickstart   slideshareAngular kickstart   slideshare
Angular kickstart slideshare
 
OOP Programs
OOP ProgramsOOP Programs
OOP Programs
 
Diving deep in compose.pdf
Diving deep in compose.pdfDiving deep in compose.pdf
Diving deep in compose.pdf
 
What is Android?
What is Android?What is Android?
What is Android?
 
Introduction to interactive data visualisation using R Shiny
Introduction to interactive data visualisation using R ShinyIntroduction to interactive data visualisation using R Shiny
Introduction to interactive data visualisation using R Shiny
 
Guide to Using React Router V6 in React Apps.pdf
Guide to Using React Router V6 in React Apps.pdfGuide to Using React Router V6 in React Apps.pdf
Guide to Using React Router V6 in React Apps.pdf
 
As pnet
As pnetAs pnet
As pnet
 
Ap quiz app
Ap quiz appAp quiz app
Ap quiz app
 
-Kotlin_Camp_Unit2.pptx
-Kotlin_Camp_Unit2.pptx-Kotlin_Camp_Unit2.pptx
-Kotlin_Camp_Unit2.pptx
 
-Kotlin Camp Unit2.pptx
-Kotlin Camp Unit2.pptx-Kotlin Camp Unit2.pptx
-Kotlin Camp Unit2.pptx
 
Redux and context api with react native app introduction, use cases, implemen...
Redux and context api with react native app introduction, use cases, implemen...Redux and context api with react native app introduction, use cases, implemen...
Redux and context api with react native app introduction, use cases, implemen...
 
Progressive Web Application by Citytech
Progressive Web Application by CitytechProgressive Web Application by Citytech
Progressive Web Application by Citytech
 
Markdown tutorial how to add markdown to rails app using redcarpet and codera...
Markdown tutorial how to add markdown to rails app using redcarpet and codera...Markdown tutorial how to add markdown to rails app using redcarpet and codera...
Markdown tutorial how to add markdown to rails app using redcarpet and codera...
 
ReactJS.pptx
ReactJS.pptxReactJS.pptx
ReactJS.pptx
 

More from heba_ahmad

heba alsayed ahmad_Recomm_#
heba alsayed ahmad_Recomm_#heba alsayed ahmad_Recomm_#
heba alsayed ahmad_Recomm_#heba_ahmad
 
heba alsayed ahmad_Recomm_#2
heba alsayed ahmad_Recomm_#2heba alsayed ahmad_Recomm_#2
heba alsayed ahmad_Recomm_#2heba_ahmad
 
bassel alkhatib recommendation
bassel alkhatib recommendation bassel alkhatib recommendation
bassel alkhatib recommendation heba_ahmad
 
recommendation dr jose
recommendation dr joserecommendation dr jose
recommendation dr joseheba_ahmad
 
recommendation dr.miguel
recommendation dr.miguelrecommendation dr.miguel
recommendation dr.miguelheba_ahmad
 
metaheuristic tabu pso
metaheuristic tabu psometaheuristic tabu pso
metaheuristic tabu pso
heba_ahmad
 
Line uo,please
Line uo,pleaseLine uo,please
Line uo,please
heba_ahmad
 
Data mining
Data miningData mining
Data mining
heba_ahmad
 
Introduction to data science intro,ch(1,2,3)
Introduction to data science intro,ch(1,2,3)Introduction to data science intro,ch(1,2,3)
Introduction to data science intro,ch(1,2,3)
heba_ahmad
 
&Final presentation
 &Final presentation &Final presentation
&Final presentation
heba_ahmad
 
Chapter 18,19
Chapter 18,19Chapter 18,19
Chapter 18,19
heba_ahmad
 
Ggplot2 ch2
Ggplot2 ch2Ggplot2 ch2
Ggplot2 ch2
heba_ahmad
 
Final presentation
Final presentationFinal presentation
Final presentationheba_ahmad
 

More from heba_ahmad (13)

heba alsayed ahmad_Recomm_#
heba alsayed ahmad_Recomm_#heba alsayed ahmad_Recomm_#
heba alsayed ahmad_Recomm_#
 
heba alsayed ahmad_Recomm_#2
heba alsayed ahmad_Recomm_#2heba alsayed ahmad_Recomm_#2
heba alsayed ahmad_Recomm_#2
 
bassel alkhatib recommendation
bassel alkhatib recommendation bassel alkhatib recommendation
bassel alkhatib recommendation
 
recommendation dr jose
recommendation dr joserecommendation dr jose
recommendation dr jose
 
recommendation dr.miguel
recommendation dr.miguelrecommendation dr.miguel
recommendation dr.miguel
 
metaheuristic tabu pso
metaheuristic tabu psometaheuristic tabu pso
metaheuristic tabu pso
 
Line uo,please
Line uo,pleaseLine uo,please
Line uo,please
 
Data mining
Data miningData mining
Data mining
 
Introduction to data science intro,ch(1,2,3)
Introduction to data science intro,ch(1,2,3)Introduction to data science intro,ch(1,2,3)
Introduction to data science intro,ch(1,2,3)
 
&Final presentation
 &Final presentation &Final presentation
&Final presentation
 
Chapter 18,19
Chapter 18,19Chapter 18,19
Chapter 18,19
 
Ggplot2 ch2
Ggplot2 ch2Ggplot2 ch2
Ggplot2 ch2
 
Final presentation
Final presentationFinal presentation
Final presentation
 

Recently uploaded

The Roman Empire A Historical Colossus.pdf
The Roman Empire A Historical Colossus.pdfThe Roman Empire A Historical Colossus.pdf
The Roman Empire A Historical Colossus.pdf
kaushalkr1407
 
Fish and Chips - have they had their chips
Fish and Chips - have they had their chipsFish and Chips - have they had their chips
Fish and Chips - have they had their chips
GeoBlogs
 
Model Attribute Check Company Auto Property
Model Attribute  Check Company Auto PropertyModel Attribute  Check Company Auto Property
Model Attribute Check Company Auto Property
Celine George
 
Unit 8 - Information and Communication Technology (Paper I).pdf
Unit 8 - Information and Communication Technology (Paper I).pdfUnit 8 - Information and Communication Technology (Paper I).pdf
Unit 8 - Information and Communication Technology (Paper I).pdf
Thiyagu K
 
The French Revolution Class 9 Study Material pdf free download
The French Revolution Class 9 Study Material pdf free downloadThe French Revolution Class 9 Study Material pdf free download
The French Revolution Class 9 Study Material pdf free download
Vivekanand Anglo Vedic Academy
 
PART A. Introduction to Costumer Service
PART A. Introduction to Costumer ServicePART A. Introduction to Costumer Service
PART A. Introduction to Costumer Service
PedroFerreira53928
 
aaaaaaaaaaaaaaaaaaaaaaaaaaaaaaaaaaaaaaaaa
aaaaaaaaaaaaaaaaaaaaaaaaaaaaaaaaaaaaaaaaaaaaaaaaaaaaaaaaaaaaaaaaaaaaaaaaaaaaaaaaaa
aaaaaaaaaaaaaaaaaaaaaaaaaaaaaaaaaaaaaaaaa
siemaillard
 
The approach at University of Liverpool.pptx
The approach at University of Liverpool.pptxThe approach at University of Liverpool.pptx
The approach at University of Liverpool.pptx
Jisc
 
The Art Pastor's Guide to Sabbath | Steve Thomason
The Art Pastor's Guide to Sabbath | Steve ThomasonThe Art Pastor's Guide to Sabbath | Steve Thomason
The Art Pastor's Guide to Sabbath | Steve Thomason
Steve Thomason
 
Synthetic Fiber Construction in lab .pptx
Synthetic Fiber Construction in lab .pptxSynthetic Fiber Construction in lab .pptx
Synthetic Fiber Construction in lab .pptx
Pavel ( NSTU)
 
How libraries can support authors with open access requirements for UKRI fund...
How libraries can support authors with open access requirements for UKRI fund...How libraries can support authors with open access requirements for UKRI fund...
How libraries can support authors with open access requirements for UKRI fund...
Jisc
 
The Challenger.pdf DNHS Official Publication
The Challenger.pdf DNHS Official PublicationThe Challenger.pdf DNHS Official Publication
The Challenger.pdf DNHS Official Publication
Delapenabediema
 
Language Across the Curriculm LAC B.Ed.
Language Across the  Curriculm LAC B.Ed.Language Across the  Curriculm LAC B.Ed.
Language Across the Curriculm LAC B.Ed.
Atul Kumar Singh
 
Operation Blue Star - Saka Neela Tara
Operation Blue Star   -  Saka Neela TaraOperation Blue Star   -  Saka Neela Tara
Operation Blue Star - Saka Neela Tara
Balvir Singh
 
Additional Benefits for Employee Website.pdf
Additional Benefits for Employee Website.pdfAdditional Benefits for Employee Website.pdf
Additional Benefits for Employee Website.pdf
joachimlavalley1
 
Thesis Statement for students diagnonsed withADHD.ppt
Thesis Statement for students diagnonsed withADHD.pptThesis Statement for students diagnonsed withADHD.ppt
Thesis Statement for students diagnonsed withADHD.ppt
EverAndrsGuerraGuerr
 
Phrasal Verbs.XXXXXXXXXXXXXXXXXXXXXXXXXX
Phrasal Verbs.XXXXXXXXXXXXXXXXXXXXXXXXXXPhrasal Verbs.XXXXXXXXXXXXXXXXXXXXXXXXXX
Phrasal Verbs.XXXXXXXXXXXXXXXXXXXXXXXXXX
MIRIAMSALINAS13
 
special B.ed 2nd year old paper_20240531.pdf
special B.ed 2nd year old paper_20240531.pdfspecial B.ed 2nd year old paper_20240531.pdf
special B.ed 2nd year old paper_20240531.pdf
Special education needs
 
MARUTI SUZUKI- A Successful Joint Venture in India.pptx
MARUTI SUZUKI- A Successful Joint Venture in India.pptxMARUTI SUZUKI- A Successful Joint Venture in India.pptx
MARUTI SUZUKI- A Successful Joint Venture in India.pptx
bennyroshan06
 
Polish students' mobility in the Czech Republic
Polish students' mobility in the Czech RepublicPolish students' mobility in the Czech Republic
Polish students' mobility in the Czech Republic
Anna Sz.
 

Recently uploaded (20)

The Roman Empire A Historical Colossus.pdf
The Roman Empire A Historical Colossus.pdfThe Roman Empire A Historical Colossus.pdf
The Roman Empire A Historical Colossus.pdf
 
Fish and Chips - have they had their chips
Fish and Chips - have they had their chipsFish and Chips - have they had their chips
Fish and Chips - have they had their chips
 
Model Attribute Check Company Auto Property
Model Attribute  Check Company Auto PropertyModel Attribute  Check Company Auto Property
Model Attribute Check Company Auto Property
 
Unit 8 - Information and Communication Technology (Paper I).pdf
Unit 8 - Information and Communication Technology (Paper I).pdfUnit 8 - Information and Communication Technology (Paper I).pdf
Unit 8 - Information and Communication Technology (Paper I).pdf
 
The French Revolution Class 9 Study Material pdf free download
The French Revolution Class 9 Study Material pdf free downloadThe French Revolution Class 9 Study Material pdf free download
The French Revolution Class 9 Study Material pdf free download
 
PART A. Introduction to Costumer Service
PART A. Introduction to Costumer ServicePART A. Introduction to Costumer Service
PART A. Introduction to Costumer Service
 
aaaaaaaaaaaaaaaaaaaaaaaaaaaaaaaaaaaaaaaaa
aaaaaaaaaaaaaaaaaaaaaaaaaaaaaaaaaaaaaaaaaaaaaaaaaaaaaaaaaaaaaaaaaaaaaaaaaaaaaaaaaa
aaaaaaaaaaaaaaaaaaaaaaaaaaaaaaaaaaaaaaaaa
 
The approach at University of Liverpool.pptx
The approach at University of Liverpool.pptxThe approach at University of Liverpool.pptx
The approach at University of Liverpool.pptx
 
The Art Pastor's Guide to Sabbath | Steve Thomason
The Art Pastor's Guide to Sabbath | Steve ThomasonThe Art Pastor's Guide to Sabbath | Steve Thomason
The Art Pastor's Guide to Sabbath | Steve Thomason
 
Synthetic Fiber Construction in lab .pptx
Synthetic Fiber Construction in lab .pptxSynthetic Fiber Construction in lab .pptx
Synthetic Fiber Construction in lab .pptx
 
How libraries can support authors with open access requirements for UKRI fund...
How libraries can support authors with open access requirements for UKRI fund...How libraries can support authors with open access requirements for UKRI fund...
How libraries can support authors with open access requirements for UKRI fund...
 
The Challenger.pdf DNHS Official Publication
The Challenger.pdf DNHS Official PublicationThe Challenger.pdf DNHS Official Publication
The Challenger.pdf DNHS Official Publication
 
Language Across the Curriculm LAC B.Ed.
Language Across the  Curriculm LAC B.Ed.Language Across the  Curriculm LAC B.Ed.
Language Across the Curriculm LAC B.Ed.
 
Operation Blue Star - Saka Neela Tara
Operation Blue Star   -  Saka Neela TaraOperation Blue Star   -  Saka Neela Tara
Operation Blue Star - Saka Neela Tara
 
Additional Benefits for Employee Website.pdf
Additional Benefits for Employee Website.pdfAdditional Benefits for Employee Website.pdf
Additional Benefits for Employee Website.pdf
 
Thesis Statement for students diagnonsed withADHD.ppt
Thesis Statement for students diagnonsed withADHD.pptThesis Statement for students diagnonsed withADHD.ppt
Thesis Statement for students diagnonsed withADHD.ppt
 
Phrasal Verbs.XXXXXXXXXXXXXXXXXXXXXXXXXX
Phrasal Verbs.XXXXXXXXXXXXXXXXXXXXXXXXXXPhrasal Verbs.XXXXXXXXXXXXXXXXXXXXXXXXXX
Phrasal Verbs.XXXXXXXXXXXXXXXXXXXXXXXXXX
 
special B.ed 2nd year old paper_20240531.pdf
special B.ed 2nd year old paper_20240531.pdfspecial B.ed 2nd year old paper_20240531.pdf
special B.ed 2nd year old paper_20240531.pdf
 
MARUTI SUZUKI- A Successful Joint Venture in India.pptx
MARUTI SUZUKI- A Successful Joint Venture in India.pptxMARUTI SUZUKI- A Successful Joint Venture in India.pptx
MARUTI SUZUKI- A Successful Joint Venture in India.pptx
 
Polish students' mobility in the Czech Republic
Polish students' mobility in the Czech RepublicPolish students' mobility in the Czech Republic
Polish students' mobility in the Czech Republic
 

Shiny in R

  • 2. Shiny is an R package that makes it easy to build interactive web applications (apps) straight from R. runExample("01_hello") # a histogram Lesson 1
  • 3.  The Hello Shiny example plots a histogram of R’s faithful dataset with a configurable number of bins.  Users can change the number of bins with a slider bar, and the app will immediately respond to their input.
  • 4. Structure of a Shiny App Shiny apps have two components: a user-interface (ui) script: controls the layout and appearance of your app. It is defined in a source script named ui.R. The server.R script :contains the instructions that your computer needs to build your app.
  • 5.
  • 6.
  • 7.  At one level, the Hello Shiny server.R script is very simple. The script does some calculations and then plots a histogram with the requested number of bins.  most of the script is wrapped in a call to renderPlot:  1) It is "reactive" and therefore should re-execute automatically when inputs change  2) Its output type is a plot
  • 8.
  • 9. Your Turn  Create a new directory named App-1 in your working directory. Then copy and paste the ui.R and server.R scripts above into your directory (the scripts from Hello Shiny).  Launch your app by running runApp("App-1"). Then click escape and make some changes to your app: 1. Change the title from “Hello Shiny!” to “Hello World!”. 2. Set the minimum value of the slider bar to 5. 3. Change the histogram color from "darkgray" to "skyblue".
  • 10.
  • 11. Lesson 2 With will learn: 1. create a user-interface with fluidPage, titlePanel and sidebarLayout 2. create an HTML element with one of Shiny’s tag functions 3. set HTML tag attributes in the arguments of each tag function 4. add an element to your web page by passing it to titlePanel, sidebarPanel or mainPanel 5. add multiple elements to each panel by separating them with a comma 6. add images by placing your image in a folder labeled www within your Shiny app directory and then calling the img function
  • 12. Build a user-interface • will show you how to build a user-interface for your app. You will learn how to lay out the user-interface and then add text, images and other HTML elements to your Shiny app.
  • 13. • Shiny ui.R scripts use the function fluidPage to create a display that automatically adjusts to the dimensions of your user’s browser window.  ui.R script creates a user-interface that has a title panel and then a sidebar layout, which includes a sidebar panel and a main panel.
  • 14.
  • 15.  Title Panel and sidebar Layout are the two most popular elements to add to fluid Page.  Sidebar Layout always takes two arguments: 1. sidebarPanel function output 2. mainPanel function output
  • 16. • The sidebar panel will appear on the left side of your app by default. You can move it to the right side by giving sidebar Layout the optional argument position = "right".
  • 17.
  • 18.  titlePanel and sidebarLayout create a basic layout for your Shiny app, but you can also create more advanced layouts. You can use navbarPage to give your app a multi-page user-interface that includes a navigation bar. Or you can use fluidRow and column to build your layout up from a grid system.  You can add content to your Shiny app by placing it inside a *Panel function. For example, The words “sidebar panel” appear in the sidebar panel, because we added the string to the sidebarPanel function, e.g sidebarPanel("sidebar panel"). The same is true for the text in the title panel and the main panel.
  • 19. To add more advanced content, use one of Shiny’s HTML tag functions. These functions parallel common HTML5 tags. HTML Content
  • 20. Headers To create a header element: 1. select a header function (e.g., h1 or h5) 2. give it the text you want to see in the header
  • 21.
  • 22. the effect with align = "center", as in h6("Episode IV", align = "center").
  • 23.
  • 25.
  • 26. Images • To insert an image, give the img function the name of your image file as the src argument (e.g.,img(src = "my_image.png")).
  • 27.
  • 28. LESSON 3 Add control widgets This lesson will show you how to add control widgets to your Shiny apps.  widget :A web element that your users can interact with.  Widgets provide a way for your users to send messages to the Shiny app  Shiny widgets collect a value from your user.  When a user changes the widget, the value will change as well.
  • 30. The standard Shiny widgets are: function widget actionButton Action Button checkboxGroupInput A group of check boxes checkboxInput A single check box dateInput A calendar to aid date selection dateRangeInput A pair of calendars for selecting a date range fileInput A file upload control wizard helpText Help text that can be added to an input form numericInput A field to enter numbers radioButtons A set of radio buttons selectInput A box with choices to select from sliderInput A slider bar submitButton A submit button textInput A field to enter text
  • 31. Adding widgets Each widget function requires several arguments. The first two arguments for each widget are 1. A Name for the widget. The user will not see this name, but you can use it to access the widget’s value. The name should be a character string. 2. A label. This label will appear with the widget in your app. It should be a character string, but it can be an empty string "".
  • 32.
  • 33.
  • 34. LESSON 4 Display reactive output You will learn :  created your first reactive Shiny app.  use an *Output function in the ui.R script to place reactive objects in your Shiny app.  use a render* function in the server.R script to tell Shiny how to build your objects  surround R expressions by braces, {}, in each render* function  save your render* expressions in the output list, with one entry for each reactive object in your app.  create reactivity by including an input value in a render* expression
  • 35. Steps:  Create a folder in your working directory named census-app. This is where we’ll save the ui.R and server.R.  You can create reactive output with a two step process. 1) Add an R object to your user-interface with ui.R. 2) Tell Shiny how to build the object in server.R. The object will be reactive if the code that builds it calls a widget value.
  • 36. Step 1: Add an R object to the UI • Shiny provides a family of functions that turn R objects into output for your user-interface. Each function creates a specific type of output.
  • 37. the ui.R file below uses textOutput to add a reactive line of text to the main panel of the Notice that textOutput takes an argument, the character string “text1”. Each of the *Output functions require a single argument: a character string that Shiny will use as the name of your reactive element. Your users will not see this name, but you will use it later.
  • 38. Step 2: Provide R code to build the object.  The code should go in the unnamed function that appears inside shinyServer in your server.R script.  it builds a list-like object named output that contains all of the code needed to update the R objects in your app.  Each R object needs to have its own entry in the list.  The element name should match the name of the reactive element that you created in ui.R.
  • 39.  You do not need to arrange for the unnamed function to return output in its last line of code. R will automatically update output through reference class semantics.  Each entry to output should contain the output of one of Shiny’s render* functions.  Each render* function takes a single argument: an R expression surrounded by braces, {}. The expression can be one simple line of text, or it can involve many lines of code, as if it were a complicated function call.  Think of this R expression as a set of instructions that you give Shiny to store for later. Shiny will run the instructions when you first launch your app, and then Shiny will re-run the instructions every time it needs to update your object.  For this to work, your expression should return the object you have in mind (a piece of text, a plot, a data frame, etc). You will get an error if the expression does not return an object, or if it returns the wrong type of object.
  • 40.
  • 41. When you run the server.R script, the Shiny app will display “You have selected this” in the main panel. However, the text will not be reactive. It will not change even if you manipulate the widgets of your app.
  • 42. Use widget values • You can make the text reactive by asking Shiny to call a widget value when it builds the text. • Shiny will automatically make an object reactive if the object uses an input value • When a user changes a widget, Shiny will rebuild all of the outputs that depend on the widget, using the new value of the widget as it .goes
  • 43.
  • 44. LESSON 5 Use R scripts and data This lesson will show:  how to load data, R Scripts, and packages to use in your Shiny apps.  Along the way, you will build a sophisticated app that visualizes US Census data
  • 45. counties.rds  counties.rds is a dataset of demographic data for each county in the United States, collected with the UScensus2010 R package.  Once you have it’s file : 1. Create a new folder named data in your census- app directory. 2. Move counties.rds into the data folder.
  • 46. The dataset in counties.rds contains  the name of each county in the United States  the total population of the county.  the percent of residents in the county who are white, black, hispanic, or asian
  • 47. helpers.R  helpers.R is an R script that can help you make choropleth map is a map that uses color to display the regional variation of a variable. e choropleth map.  helpers.R will create percent_map, a function designed to map the data in counties.rds.  helpers.R uses the maps and mapproj packages in R.  Save helpers.R inside your census-app directory.
  • 48. The percent_map function in helpers.R takes five arguments: Argument Input var a column vector from the counties.rds dataset color any character string you see in the output of colors() legend.title A character string to use as the title of the plot’s legend max A parameter for controlling shade range (defaults to 100) min A parameter for controlling shade range (defaults to 0) You can use percent_map at the command line to plot the counties data as a choropleth map
  • 49.
  • 50. Loading files and file paths • Since you saved helpers.R in the same directory as server.R, you can ask Shiny to load it with. • Since you saved counties.rds in a sub-directory (named data) of the directory that server.R is in, you can load it with. • You can load the maps and mapproj packages in the normal way with
  • 51. Execution  Shiny will execute all of these commands if you place them in your server.R script.  where you place them in server.R will determine how many times they are run (or re-run), which will in turn affect the performance of your app.  Shiny will run some sections of server.R more often than others.
  • 52.  Shiny will run the whole script the first time you call runApp .This causes Shiny to execute shinyServer.  shinyServer then gives Shiny the unnamed function in its first argument.
  • 53. Shiny saves the unnamed function until a new user arrives. Each time a new user visits your app, Shiny runs the unnamed function again, one time. The function helps Shiny build a distinct set of reactive objects for each user.
  • 54. As users change widgets, Shiny will re-run the R expressions assigned to each reactive object. If your user is very active, these expressions may be re-run many, many times a second.
  • 55. we’ve learned so far:  The server.R script is run once, when you launch your app  The unnamed function inside shinyServer is run once each time a user visits your app  The R expressions inside render* functions are run many times. Shiny runs them once each time a user changes a widget.
  • 56.
  • 57. • library(maps) • library(mapproj) • counties <- readRDS("data/counties.rds") • source("helpers.R") • # server.R • library(maps) • library(mapproj) • counties <- readRDS("data/counties.rds") • source("helpers.R") • shinyServer( • function(input, output) { • output$map <- renderPlot({ • data <- switch(input$var, • "Percent White" = counties$white, • "Percent Black" = counties$black, • "Percent Hispanic" = counties$hispanic, • "Percent Asian" = counties$asian) • percent_map(var = data, color = "blue", legend.title = "map", max = 100, min = 0) • }) • } • )
  • 58.
  • 59. LESSON 6 Use reactive expressions You can make your apps faster by modularizing your code with reactive expressions.  A reactive expression takes input values, or values from other reactive expressions, and returns a new value  Reactive expressions save their results, and will only re-calculate if their input has changed  Create reactive expressions with reactive({ })  Call reactive expressions with the name of the expression followed by parentheses ()  Only call reactive expressions from within other reactive expressions or render* functions
  • 60. • Shiny apps wow your users by running fast, instantly fast. But what if your app needs to do a lot of slow computation? • This lesson will show you how to streamline your Shiny apps with reactive expressions. • Reactive expressions let you control which parts of your app update when, which prevents unnecessary work.  To get started: 1. Create a new folder named stockVis in your working directory. 2. Download the following files and place them inside stockVis: ui.R, server.R, and helpers.R. 3. Launch the app with runApp("stockVis")
  • 61.
  • 62. StockVis relies heavily on two functions from the quantmod package:  It uses getSymbols to download financial data straight into R from websites like Yahoo finance and the Federal Reserve Bank of St. Louis.  It uses chartSeries to display prices in an attractive chart.  StockVis also relies on an R script named helpers.R, which contains a function that adjusts stock prices for inflation.
  • 63. Streamline computation • Examine what will happen when you click “Plot y axis on the log scale.” The value of input$log will change, which will cause the entire expression in renderPlot to re-run:
  • 64. Each time renderPlot re-runs  it re-fetches the data from Yahoo finance with getSymbols, and  it re-draws the chart with the correct axis. This is not good, because you do not need to re-fetch the data to re- draw the plot. In fact, Yahoo finance will cut you off if you re-fetch your data too often (because you begin to look like a bot). But more importantly, re-running getSymbols is unnecessary work, which can slow down your app and consume server bandwidth.
  • 65. Reactive expressions You can limit what gets re-run during a reaction with reactive expr  A reactive expression is an R expression that uses widget input and returns a value. The reactive expression will update this value whenever the original widget changes. For example, here’s a reactive expression that uses the widgets of stockVis to fetch data from Yahoo
  • 66. • When you run the expression, it will run getSymbols and return the results, a data frame of price data. You can use the expression to access price data in renderPlot by calling dataInput().
  • 67.  Reactive expressions are a bit smarter than regular R functions. They cache their values and know when their values have become outdated. What does this mean? The first time that you run a reactive expression, the expression will save its result in your computer’s memory. The next time you call the reactive expression, it can return this saved result without doing any computation (which will make your app fast  The reactive expression will only return the saved result if it knows that the result is up-to-date. If the reactive expression has learned that the result is obsolete (because a widget has changed), the expression will recalculate the result. It then returns the new result and saves a new copy. The reactive expression will use this new copy until it too becomes out of date. er).
  • 68. Let’s summarize this behavior • A reactive expression saves its result the first time you run it. • The next time the reactive expression is called, it checks if the saved value has become out of date (i.e., whether the widgets it depends on have changed). • If the value is out of date, the reactive object will recalculate it (and then save the new result). • If the value is up-to-date, the reactive expression will return the saved value without doing any computation.
  • 69.
  • 70. When you click “Plot y axis on the log scale”, input$log will change and renderPlot will re-execute.  renderPlot will call dataInput()  dataInput will check that the dates and symb widgets have not changed  dataInput will return its saved data set of stock prices without re-fetching data from Yahoo  renderPlot will re-draw the chart with the correct axis.
  • 71. LESSON 7 Share your apps You will learn:  Anyone can launch your app as long as they have a copy of R, Shiny, and a copy of your app’s files.  runUrl, runGitHub, and runGist make it simple to share and retrieve Shiny files from web links.  You can turn your app into a live web app at its own URL with shinyapps.io.  You can use the open source Shiny Server to build a Linux server that hosts Shiny apps.  If you need closer control, or want to manage large volumes of traffic, you can purchase Shiny Server Pro from RStudio.
  • 72. When it comes to sharing Shiny apps, you have two basic options:  Share your Shiny app as two files: server.R and ui.R. This is the simplest way to share an app, but it works only if your users have R on their own computer (and know how to use it). Users can use these scripts to launch the app from their own R session, just like you’ve been launching the apps.  Share your Shiny app as a web page. This is definitely the most user friendly way to share a Shiny app. Your users can navigate to your app through the internet with a web browser. They will find your app fully rendered, up to date, and ready to go.
  • 73. Share as two R files Anyone with R can run your Shiny app.  They will need a copy of your server.R and ui.R files, as well as any supplementary materials used in your app (e.g., www folders or helpers.R files).  To send your files to another user, email the files (perhaps in a zip file) or host the files online.  Your user can place the files into an app directory in their working directory. They can launch the app in R with the same commands you used on your computer.
  • 74. Shiny has three built in commands that make it easy to use files that are hosted online: runUrl,runGitHub, and runGist. runURL:  Save your Shiny app’s directory as a zip file  Host that zip file at its own link on a web page. Anyone with access to the link can launch the app from inside R by running:  runGitHub  create a project repository on Github. Then store your server.R andui.R files in the repository,
  • 75. runGist • Copy and paste your server.R and ui.R files to the Gist web page. • Note the URL that Github gives the Gist. • Once you’ve made a Gist, your users can launch the app with runGist("<gist number>") where"<gist number>" is the number that appears at the end of your Gist’s web address.
  • 76. Share as a web page  All of the previous methods share the same limitation. They require your user to have R and Shiny installed on their computer.  Shiny creates the perfect opportunity to share output with people who do not have R  If you’d prefer an easier experience or need support, RStudio offers three ways to host your Shiny app as a web page: 1. Shinyapps.io. 2. Shiny Server, and 3. Shiny Server Pro
  • 77. Shinyapps.io • lets you upload your app straight from your R session to a server hosted by Rstudio. Shiny Server • Shiny Server is a companion program to Shiny that builds a web server designed to host Shiny apps. Shiny Server Pro • Shiny Server will get your app to the web and take care of all of your Shiny publishing needs