Interactive visualization and exploration of network data with Gephi
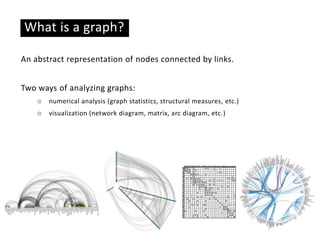
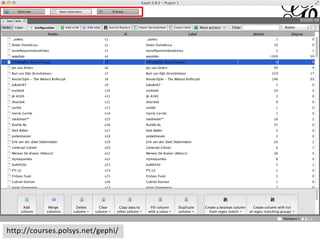
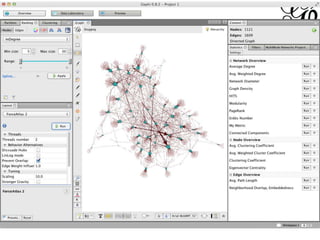
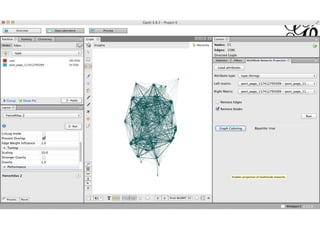
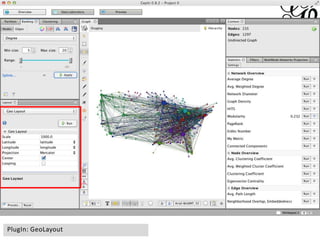
This document provides an overview of network analysis and visualization using the tool Gephi. It discusses key concepts in network and graph theory, including different types of network data and file formats. Basic network measures are explained, like degree, centrality, and network statistics. Interactive visualization techniques in Gephi are covered, such as layout algorithms, projecting node/edge attributes onto the diagram, and deriving new measures. Examples of network analyses and visualizations using Gephi are also presented.
Introduction to interactive visualization and exploration of network data using Gephi, presented by Bernhard Rieder from Universiteit van Amsterdam.
Discusses the necessity of mathematics in data analysis, contrasting confirmatory and exploratory data analysis.
Explains two mathematical frameworks: Statistics for observed objects and Graph Theory for observed relations, highlighting their representation techniques.
Introduction to Graph Theory with a historical context, including Euler's 'Seven Bridges' model in 1735.
Describes the evolution of graph theory in the 20th century, connecting diverse mathematical branches and its applications.
Explains the origin of graph theory through sociometry and social exchange theory, noting Moreno's 1934 contributions.
Explorations of adjacency matrices and their application in graph theory, referencing Forsythe, Katz, and Harary.
Identifies reasons for engaging in network analysis and visualization, highlighting new media, technologies, and societal trends.
Brief reference to Adamic and Glance's research on blogging networks to exemplify conceptual analysis in networks.
Defines conceptual models and analytical language in graph theory along with visualization methods.
Discusses how digraph theory formalizes empirical systems, reinforcing the importance of epistemological commitment.
Outlines the significance of social media structures that formalize interactions and how data can be analyzed as graphs.
Categorizes types of networks (interactive vs. symbolic) to explain the diverse applications of network analysis.
Introduces various file formats essential for graph data analysis and their specific functionalities.
Defines graphs and illustrates properties like nodes and edges, including numerical analysis for functionality.
Discusses techniques for bringing structure to the surface with interactive visual analytics and spatial layouts.
Explores key measures of centrality in network analysis, presenting Freeman's contributions.
Analyzes real-world data from social media networks (Facebook and Twitter) through centrality and co-hashtag analysis.
Highlights concepts in network statistics, explaining how they connect individual units to structural designs.
Spotlight on advanced plugins for spatial analysis and diverse projections in network visualization.
Concludes the presentation with a note on the approach to approximate data analysis and invites future contact.
Interactive visualization and exploration of network data with Gephi
1.
Interactive visualization andexploration
of network data with gephi
Bernhard Rieder
Universiteit van Amsterdam
Mediastudies Department
and some conceptual context
2.
Two kinds ofmathematics
Can there be data analysis without math? No.
Does this imply epistemological commitments? Yes.
But there are choices, e.g. between:
☉ Confirmatory data analysis => deductive
☉ Exploratory data analysis (Tukey 1962) => inductive
3.
Two kinds ofmathematics
Statistics
Observed: objects and properties
Inferred: social forces
Data representation: the table
Visual representation: quantity charts
Grouping: "class" (similar properties)
Graph-theory
Observed: objects and relations
Inferred: structure
Data representation: the matrix
Visual representation: network diagrams
Grouping: "clique" (dense relations)
Graph theory
Develops overthe 20th century, in particular the second half.
Integrates branches of mathematics (topology, geometry, statistics, etc.).
Graph theory is "the mathematics of structure" (Harary 1965), "a
mathematical model for any system involving a binary relation" (Harary
1969); it makes relational structure calculable.
"Perhaps even more than to the contact between mankind and nature, graph theory owes to
the contact of human beings between each other." (König 1936)
6.
Basic ideas
Moreno 1934
Graphtheory developed in
exchange with sociometry,
small-group research and
(later) social exchange
theory.
Starting point:
"the sociometric test"
(experimental definition of
"relation")
Basic ideas
The networksingularity
Why do network analysis and visualization? Which arguments are put
forward?
☉ New media: technical and conceptual structures modeled as networks
☉ The network imaginary: networks as analytical device and trending topic
☉ Calculative capacities: powerful techniques and tools
☉ Visualization: the network diagram, "visual analytics"
☉ Logistics: data, software, and hardware are available and cheap
☉ Methodology I: dissatisfaction with statistics => SNA
☉ Methodology II: a "new science of networks" (Watts 2005) emerged
☉ Society: diversification, problems with demographics / statistics / theory
Graph theory
Graph theoryconsists of or provides:
☉ A basic conceptual and formal model (point and line)
☉ Descriptive and analytical language to talk about specific graphs
☉ Extensive calculability of structure
☉ Various “native” (and non-native) forms of visualization
13.
Formalization
"As we haveseen, the basic terms of digraph theory are point and line. Thus, if an
appropriate coordination is made so that each entity of an empirical system is identified
with a point and each relationship is identified with a line, then for all true statements
about structural properties of the obtained digraph there are corresponding true statements
about structural properties of the empirical system." (Harary et al. 1965)
There is always an epistemological commitment!
=> What can "carry" the reductionism and formalization?
14.
Much of thesedata can be
analyzed as graphs.
Social media formalize
interaction at the interface.
15.
Basic ideas
What Kindof Phenomena/Data?
Interactive networks (Watts 2004): link encodes tangible interaction
☉ social network
☉ citation networks
☉ hypertext networks
Symbolic networks (Watts 2004): link is conceptual
☉ co-presence (Tracker Tracker, IMDB, etc.)
☉ co-word
☉ any kind of "structure" that can be formalized as point and line
=> do all kinds of analysis (SNA, transportation, text mining, etc.)
=> analyze structural properties in various ways
16.
Basic ideas
File formats
Tobe able to begin, we need data in a graph file format. There are a
number of different file formats used to specify graphs.
Different formats have different capacities (e.g. .gexf allows to specify
time intervals).
The guess (.gdf) format:
http://courses.polsys.net/gephi/
17.
Basic ideas
What isa graph?
An abstract representation of nodes connected by links.
Two ways of analyzing graphs:
☉ numerical analysis (graph statistics, structural measures, etc.)
☉ visualization (network diagram, matrix, arc diagram, etc.)
Vertices and edges!
Nodesand lines!
Two main types:
Directed (e.g. Twitter)
Undirected (e.g. Facebook)
Properties of nodes:
degree, centrality, etc.
Properties of edges:
weight, direction, etc.
Properties of the graph:
averages, diameter, communities, etc.
Basic ideas
What is a graph?
A
B
C
D
a-b
b-d
b-c c-d
Nodes, Degree:
A: 1, B: 3, C: 2, D: 2
Nodes, Weighted Degree:
A: 1, B: 3, C: 3, D: 3
Edges, Weight:
a-b: 1, b-c: 1, b-d: 1, c-d: 2
Graph, diameter: 2
Graph, density: 0.667 (4 edges out of 6)
Graph, average shortest path: 1.334
Numbers are great for comparison!
FB group "Islamis dangerous"
Friendship network, color: betweenness centrality
2.339 members
Average degree of 39.69
81.7% have at least one friend in the group
55.4% five or more
37.2% have 20 or more
founder and admin has 609 friends
Network statistics
betweenness centrality
degree
Relationalelements of graphs can
be represented as tables (nodes
have properties) and analyzed
through statistics.
Network statistics bridge the gap
between individual units and the
structural forms they are
embedded in.
This is currently an extremely
prolific field of research.
Thank You
rieder@uva.nl
https://www.digitalmethods.net
http://thepoliticsofsystems.net
"Far betteran approximate answer to the right question,
which is often vague, than an exact answer to the wrong
question, which can always be made precise. Data
analysis must progress by approximate answers, at best,
since its knowledge of what the problem really is will at
best be approximate." (Tukey 1962)
Editor's Notes
#3 Tukey, The Future of Data Analysis, 1962We don’t have rigorous methods for hypothesis testing in network analysis.
#4 Allows for all kinds of folding, combinations, etc. – Math is not homogeneous, but sprawling!Different forms of reasoning, different modes of aggregation.These are already analytical frameworks, different ways of formalizing.Statistics: atomism, structure is implicit ("hidden forces", "social forces" cf. Durhkeim) => groups are abstractions, constituted by socioeconomic similaritySocial Network Analysis: atomism, structure is explicit ("dyadic forces") => groups are concrete, constituted by social exchange
#9 Now we can calculate (in particular via matrix algebra).
#10 Handbooks on graph theory are full of exhaustive discussions of basic graph types. Loads of vocabulary and analytical approaches.
#13 Handbooks on graph theory are full of exhaustive discussions of basic graph types. Loads of vocabulary and analytical approaches.
#15 Very large scale systems on the one side, but highly concentrated data repositories on the other.The promise of data analysis is, of course, to use that data to make sense of all the complexity.
#24 Visualization is, again, one type of analysis.Which properties of the network are "made salient" by an algorithm?http://thepoliticsofsystems.net/2010/10/one-network-and-four-algorithms/Models behind: spring simulation, simulated annealing (http://wiki.cns.iu.edu/pages/viewpage.action?pageId=1704113)
#25 Non force-based layouts can be extremely useful. Gephi can produce those as well
#28 Network analysis has produced a large number of calculated metrics that take into account the structure of the network."All in all, this process resulted in the specification of nine centrality measures based on three conceptual foundations. Three are based on the degrees of points and are indexes of communication activity. Three are based on the betweenness of points and are indexes of potential for control of communication. And three are based on closeness and are indexes either of independence or efficiency." (Freeman 1979)What concepts are these metrics based on?
#32 Network metrics are highly dependent on individual variables. Here: the same network with PageRank with four different values for the dampening parameter alpha. (red=highest PR value, yellow=second highest, turquoise=third highest)See Rieder 2012: http://computationalculture.net/article/what_is_in_pagerank
#33 From DMI workshop on anti-Islamism and right-wing extremism.We can also look at interaction patters: activity structure, held together by leaders?
#34 Extend word lists (what am I missing?), account for refraction. Rieder & Gerlitz 2013: http://journal.media-culture.org.au/index.php/mcjournal/article/viewArticle/620Rieder 2012: http://firstmonday.org/ojs/index.php/fm/article/view/4199/3359
#35 Project variables into the graph User diversity = no of unique users of a hashtag divided by hashtag frequency
#36 Larger roles of hashtags, not all are issue markers!
#38 There is no need to analyze and visualize a graph as a network.Characterize hashtags in relation to a whole. (their role beyond a particular topic sample), better understand our "fishing pole" (the sample technique) and the weight it carries.Tbt: throwback thursday
#41 This is a technical process, but to be a method, there needs to be adequation between a conceptual element and a technical one.These steps translate a large number of commitments to particular ideas.A postdemographic (Rogers) approach.