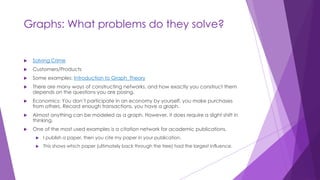
Overview of GraphX
Presentation by @dougneedham
Introduction
 @dougneedham
 Data Guy - Started as a DBA in the Marine Corps, evolved to Architect,
now aspiring Data Scientist.
 Oracle, SQL Server, Cassandra, Hadoop, MySQL, Spark.
 I have a strong relational/traditional background.
 Perpetual Student
 Learning new things challenges our assumptions. Forces us to take a
new perspective on “old” problems. Eventually maybe even shows us
that there is a better way to solve a problem.
Graphs: What problems do they solve?
 Solving Crime
 Customers/Products
 Some examples: Introduction to Graph_Theory
 There are many ways of constructing networks, and how exactly you construct them
depends on the questions you are posing.
 Economics: You don’t participate in an economy by yourself, you make purchases
from others. Record enough transactions, you have a graph.
 Almost anything can be modeled as a graph. However, it does require a slight shift in
thinking.
 One of the most used examples is a citation network for academic publications.
 I publish a paper, then you cite my paper in your publication.
 This shows which paper (ultimately back through the tree) had the largest influence.
A little History
 The 7 Bridges of Konisberg
 Every tome on Graph theory or Network analysis devotes a small
portion of there time to the 7 Bridges of Konisberg.
 If I don’t cover this with you, the gods of mathematics will strike me
down, and never allow me to do analysis again in the future.
The Bridges
The Problem
 Folks enjoyed there Sunday afternoon strolls across the bridges, but
occasionally people would wonder if one particular route was more
efficient than another.
 Eventually Leonhard Euler was brought into the debate about the
efficiency problem.
 Euler used Vertices to represent the land masses and edges (or arcs, at
the time) to represent bridges. He realized the odd number of edges
per vertex made the problem unsolvable.
 Sarada Herke provides for one of the best explanations of the solution
Solution to Konisburg
 And here is the cool thing about mathematicians. If we tell you
something is impossible, we have to tell you why in a way you can
understand it. But he also invented the branch of mathematics today
we call Graph Theory.
 http://en.wikipedia.org/wiki/Leonhard_Euler
A few terms
 Stand back, we are going to talk about math!
 Basically we are talking about a bunch of dots joined together by lines
 Vertex – Dot on a graph
 Edge – Line connecting the two points
 Edge_Label – this is a term I coined originally related to Data Structure Graphs that
helps trace a path. If you label your edges, and you have multiple edges with the same
label in a Graph you can quite easily identify walks, paths, and cycles through your
graph.
 Triangle – 3 Vertices, 3 Edges
 Square – 4 Vertices, 4 edges
 Open Triangle - 3 Vertices, 2 edges
 A lot of things are networks if you look at them the right way.
 Mark Newman has done a number of really cool presentations, available on Youtube
about Network analysis.
 https://www.youtube.com/watch?v=lETt7IcDWLI
More terms
 Shortest path – How are two vertices connected?
 Longest Path – Tracing the flow of an interesting item through a large
collection of applications.
 What is a path?
 Centrality – Hub and Authority
 This is almost a whole topic by itself, since there are different types of Centrality:
 Degree Centrality, Eigenvector Centrality, PageRank, etc…
 Transitivity
 Homophily – how things are similar
 Directed Graphs – or Digraphs
 Contagion – How do things “spread” through a network?
 Let’s rearrange things, how does the layout affect understanding?
 Order of a graph – number of vertices
 Size of the graph – number of edges
 This is not just data visualization, it can also be used for prediction.
https://www.youtube.com/watch?v=rwA-y-XwjuU
Samples
 Some Samples from Wiki.
 On the right, a basic graph, on the left the languages used in wikipedia
Little sidebar - Paths
 Now that we have some terms under our belt.
 What is the difference between shortest path, and longest path?
The Math doesn’t change.
 One thing I like about Graphs –
 The Math does not change.
 The math behind Graph theory can be a little intense, but it does not
change regardless of the scale of the graph.
 Once you understand how to “do the math” on a small graph, those
same Maths apply to a Graph whether it is a graph of the people in this
room, or a graph of the people on this planet.
Small Graphs
 What is a small graph?
 Friends on Facebook, or LinkedIN.
 Usually this can be displayed and analyzed rather easily.
 If the Graph continues to grow, you need better tools.
 Let’s do a quick demo of a small graph visualization.
Gephi
 http://gephi.github.io/
 From the website: “Gephi is an interactive visualization and exploration
platform for all kinds of networks and complex systems, dynamic and
hierarchical graphs.”
 To get this yourself go into Facebook and search for: Netvizz. (You have
to authorized it. You can un-authorized it later)
 Click the application.
 Click “personal network”
 Click Start
 Download your gdf file
 Quick Demo – ( Vote time: If everyone is comfortable with general
graphs we can come back to this.)
Large Graphs
 What is a large graph?
 To me a large graph is one that cannot be easily visualized by software
such as Gephi.
 You have to use large tools to calculate the important statistics, such as
centrality, diameter, average degree, etc…
 Breaking a large graph down to a small graph is actually not as simple
as it sounds.
 This can be done reasonably easily with tools such as GraphX
 Now what we all came for:
GraphX
GraphX
 GraphX is Apache Spark's API for graphs and graph-parallel
computation.
 https://spark.apache.org/graphx/
 http://ampcamp.berkeley.edu/big-data-mini-course/graph-analytics-
with-graphx.html
 While GraphX is “just a library” it is a library that exists within the Spark
environment. Which provides a whole host of benefits like scaling,
clustering, storage, and other things that you don’t have to dwell on.
 As of right now, GraphX is Scala only.
Data Science Challenge
 Who should Follow whom?
 Winklr is a curiously popular social network for fans of the sitcom Happy
Days. Users can post photos, write messages, and most importantly,
follow each other’s posts and content. This helps users keep up with
new content from their favorite users on the site.
 Problem 3 of the data science challenge was a graph analysis
problem.
 Derive the top 70,000 connections that should be recommended.
Sample of the whole graph
My approach
 Type of problem: Graph Analysis
 Create a Master Graph.
 Run Page Rank to identify centrality.
 Create many small graphs for individual users.
 Mask the Master Graph, and PageRank Graph.
 Multiply out Centrality, number of in Degrees for a possible followers,
and the inverse of the length of the path away from this particular user
to a candidate vertex to be followed.
 This code runs in over 48 hours.
 Code: Problem3.sh, and AnalyzeGraph.scala
Now we will review github
 https://github.com/dougneedham/Cloudera-Data-Scientist-
Challenge-3/tree/master/problem3
Snapshot of code:
 var PathGraph = ShortestPathFromSource.mask(ClickPairGraph)
 var Influence = PathGraph.joinVertices(MasterGraph.inDegrees)((id,pathlength,indeg)=> (1/pathlength)*indeg)
 var central_influence = Influence.joinVertices(MaskedMasterGraphPR.vertices)((id,dist,pagerank) => dist*pagerank)
 //
 // We want to eliminate the infinite, follow someone that there is in fact a path to
 //
 println("Processing " + central_influence.vertices.filter(_._2 < Double.PositiveInfinity).count())
 //central_influence.vertices.filter(_._2 < Double.PositiveInfinity).collect()foreach(record_to_list(SourceID,_))
 val save_file_name = base_path+"/problem3/OutGraph/"+SourceID.trim()+".data"
 central_influence.vertices.filter(_._2 < Double.PositiveInfinity).saveAsTextFile(save_file_name)
Expectations
 This is where we tie together the “small graphs” versus “big graphs”
 Creating a Sub-graph of a larger graph is not obvious.
 I was expecting to see one big clump of nodes tightly connected. This
would be the “Target” to follow.
 I was also expecting to see two smaller clumps of nodes, loosely
connected to the larger clump. These are the “followers”, as we make
a recommendation to them to follow the more popular node, they will
be closer connected to this user.
 Here is the output from Gephi that shows whether the code worked or
not.
Gephi output
Where do I get data?
 How you construct the network
depends on the question(s) you
are posing.
 Chances are you have lots of
data already, it is simply a
matter of perspective.
 Apply Graphs to your own
companies architecture
 Public social network data
 The example mentioned from
Gephi (netvizz)
Data Structure Graphs
 A DSG Level 1 can show you where you are going to have the most
interesting query performance of your tables.
 A DSG Level 2 can show you where the most amount of work is going
on in your Enterprise.
 Data Structure Graph Level 1 – This is roughly like an Entity Relationship
Diagram (ERD) Tables are Vertices, Foreign Keys are Edges.
 Data Structure Graph Level 2 – Each Vertex in this graph is an
application. Each Edge is data transfer. Roughly equivalent to what we
used to call Data Flow diagrams.
SNAP
 SNAP – Stanford Network Analysis Project.
 If you want to learn about how to do Network Analysis and you can’t
find any data, go here.
Consider the following:
 Network/Graph Analysis is cool.
 It can show you some interesting things about your data that you may
not have considered.
 Due thought should be put towards a network analysis project.
 Organizing the data requires a bit of thought. (From -> To vertices is just
a start).
 Directed graph, undirected, bigraph? Some up front setup work needs
to be done.
 Tools help with the detailed calculations, and show the paths, walks,
etc.
 If you need assistance, send a message to the group, or contact me
directly (I am easy to find @dougneedham)
Final Thoughts – Questions?

Apache Spark GraphX highlights.

  • 1.
  • 2.
    Introduction  @dougneedham  DataGuy - Started as a DBA in the Marine Corps, evolved to Architect, now aspiring Data Scientist.  Oracle, SQL Server, Cassandra, Hadoop, MySQL, Spark.  I have a strong relational/traditional background.  Perpetual Student  Learning new things challenges our assumptions. Forces us to take a new perspective on “old” problems. Eventually maybe even shows us that there is a better way to solve a problem.
  • 3.
    Graphs: What problemsdo they solve?  Solving Crime  Customers/Products  Some examples: Introduction to Graph_Theory  There are many ways of constructing networks, and how exactly you construct them depends on the questions you are posing.  Economics: You don’t participate in an economy by yourself, you make purchases from others. Record enough transactions, you have a graph.  Almost anything can be modeled as a graph. However, it does require a slight shift in thinking.  One of the most used examples is a citation network for academic publications.  I publish a paper, then you cite my paper in your publication.  This shows which paper (ultimately back through the tree) had the largest influence.
  • 4.
    A little History The 7 Bridges of Konisberg  Every tome on Graph theory or Network analysis devotes a small portion of there time to the 7 Bridges of Konisberg.  If I don’t cover this with you, the gods of mathematics will strike me down, and never allow me to do analysis again in the future.
  • 5.
  • 6.
    The Problem  Folksenjoyed there Sunday afternoon strolls across the bridges, but occasionally people would wonder if one particular route was more efficient than another.  Eventually Leonhard Euler was brought into the debate about the efficiency problem.  Euler used Vertices to represent the land masses and edges (or arcs, at the time) to represent bridges. He realized the odd number of edges per vertex made the problem unsolvable.  Sarada Herke provides for one of the best explanations of the solution Solution to Konisburg  And here is the cool thing about mathematicians. If we tell you something is impossible, we have to tell you why in a way you can understand it. But he also invented the branch of mathematics today we call Graph Theory.  http://en.wikipedia.org/wiki/Leonhard_Euler
  • 7.
    A few terms Stand back, we are going to talk about math!  Basically we are talking about a bunch of dots joined together by lines  Vertex – Dot on a graph  Edge – Line connecting the two points  Edge_Label – this is a term I coined originally related to Data Structure Graphs that helps trace a path. If you label your edges, and you have multiple edges with the same label in a Graph you can quite easily identify walks, paths, and cycles through your graph.  Triangle – 3 Vertices, 3 Edges  Square – 4 Vertices, 4 edges  Open Triangle - 3 Vertices, 2 edges  A lot of things are networks if you look at them the right way.  Mark Newman has done a number of really cool presentations, available on Youtube about Network analysis.  https://www.youtube.com/watch?v=lETt7IcDWLI
  • 8.
    More terms  Shortestpath – How are two vertices connected?  Longest Path – Tracing the flow of an interesting item through a large collection of applications.  What is a path?  Centrality – Hub and Authority  This is almost a whole topic by itself, since there are different types of Centrality:  Degree Centrality, Eigenvector Centrality, PageRank, etc…  Transitivity  Homophily – how things are similar  Directed Graphs – or Digraphs  Contagion – How do things “spread” through a network?  Let’s rearrange things, how does the layout affect understanding?  Order of a graph – number of vertices  Size of the graph – number of edges  This is not just data visualization, it can also be used for prediction. https://www.youtube.com/watch?v=rwA-y-XwjuU
  • 9.
    Samples  Some Samplesfrom Wiki.  On the right, a basic graph, on the left the languages used in wikipedia
  • 10.
    Little sidebar -Paths  Now that we have some terms under our belt.  What is the difference between shortest path, and longest path?
  • 11.
    The Math doesn’tchange.  One thing I like about Graphs –  The Math does not change.  The math behind Graph theory can be a little intense, but it does not change regardless of the scale of the graph.  Once you understand how to “do the math” on a small graph, those same Maths apply to a Graph whether it is a graph of the people in this room, or a graph of the people on this planet.
  • 12.
    Small Graphs  Whatis a small graph?  Friends on Facebook, or LinkedIN.  Usually this can be displayed and analyzed rather easily.  If the Graph continues to grow, you need better tools.  Let’s do a quick demo of a small graph visualization.
  • 13.
    Gephi  http://gephi.github.io/  Fromthe website: “Gephi is an interactive visualization and exploration platform for all kinds of networks and complex systems, dynamic and hierarchical graphs.”  To get this yourself go into Facebook and search for: Netvizz. (You have to authorized it. You can un-authorized it later)  Click the application.  Click “personal network”  Click Start  Download your gdf file  Quick Demo – ( Vote time: If everyone is comfortable with general graphs we can come back to this.)
  • 14.
    Large Graphs  Whatis a large graph?  To me a large graph is one that cannot be easily visualized by software such as Gephi.  You have to use large tools to calculate the important statistics, such as centrality, diameter, average degree, etc…  Breaking a large graph down to a small graph is actually not as simple as it sounds.  This can be done reasonably easily with tools such as GraphX  Now what we all came for:
  • 15.
  • 16.
    GraphX  GraphX isApache Spark's API for graphs and graph-parallel computation.  https://spark.apache.org/graphx/  http://ampcamp.berkeley.edu/big-data-mini-course/graph-analytics- with-graphx.html  While GraphX is “just a library” it is a library that exists within the Spark environment. Which provides a whole host of benefits like scaling, clustering, storage, and other things that you don’t have to dwell on.  As of right now, GraphX is Scala only.
  • 17.
    Data Science Challenge Who should Follow whom?  Winklr is a curiously popular social network for fans of the sitcom Happy Days. Users can post photos, write messages, and most importantly, follow each other’s posts and content. This helps users keep up with new content from their favorite users on the site.  Problem 3 of the data science challenge was a graph analysis problem.  Derive the top 70,000 connections that should be recommended.
  • 18.
    Sample of thewhole graph
  • 19.
    My approach  Typeof problem: Graph Analysis  Create a Master Graph.  Run Page Rank to identify centrality.  Create many small graphs for individual users.  Mask the Master Graph, and PageRank Graph.  Multiply out Centrality, number of in Degrees for a possible followers, and the inverse of the length of the path away from this particular user to a candidate vertex to be followed.  This code runs in over 48 hours.  Code: Problem3.sh, and AnalyzeGraph.scala
  • 20.
    Now we willreview github  https://github.com/dougneedham/Cloudera-Data-Scientist- Challenge-3/tree/master/problem3
  • 21.
    Snapshot of code: var PathGraph = ShortestPathFromSource.mask(ClickPairGraph)  var Influence = PathGraph.joinVertices(MasterGraph.inDegrees)((id,pathlength,indeg)=> (1/pathlength)*indeg)  var central_influence = Influence.joinVertices(MaskedMasterGraphPR.vertices)((id,dist,pagerank) => dist*pagerank)  //  // We want to eliminate the infinite, follow someone that there is in fact a path to  //  println("Processing " + central_influence.vertices.filter(_._2 < Double.PositiveInfinity).count())  //central_influence.vertices.filter(_._2 < Double.PositiveInfinity).collect()foreach(record_to_list(SourceID,_))  val save_file_name = base_path+"/problem3/OutGraph/"+SourceID.trim()+".data"  central_influence.vertices.filter(_._2 < Double.PositiveInfinity).saveAsTextFile(save_file_name)
  • 22.
    Expectations  This iswhere we tie together the “small graphs” versus “big graphs”  Creating a Sub-graph of a larger graph is not obvious.  I was expecting to see one big clump of nodes tightly connected. This would be the “Target” to follow.  I was also expecting to see two smaller clumps of nodes, loosely connected to the larger clump. These are the “followers”, as we make a recommendation to them to follow the more popular node, they will be closer connected to this user.  Here is the output from Gephi that shows whether the code worked or not.
  • 23.
  • 24.
    Where do Iget data?  How you construct the network depends on the question(s) you are posing.  Chances are you have lots of data already, it is simply a matter of perspective.  Apply Graphs to your own companies architecture  Public social network data  The example mentioned from Gephi (netvizz)
  • 25.
    Data Structure Graphs A DSG Level 1 can show you where you are going to have the most interesting query performance of your tables.  A DSG Level 2 can show you where the most amount of work is going on in your Enterprise.  Data Structure Graph Level 1 – This is roughly like an Entity Relationship Diagram (ERD) Tables are Vertices, Foreign Keys are Edges.  Data Structure Graph Level 2 – Each Vertex in this graph is an application. Each Edge is data transfer. Roughly equivalent to what we used to call Data Flow diagrams.
  • 26.
    SNAP  SNAP –Stanford Network Analysis Project.  If you want to learn about how to do Network Analysis and you can’t find any data, go here.
  • 27.
    Consider the following: Network/Graph Analysis is cool.  It can show you some interesting things about your data that you may not have considered.  Due thought should be put towards a network analysis project.  Organizing the data requires a bit of thought. (From -> To vertices is just a start).  Directed graph, undirected, bigraph? Some up front setup work needs to be done.  Tools help with the detailed calculations, and show the paths, walks, etc.  If you need assistance, send a message to the group, or contact me directly (I am easy to find @dougneedham)
  • 28.