Downloaded 418 times

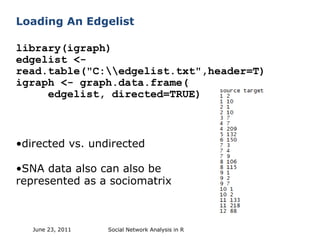
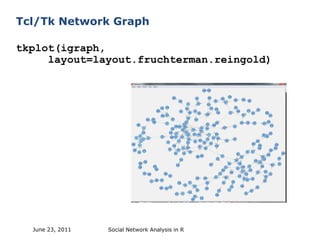
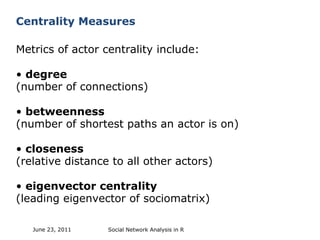
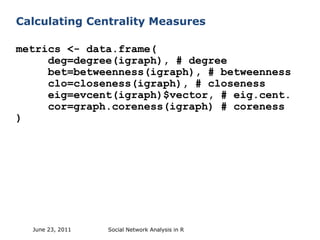
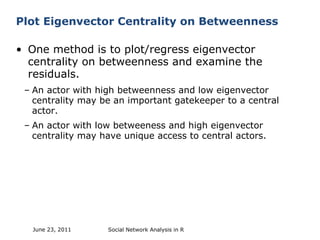
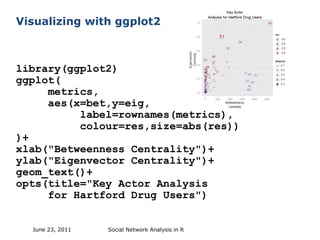

This document discusses loading social network data into R and performing social network analysis. It covers loading edge list data into igraph objects, visualizing networks using tkplot, calculating centrality measures like degree, betweenness, closeness and eigenvector centrality using functions from igraph, and identifying key actors by plotting eigenvector centrality against betweenness and examining residuals.


![Social Network Analysis [1994]](https://cdn.slidesharecdn.com/ss_thumbnails/socialnetworkanalysis1994-160617072245-thumbnail.jpg?width=640&height=640&fit=bounds)


![Getting Started with Apache Spark: Big Data Made Simple [Free Meetup]](https://cdn.slidesharecdn.com/ss_thumbnails/apachesparkgettingstarted-260203175547-8361bcc3-thumbnail.jpg?width=640&height=640&fit=bounds)


