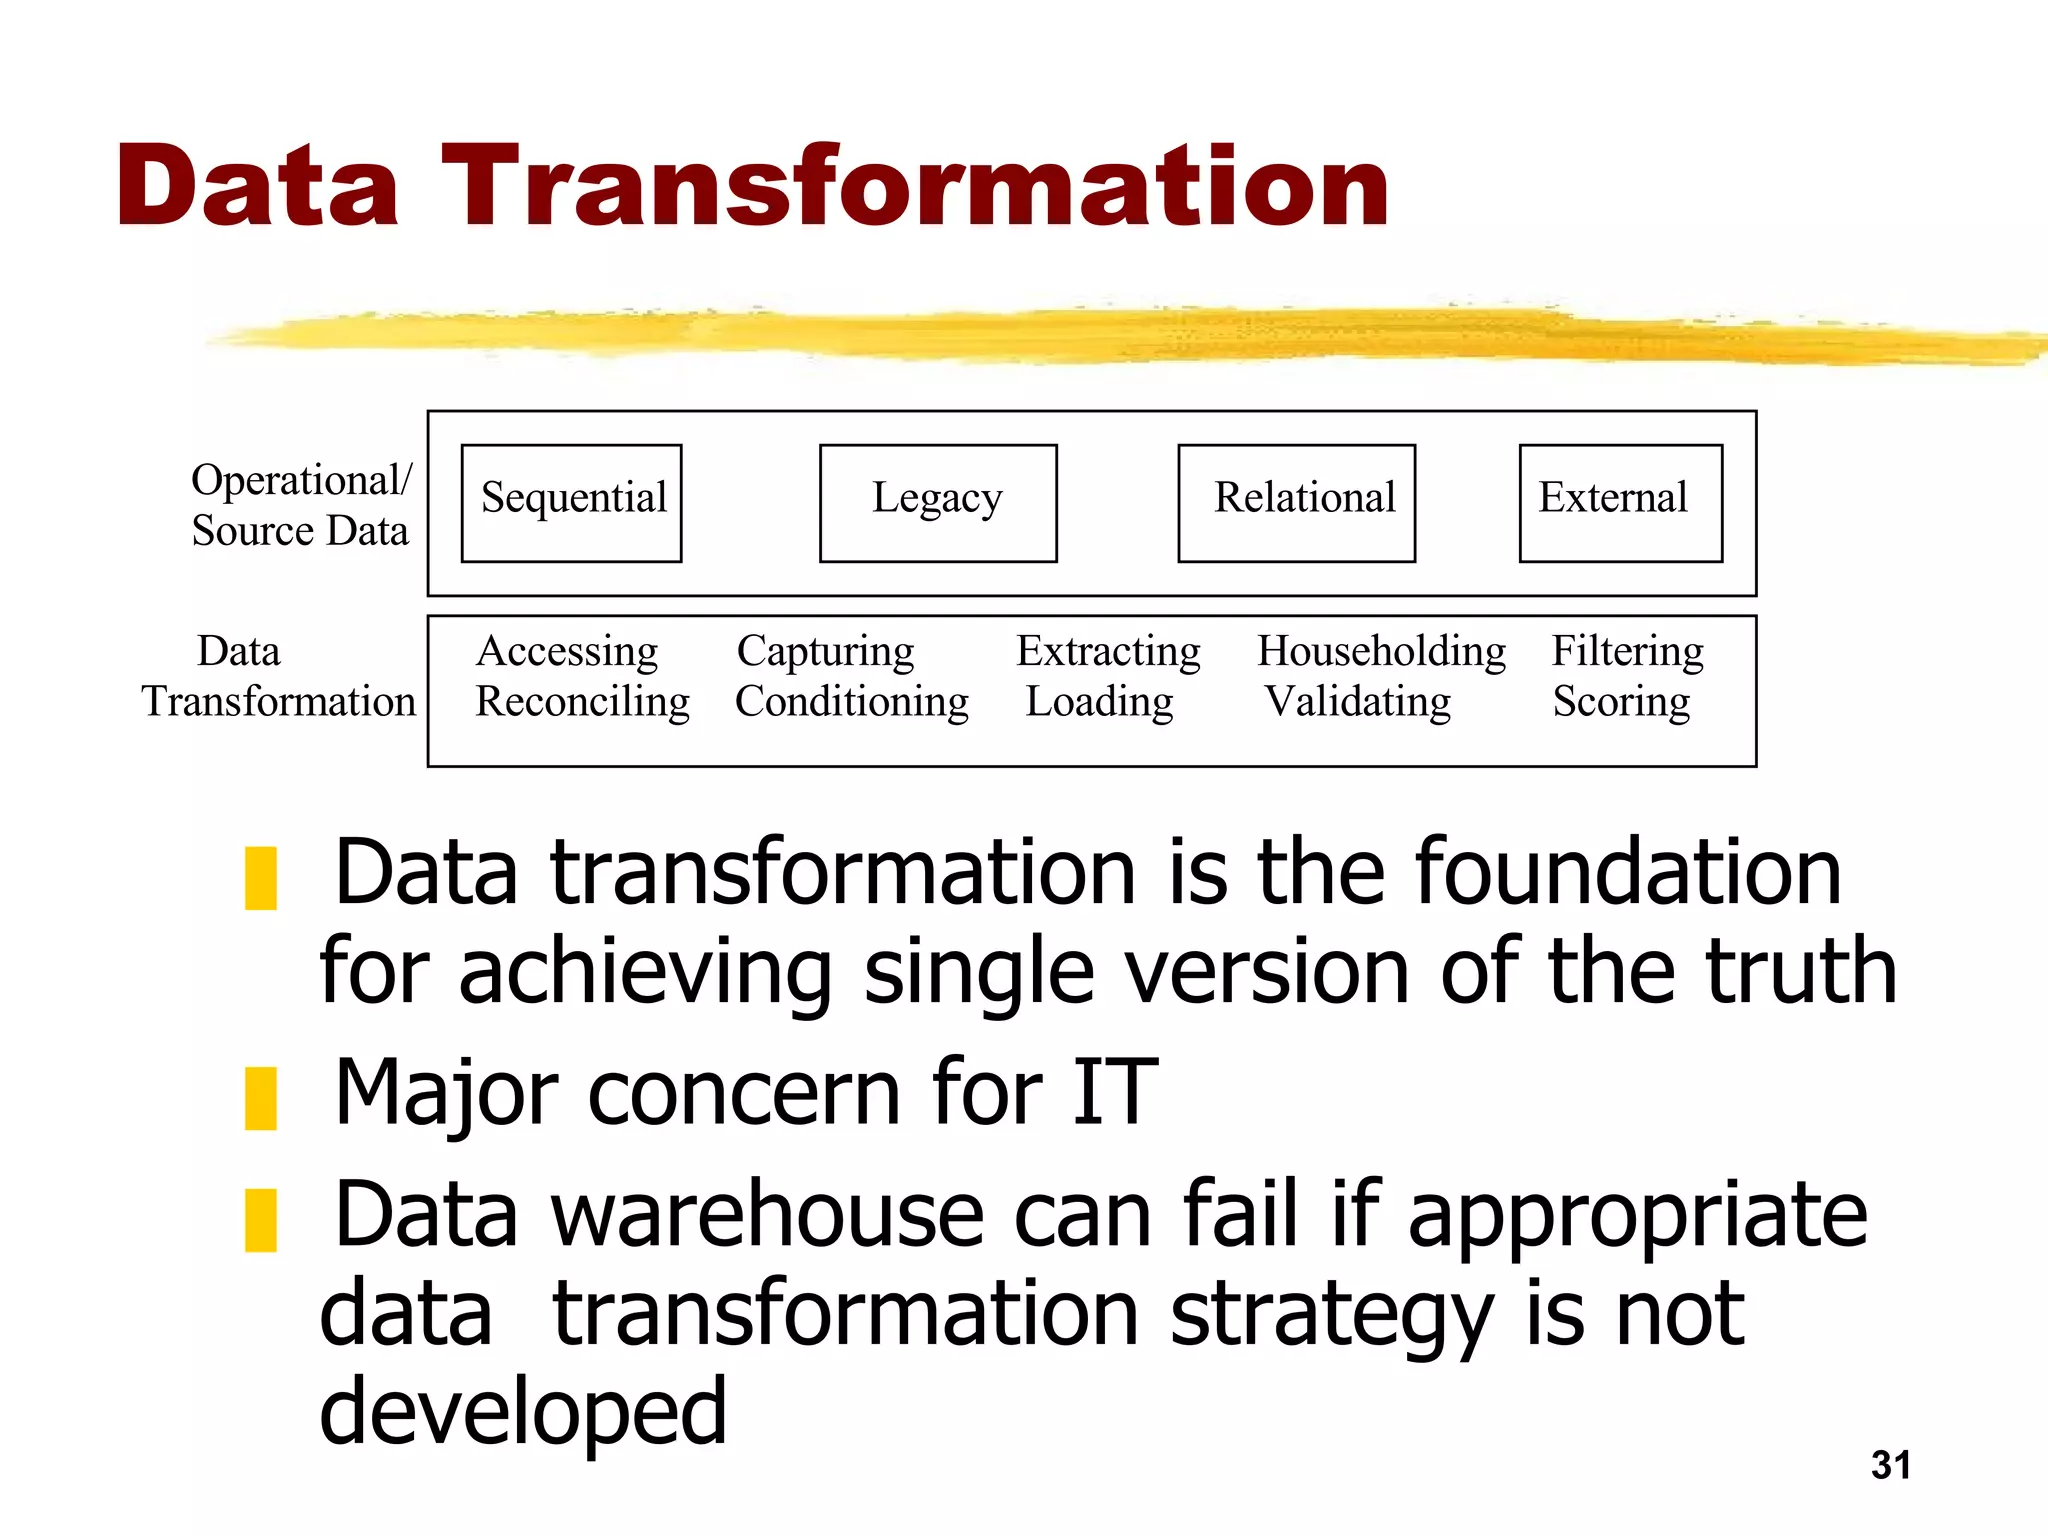
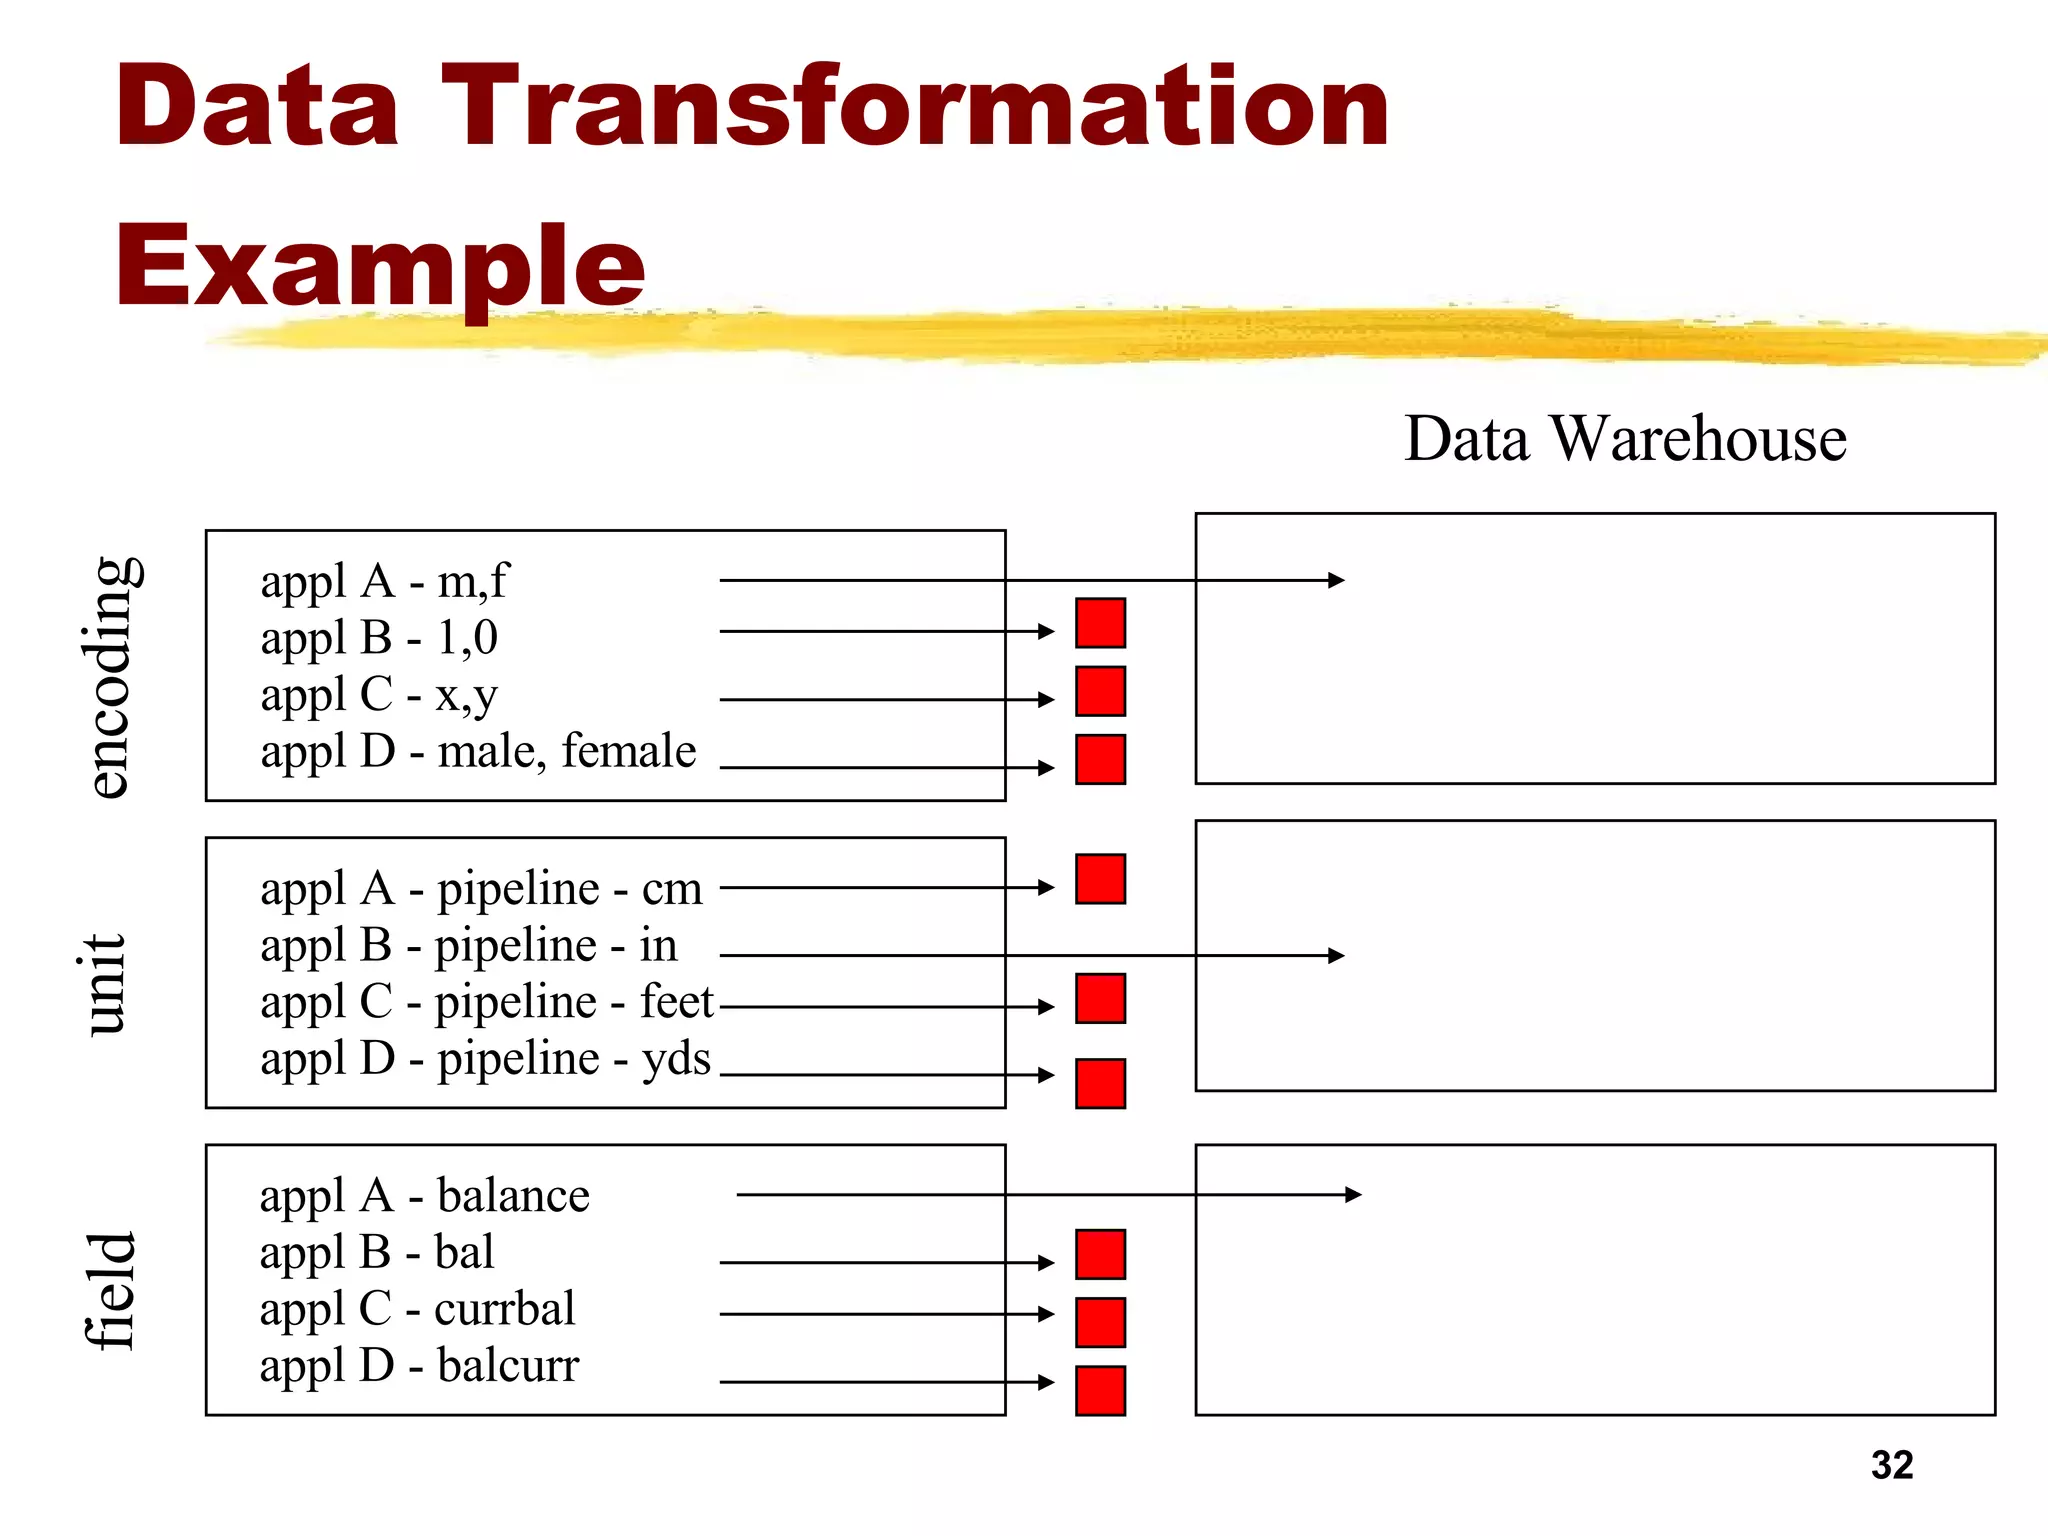
The document discusses advances in database querying and summarizes key topics including data warehousing, online analytical processing (OLAP), and data mining. It describes how data warehouses integrate data from various sources to enable decision making, and how OLAP tools allow users to analyze aggregated data and model "what-if" scenarios. The document also covers data transformation techniques used to build the data warehouse.
![Advances in Database Querying Satish Bobba Sr.Informatica Developer [email_address]](https://image.slidesharecdn.com/datawarehouse-overview-1207045152376001-4/75/Datawarehouse-Overview-1-2048.jpg)
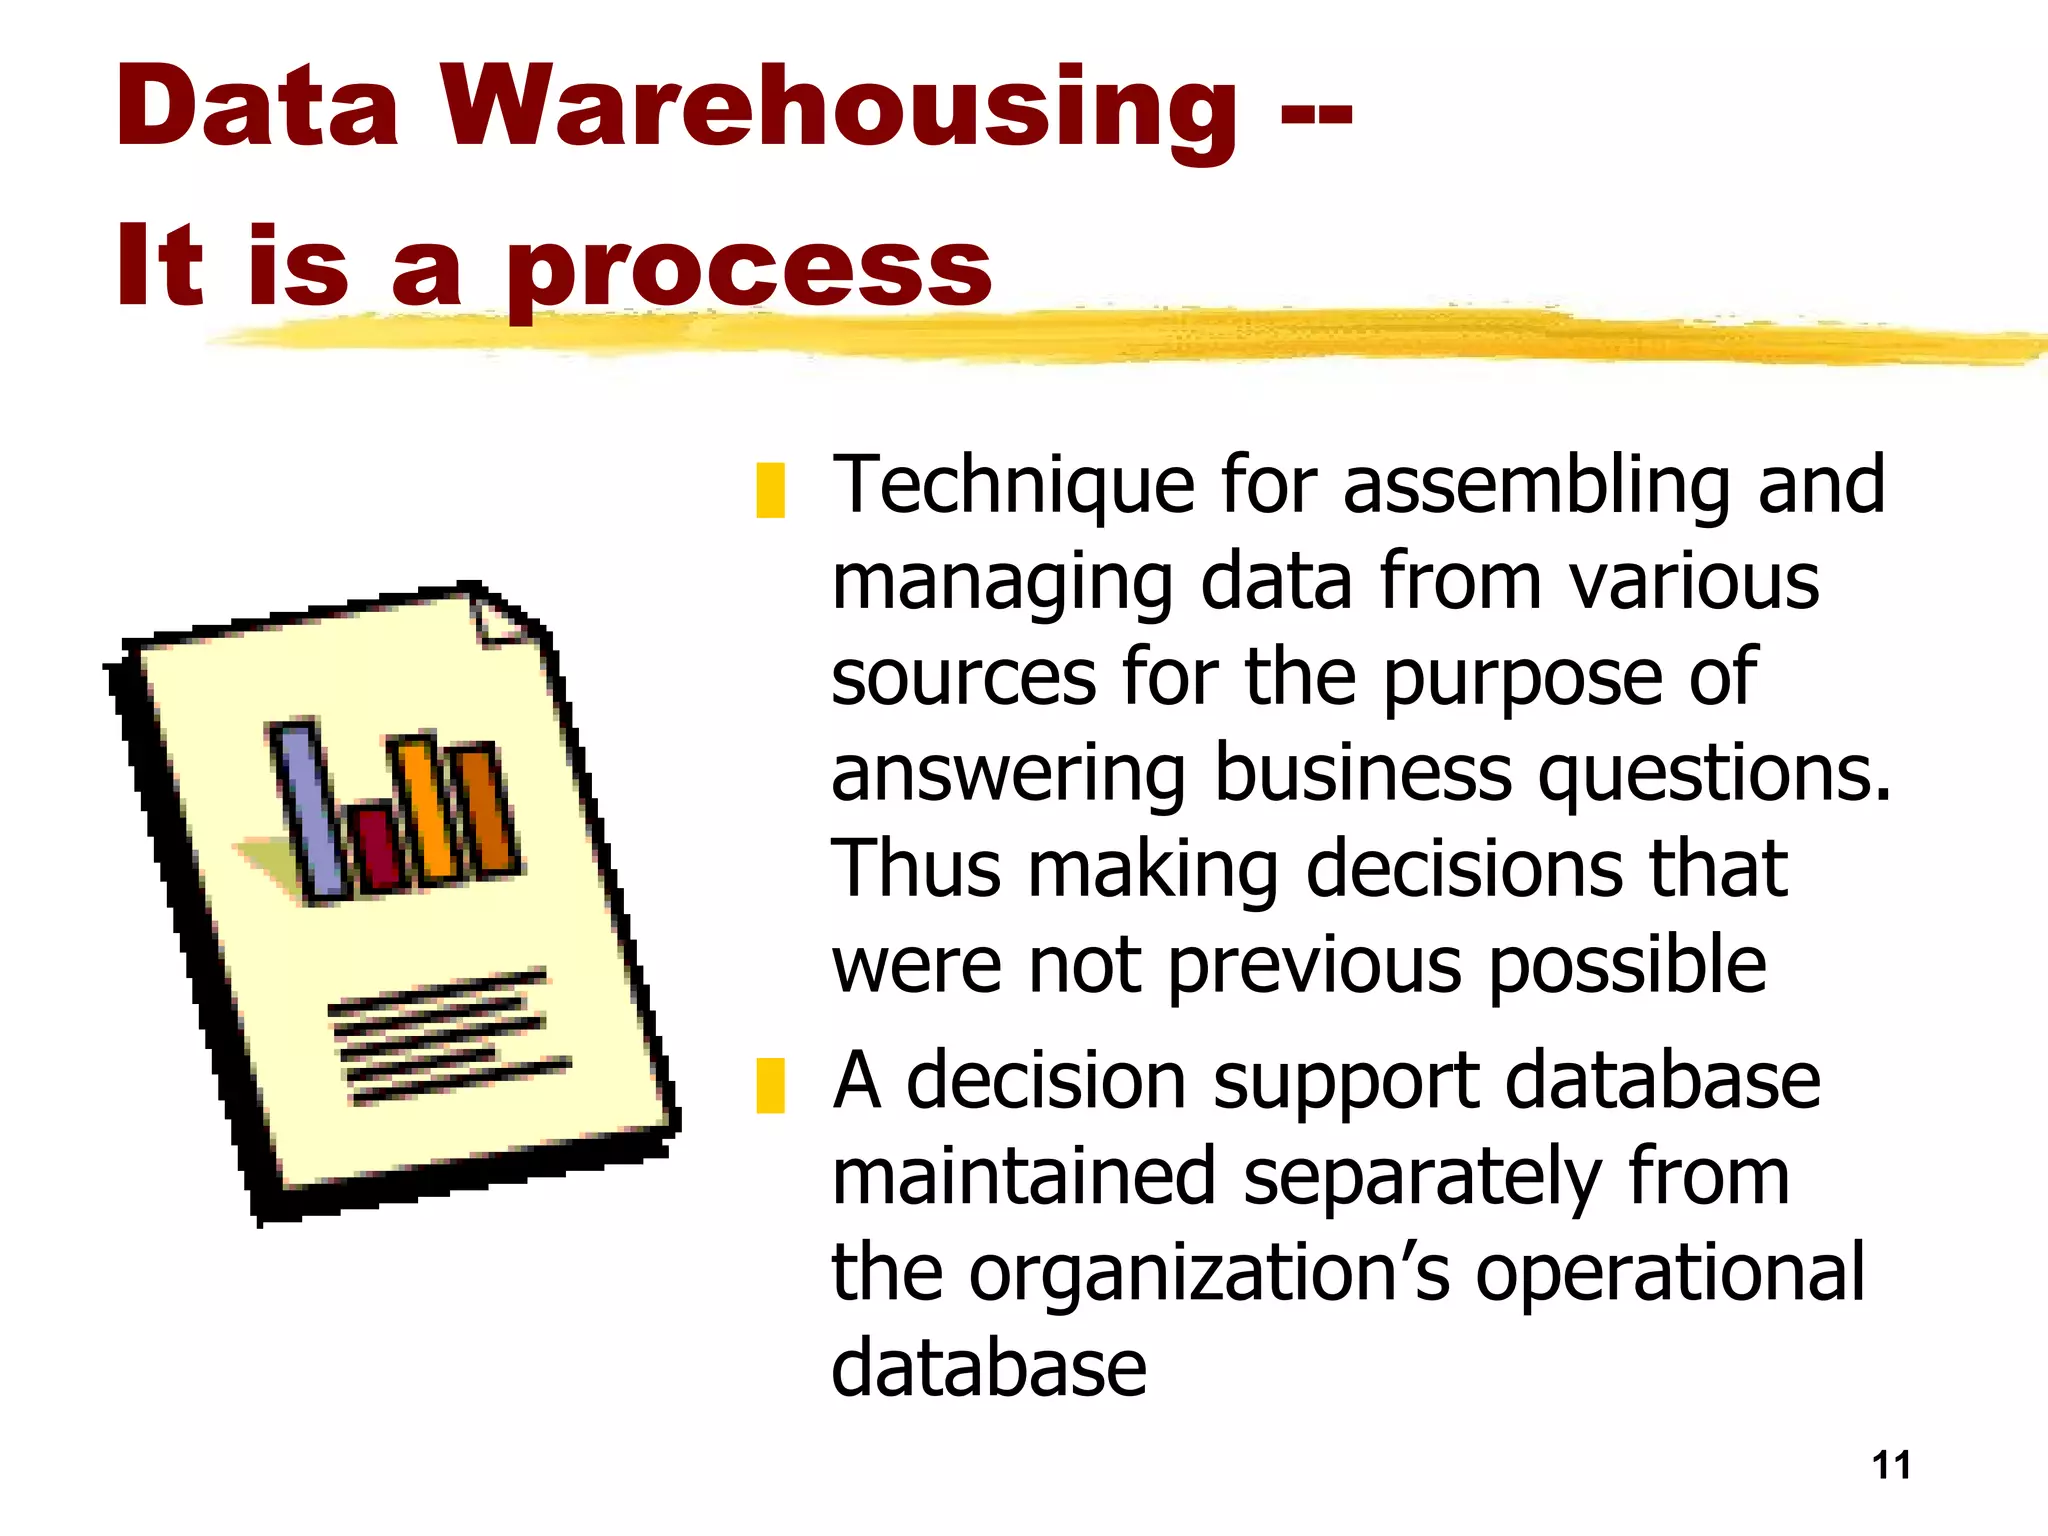
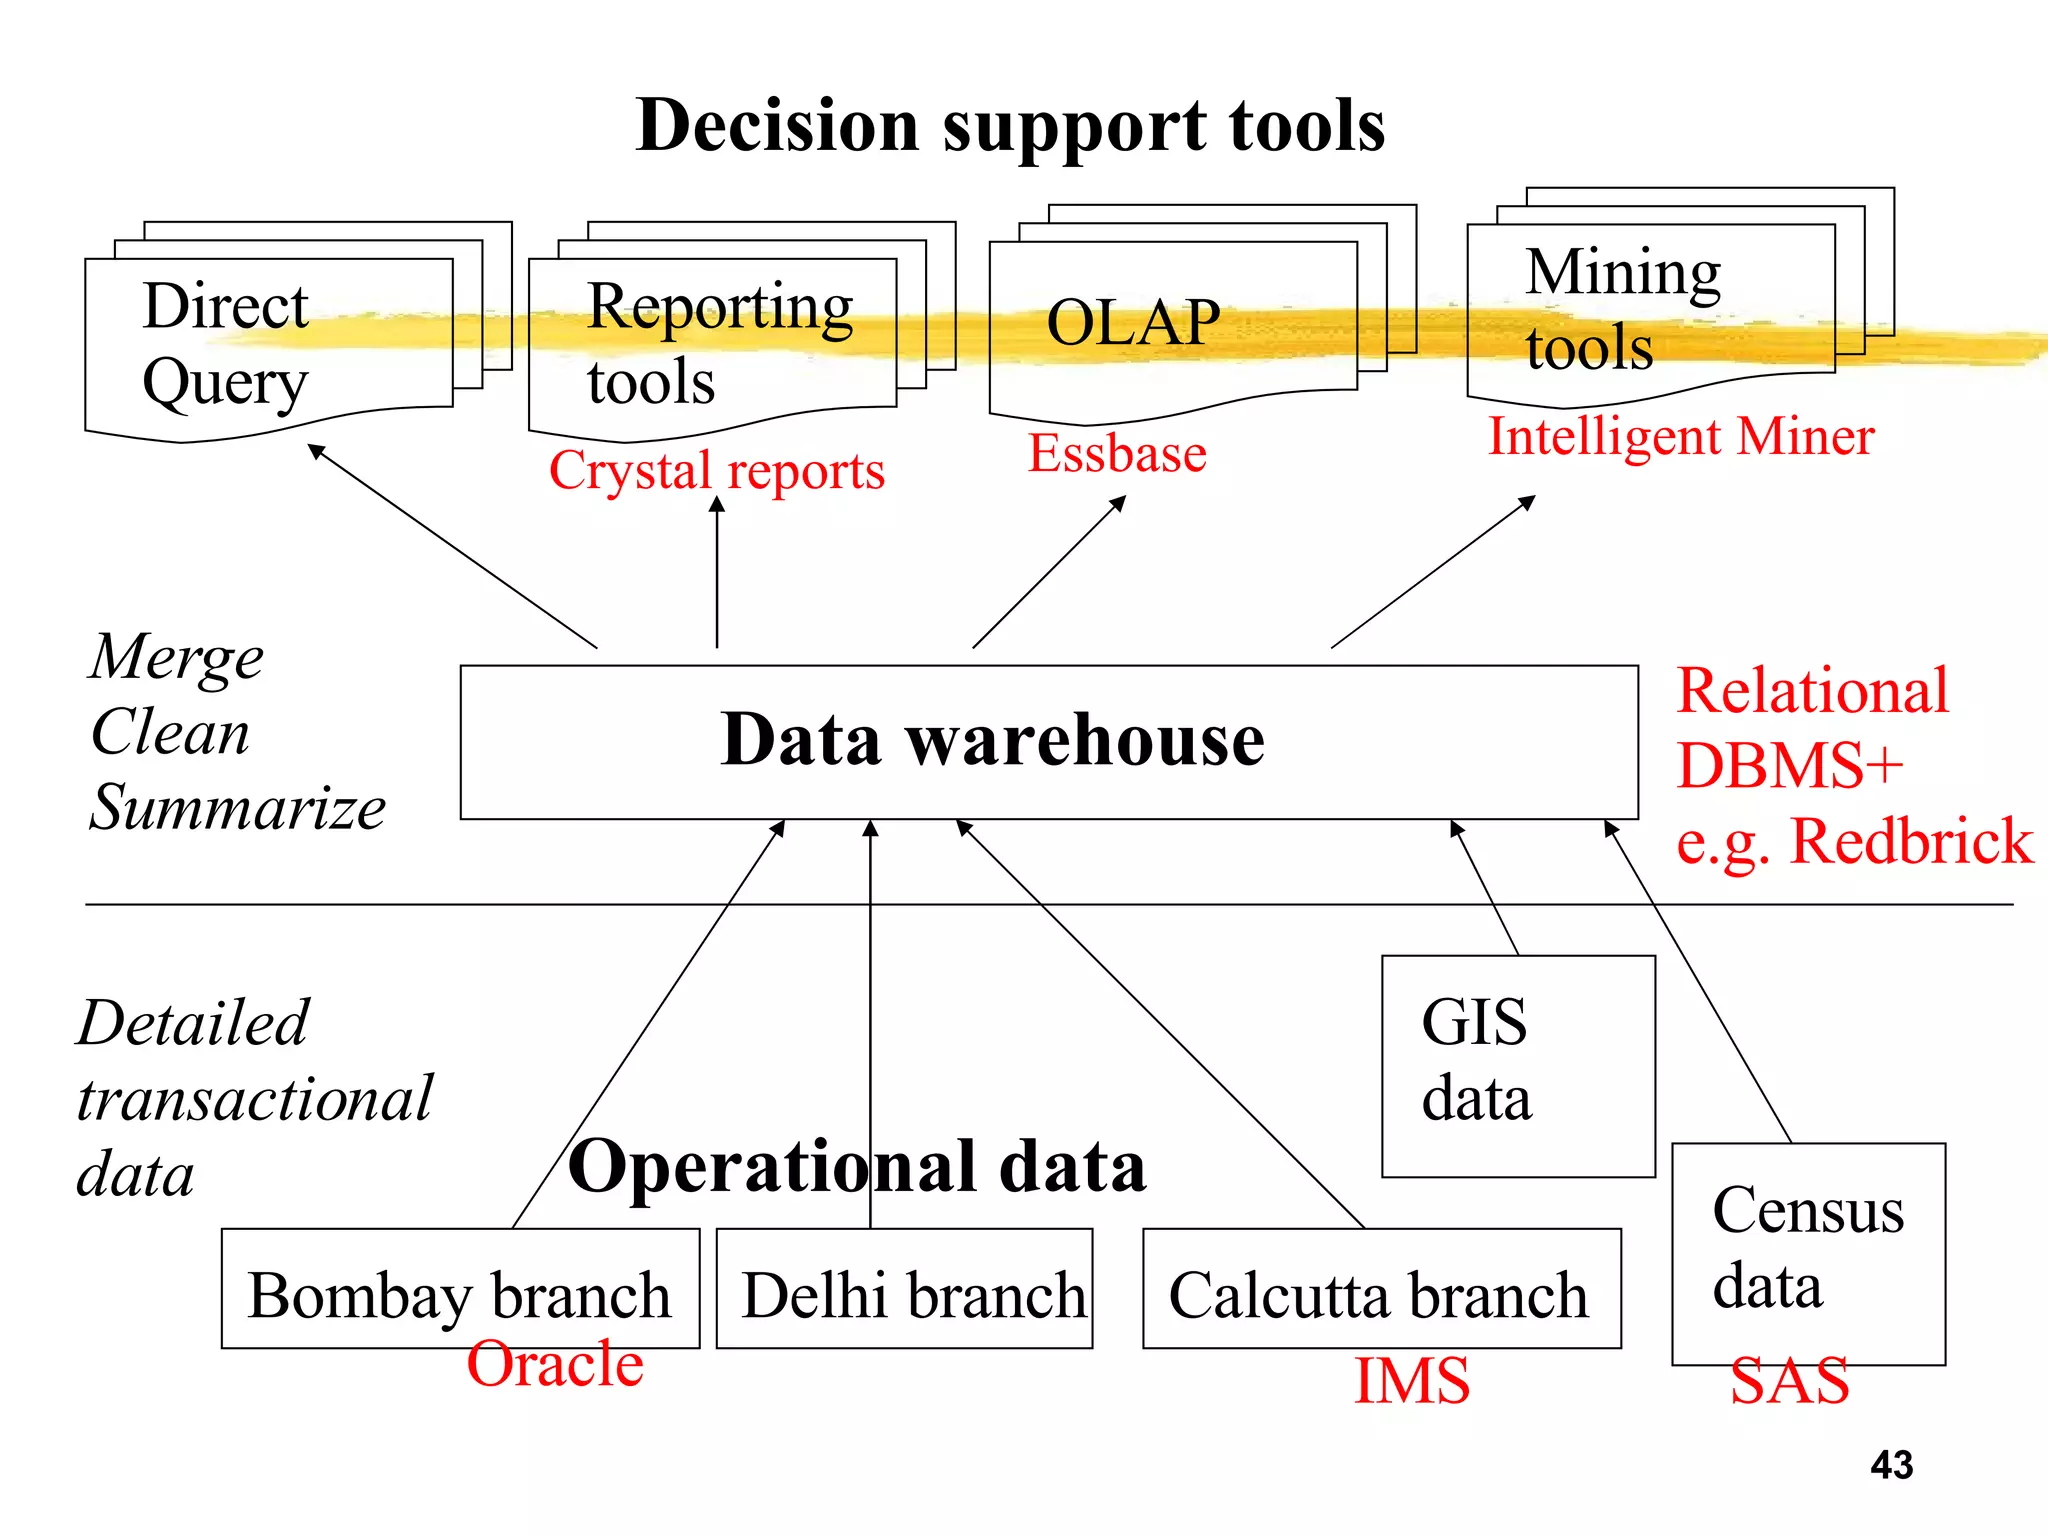
![What is a Data Warehouse? A single, complete and consistent store of data obtained from a variety of different sources made available to end users in a what they can understand and use in a business context. [Barry Devlin]](https://image.slidesharecdn.com/datawarehouse-overview-1207045152376001-4/75/Datawarehouse-Overview-6-2048.jpg)

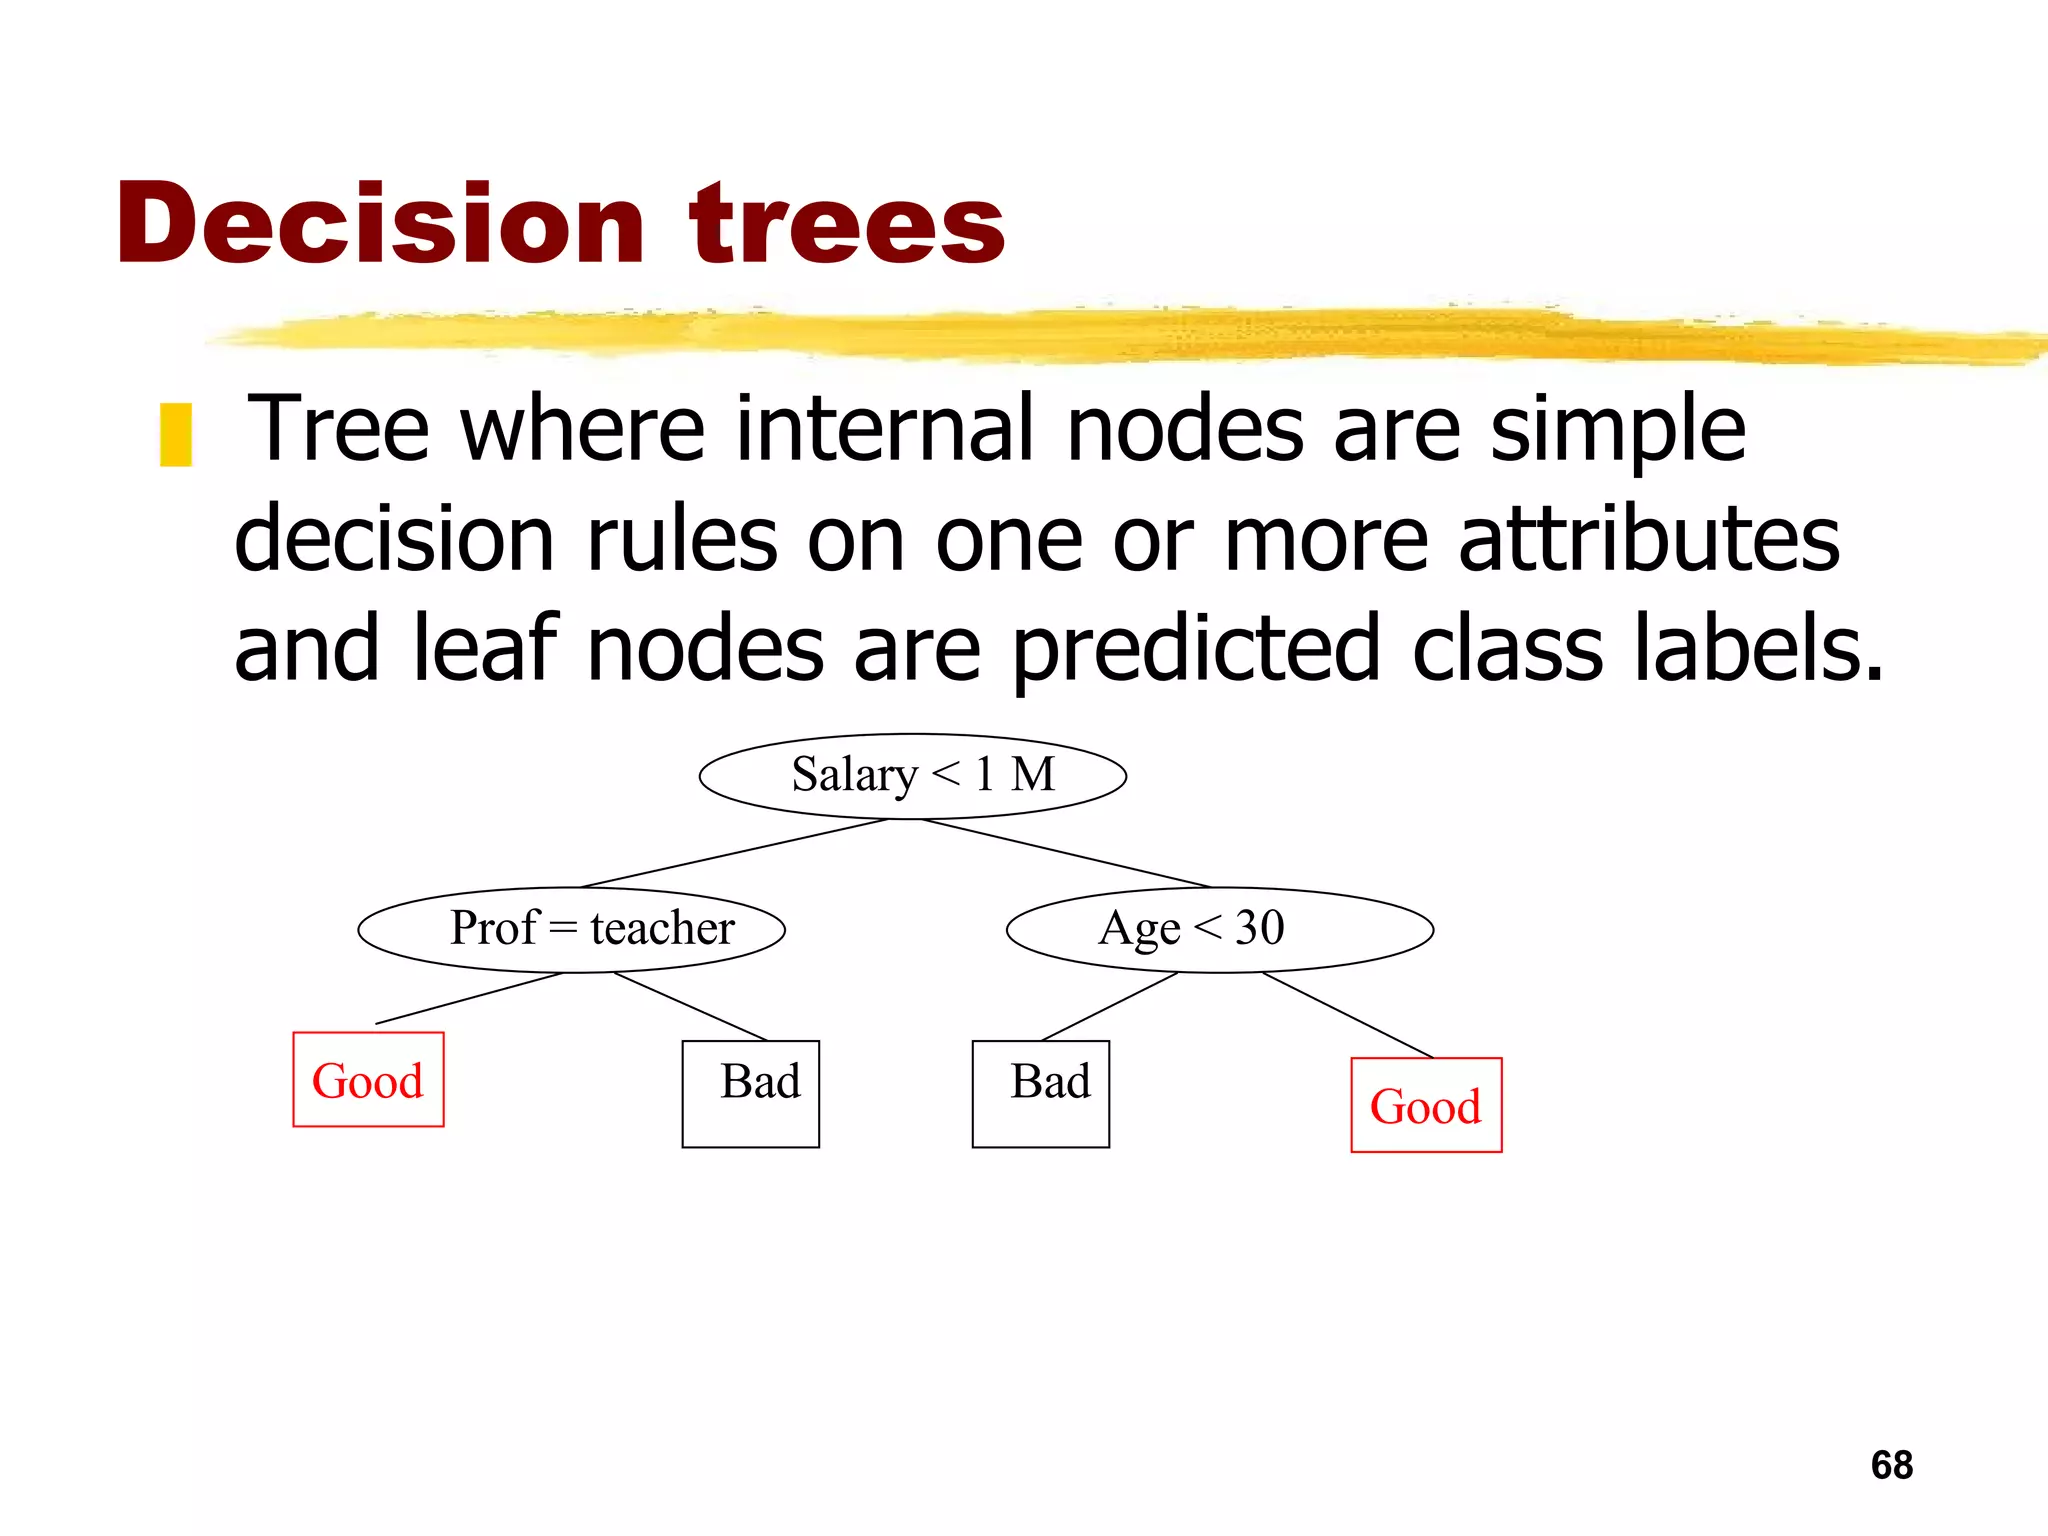

![State of art in mining OLAP integration Decision trees [ Information discovery, Cognos] find factors influencing high profits Clustering [Pilot software] segment customers to define hierarchy on that dimension Time series analysis: [Seagate’s Holos] Query for various shapes along time: eg. spikes, outliers etc Multi-level Associations [Han et al.] find association between members of dimensions](https://image.slidesharecdn.com/datawarehouse-overview-1207045152376001-4/75/Datawarehouse-Overview-84-2048.jpg)


![Vibe Coding vs. Spec-Driven Development [Free Meetup]](https://cdn.slidesharecdn.com/ss_thumbnails/vibecodingvsspecdrivendevelopment-251209105622-43f455e7-thumbnail.jpg?width=640&height=640&fit=bounds)


