Downloaded 150 times

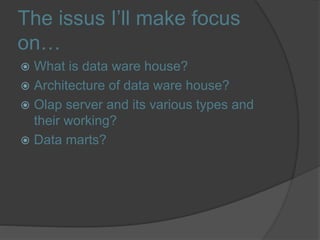
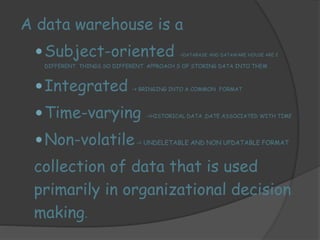
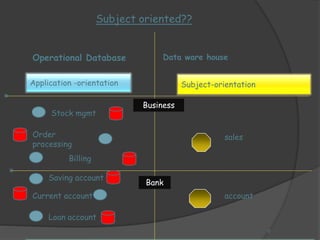
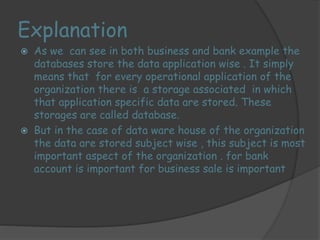
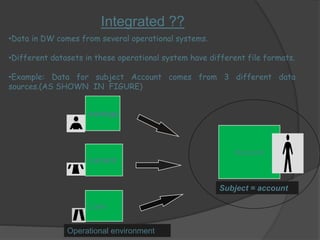
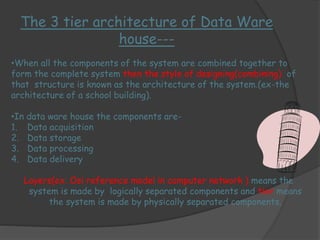
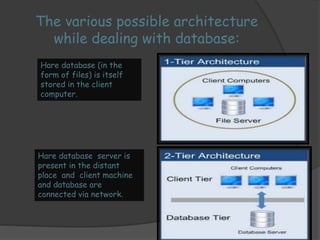
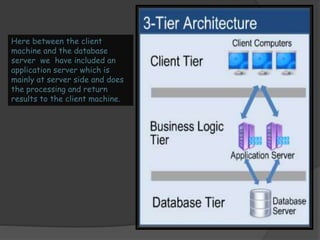
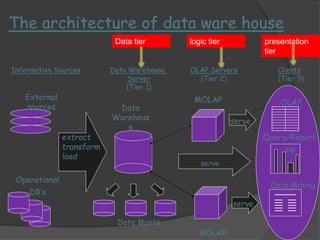
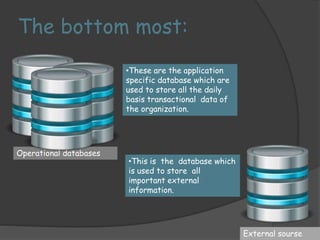
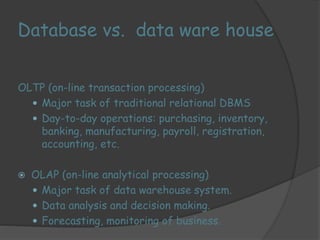

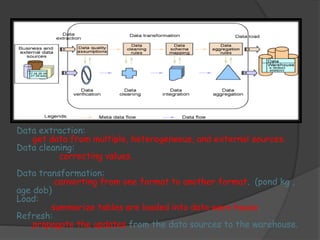
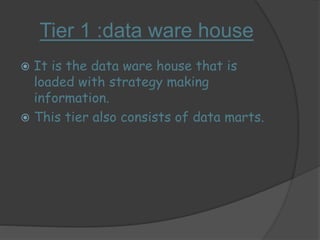
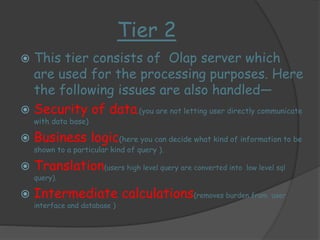
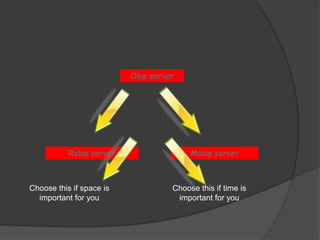

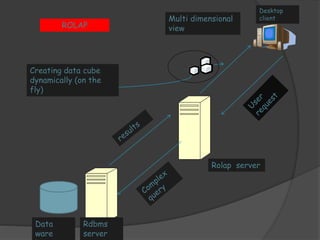

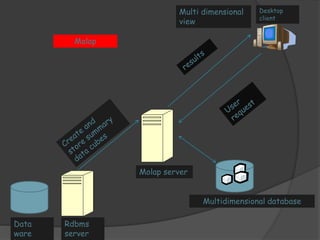
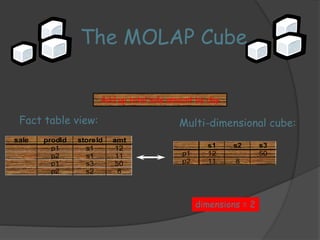
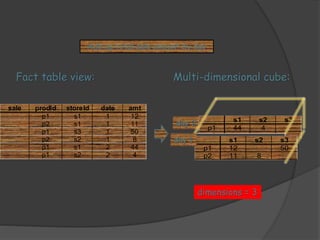
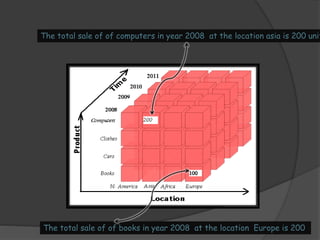
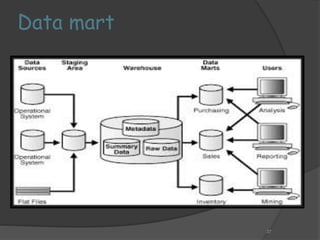
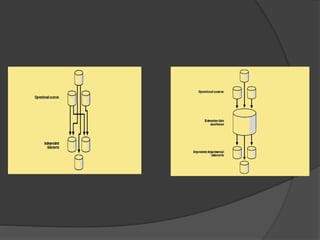


The document discusses data warehousing concepts including: 1) A data warehouse is a subject-oriented, integrated, and non-volatile collection of data used for decision making. It stores historical and current data from multiple sources. 2) The architecture of a data warehouse is typically three-tiered, with an operational data tier, data warehouse/data mart tier for storage, and client access tier. OLAP servers allow analysis of stored data. 3) ROLAP and MOLAP refer to relational and multidimensional approaches for OLAP. ROLAP dynamically generates data cubes from relational databases, while MOLAP pre-calculates and stores aggregated data in multidimensional structures.