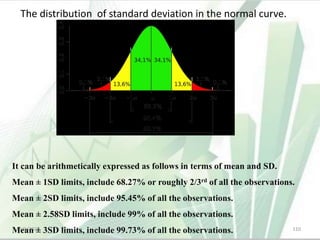
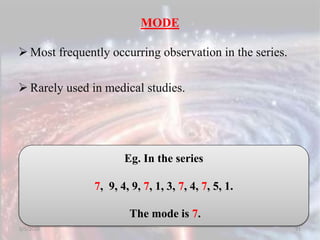
STATISTICS AND
BIOSTATISTICS
• MADE BY:
• Dr. KUMARI KALPANA
• PG-1st yr
• Department of Prosthodontics
5/5/2020 *
I . INTRODUCTION
III. HISTORY
IV. NEED TO STUDY BIOSTATISTICS
II. DEFINITION
V. SAMPLING
VI. METHODS OF PRESENTATION OF DATA
5/5/2020 2
VII. METHODS OF SUMMARIZING THE DATA
: Measures of Central Tendency
:Mode
: Measures of Dispersion
:Mean
:Median
:Range
:Standard deviation
:Mean deviation
:Coefficient of variation5/5/2020 3
VIII. CORRELATION & REGRESSION
IX. NORMAL DISTRIBUTION AND NORMAL
CURVE.
X. METHODS OF ANALYZING THE DATA
XI. SUMMARY & CONCLUSION
5/5/2020 4
INTRODUCTION1-3
1. Mahajan BK. Method in biostatistics for medical student & research workers. 6th ed. Noida:
jaypee brothers; 2005.
2. Peter S. Essential of public health dentistry.5th edition, arya medi publication:2013.
3. S Hiremath. Textbook of preventive and community dentistry. New delhi: Elsevier; 2007:482-
88.5/5/2020 5
It is said when you can measure
what you are speaking about and
express it in numbers , you know
something about it , but when you
cannot express it in numbers your
knowledge is of meagre and
unsatisfactory kind.
65/5/2020
Analysis and interpretation is done using biostatistics.
The word “statistics” comes from Italian word
‘statista’ meaning “statesman” or the German word
“statistik” which means a political state.2
5/5/2020 7
WHY BIOSTATISTICS ??
Have you ever
wondered from where
did signs of a disease or
the leading causes of
death become known?
Or which age group/
social class/
profession or place is
affected the most?
Or how the levels of
standard of health has
reached?
Or whether a
particular population
is rising, falling, ageing
or ailing???
85/5/2020
Medical science
requires precision
for its development
For precision, facts,
observations or
measurements have
to be expressed in
figures
The data after
collection are of no
use unless properly
sorted, presented,
compared, analysed
and interpreted
For such a study of
figures, one has to
apply certain
mathematical
techniques called
95/5/2020
DEFINITION2,3
2. Peter S. Essential of public health dentistry.5th edition, arya medi publication:2013.
3. S Hiremath. Textbook of preventive and community dentistry. New delhi: Elsevier; 2007:482-
88.5/5/2020 10
STASTICS is the science of compiling, classifying and
tabulating numerical data and expressing the results in a
mathematical or graphical form.
Peter S. Essential of public health dentistry.5th edition, arya medi publication:2013
5/5/2020 11
BIOSTATISTICS is that branch of statistics concerned with
the mathematical facts and data related to biological events.
5/5/2020 12
INCIDENCE: The number of new cases of a specific disease occurring in
a defined population during a specified period of time.
INCIDENCE = Number of new cases of a specific
disease during a given time period x 1000
The population at risk
PREVALENCE: The term ‘disease prevalence’ is used to indicate
all current cases (both old and new) existing in a given population
at a given point in time, or over a period of time.
5/5/2020 13
Variable - A characteristic that takes on different values
in different persons, places or things. Eg. Height,
weight, blood pressure, age etc. It is denoted as X.
Constant - The quantities that do not vary such as
π=3.143. In biostatistics, mean, standard deviation,
correlation coefficient & proportion of a particular
population are considered as constant.
S Hiremath. Textbook of preventive and community dentistry. New delhi: Elsevier;
2007:482- 88.
5/5/2020 14
Observation - An event and its measurements such as
blood pressure(event) and 120 mm of Hg(measurement).
Observational unit - The source that gives observations
such as object, person etc.
5/5/2020 15
Data - A set of values recorded on one or more
observational units.
Population – It is an entire group of people or study
elements- persons, things, or measurements for which we
have an interest at a particular time.
5/5/2020 16
Population
consists of fixed
no. - FINITE
Population
consisting of endless
succession -
INFINITE
5/5/2020 17
Parameter - It is a summary value or constant of a
variable that describes the population such as mean,
variance, correlation coefficient, proportion etc.
E.g. Mean height, birth rate, morbidity & mortality
rates, etc.
5/5/2020 18
USES AND APPLICATION OF
BIOSTATISTICS AS A
SCIENCE1
1. Mahajan BK. Method in biostatistics for medical student & research workers. 6th ed.
Noida: jaypee brothers; 2005.
5/5/2020 19
USES
5/5/2020 20
1. To test whether the difference between the two
population is real or a chance occurrence.
2. To study the correlation between attributes in the same
population.
3. To evaluate the efficacy of vaccines, sera etc.
4. To measure mortality and morbidity.
5/5/2020 21
4. To evaluate achievements of public health programs.
5. To fix priorities in public health programs.
6. To help promote health legislation and create
administrative standards for oral health.
5/5/2020 22
5/5/2020 23
1. In physiology and anatomy
To define what is normal/healthy in a population and
to find limits of normality in variables such as
weight and pulse rate.
To find a correlation between two variables X & Y
such as height & weight.
5/5/2020 24
To compare the action of two different
drugs or two successive dosages of the
same drug.
2. In pharmacology
5/5/2020 25
3. In medicine
To compare the efficacy of a particular drug,
operation or line of treatment-for this
percentage cured, relieved or died in the
experiment & control groups, is compared &
difference due to chance or otherwise is
found by applying statistical technique.
5/5/2020 26
4. In community medicine and public health
To test usefulness of sera and vaccines
in the field.
In epidemiological studies-the role of
causative factors is statistically tested.
5/5/2020 27
1.By learning the methods in biostatistics a student
learns to evaluate articles published in medical and
dental journals or papers read in medical and dental
conferences.
2.He also understands the basic methods of
observation in his clinical practice and research.
5. For students
5/5/2020 28
2. Peter S. Essential of public health dentistry.5th edition, arya medi publication:2013.
5/5/2020 29
The science of statistics is said to have developed from
registration of heads of families in ancient Egypt to the
Roman census on military strength, births and deaths,
etc. and found its application gradually in the field of
health and medicine.
John Graunt (1620-1674), who was neither a physician
nor a mathematician is considered the father of health
statistics.2
5/5/2020 30
5/5/2020 31
EPIDEMIOLOGICAL STUDIES
Before control of a disease it is mandatory to have a
clear picture of the amount of disease in the population.
This information should be available in terms of
mortality, morbidity, disability, and so on, and should be
preferably be available for different subgroups of the
population.
5/5/2020 32
• Measurement of mortality is straightforward.
• Morbidity has two aspects- incidence and
prevalence
• Incidence can be obtained from longitudinal
studies and prevalence from cross sectional
studies.
5/5/2020 33
• Descriptive epidemiology may use a cross
sectional or longitudinal design to obtain
estimates of magnitude of health and disease
problems in human population.
5/5/2020 34
5/5/2020 35
CLASSIFICATION OF
EPIDEMIOGICAL STUDIES
5/5/2020 36
SAMPLING
5/5/2020 37
Sampling unit - Each member of a population.
Sample – It may be defined as a part of a population,
generally selected so as to be representative of the
population whose variables are under study.
SAMPLING1,2,4
5/5/2020 38
A sample is a part of a population , called the
‘universe’, ‘reference’ or ‘parent’ population .
Sampling is the process or technique of selecting a
sample of appropriate characteristics and adequate
size.
5/5/2020 39
5/5/2020 40
 The determination of sample size is critical in planning
clinical research because sample size is usually the most
important factor determining the time and funding
necessary to perform the research.
 Statisticians are consulted to know the sample size
required.
5/5/2020 41
ADVANTAGES OF SAMPLING
1. It reduces the cost of the investigation, the time
required and the number of personnel involved.
2. It allows thorough investigation of the units of
observation.
3. It helps to provide adequate and in depth coverage
of the sample units.
5/5/2020 42
IDEAL REQUIREMENTS:
1. Efficiency
2. Representativeness
3. Measurability
4. Size
5. Coverage
6. Goal orientation
7. Feasibility
8. Economy and cost-efficiency
5/5/2020 43
SAMPLING
TWO BASIC TYPES
PURPOSIVE SELECTION:
RANDOM SELECTION:
5/5/2020 44
METHODS OF SAMPLING
SAMPLING
CONVENIENCEPURPOSIVE
SYSTEMATICSIMPLE
NON PROBABILITYPROBABILITY
STRATIFIED
QUOTA
5/5/2020 45
PROBABILITY
SAMPLING
5/5/2020
• It is recommended method of
sampling, the distinctive feature
of which is that each individual
unit is the total population has a
known probability of being
selected.
• They are of four types
46
A) Simple
random
sampling
5/5/2020
• In this each and every unit in
the population has an equal
chance of being included in the
sample.
• The selection of the unit is by
CHANCE only
47
To ensure randomness one may choose any one
of the following methods-
1. LOTTERY METHOD- in this the
population units are numbered on separate
slips of paper of identical size and shape.
When the population is large this method
is not used.
5/5/2020 48
2. TABLE OF RANDOM NUMBERS- The
table of random numbers consist of random
arrangements of digits from 0 to 9 in rows and
columns, arranged in a cunning manner to
eliminate personal selection.
• The selection is done either in a horizontal
or vertical direction.
5/5/2020 49
B) Systemic
sampling
5/5/2020
• A systemic sample is obtained
by selecting one unit at random
and then selecting additional
units at evenly spaced interval
till the sample of required size
has been got.
50
C) Stratified
sampling
5/5/2020
• Th population is divided into
subgroups or strata according
to certain common
characteristics.
• Then random or systemic
sampling is performed
independently in each stratum.
51
D) Cluster
sampling
5/5/2020
• This method is used when the
population forms natural
groups or clusters, such as
villages, wards blocks or
children of a school etc.
• Here simple random sampling
is selected not of individual
subjects but of groups or
clusters of individuals.
• SAMPLING UNIT- clusters
• SAMPLING FRAME- list of these
clusters
52
NON
PROBABILITY
SAMPLING
5/5/2020
• They are not truly
representatives and are
therefore less desirable than
probability samples.
• This is used in cases where a
researcher may not be able to
obtain random or stratified
sample or it may be too
expensive or when it may not
be necessary to generalise to a
larger population.
53
A) QUOTA
SAMPLING
5/5/2020
• The general composition of the
sample is decided in advance.
• The only requirement is that
the right number of people be
somehow found to fill these
quotas.
• This is done to insure the
inclusion of a particular
segment of the population.
54
B)
PURPOSIVE
SAMPLING
5/5/2020
It is a non- representative subset of
some larger population, and is
constructed to serve a very
specific need or purpose.
A subset of purposive sampling is
a snowball sample (chain referral
sampling)
So named because one picks up
the sample along the way
55
C)
COVENIENCE
SAMPLING
5/5/2020
• A convenience sample is a
matter of taking what you can
get.
• It is an accident sample.
• It is not randomly obtained.
• Volunteers would constitute a
convenience sample.
56
COLLECTION OF DATA2
5/5/2020 57
2. Peter S. Essential of public health dentistry.5th edition, arya medi publication:2013.
5/5/2020 58
DATA
COLLECTION
PRIMARY
SOURCE
SECONDARY
SOURCE
PRIMARY SOURCE
• The data is obtained by the investigator
himself.
• This is first hand information
5/5/2020 59
SECONDARY SOURCE
• The data already recorded is utilised to
serve the purpose of the objective of the
study
• Eg- the records of the dental opd.
5/5/2020 60
PRIMARY SOURCE
A) Direct personal interview- In this method, there is
face to face contact with the persons from whom the
information is to be obtained.
5/5/2020 61
PRIMARY SOURCE
B) Oral health examination –It is used when
information is needed on the oral health status.
It is conducted by dentists and dental auxillary
personnel.
5/5/2020 62
PRIMARY SOURCE
C) Questionnaire method–In this method a list of the
questions pertaining to the survey, known as
questionnaire is prepared and the various informants are
requested to supply the information either personally or
through post.
This method is easy to adopt when a wide geographic
area is to be covered.
5/5/2020 63
METHODS OF PRESENTATION
OF DATA1
5/5/2020 64
PRESENTATION OF DATA1
The main sources for collection of medical statistics
are:
 Experiments.
 Surveys.
 Records.
5/5/2020 65
STATISTICAL DATA
The statistical data obtained from various sources can be
divided into two broad categories:
Qualitative
Quantitative
5/5/2020 66
QUALITATIVE OR DISCRETE DATA
Examples: died or cured, males or females, treated or not treated, on
drug or on placebo, etc.
Only one variable i.e. the number of persons & not the characteristics.
Classified by counting the individuals having the same characteristic
or attribute and not by measurement.
5/5/2020 67
QUANTITATIVE OR CONTINUOUS DATA
The characteristic is measured either on an interval or on a ratio scale.
There are 2 variables- the characteristic (height) & the frequency, i.e., the
number of persons with the same characteristic & in the same range.
Has a magnitude.
Continuous in nature.
Example: Such as body temp 35 to 42oC
5/5/2020 68
DATA PRESENTATION SHOULD INCLUDE:
In a way that
 Concise without losing the details.
 Arouse interest in the reader.
 Simple & meaningful
 Need few words to explain
 Define the problem & suggest the solution too
 Become helpful in further analysis
5/5/2020 69
METHODS OF PRESENTATION1
There are two main methods of presenting frequencies
of a variable:
 Tabulation.
 Drawing.
TABULATION - these are devices for presenting data from
a mass of statistical data.
5/5/2020 70
FREQUENCY DISTRIBUTION TABLE – the information is
collected in large quantities and data is presented in the form of a
table.
 large number of observations are presented concisely.
 It records how frequently a characteristic or an event occurs in
persons of the same group.
5/5/2020 71
Frequency distribution drawings
Graphs Diagrams
5/5/2020 72
•Histogram.
•Frequency
polygon.
•Frequency curve.
•Line chart or
graph.
•Cumulative
frequency
diagram.
•Scatter or dot
diagram.
•Bar diagram.
•Pie or sector
diagram.
•Pictogram or
picture diagram.
•Map diagram or
spot map.
HISTOGRAM1,2
 It is a pictorial diagram of frequency
distribution .
 There is no space between the cells on a
histogram. Bar chart has space between the
cells.
 Variable characters of different groups are
indicated on the horizontal line (x-axis)
called abscissa while frequency i.e. number
of observations is marked on the vertical line
(y-axis) called ordinate.5/5/2020 73
FREQUENCY POLYGON2
 It is also a pictorial diagram of frequency distribution.
 To draw a frequency polygon, a point is marked over
the mid-point of the histogram blocks.
 Then these points are connected by straight lines.
5/5/2020 74
FREQUENCY CURVE1
 When the number of observations is very large & the group interval
is reduced, the frequency polygon tends to lose its angulation giving
place to a smooth curve known as frequency curve.
 This provides a continuous graph giving the relative frequency for
each value of an attribute.
5/5/2020 75
LINE CHART OR GRAPH
 It shows the trend of an event over a period of time rising,
falling or showing fluctuations such as of cancer deaths,
infant mortality rate, birth rate, death rate etc.
 Vertical axis may not start from zero.
5/5/2020 76
CUMULATIVE FREQUENCY DIAGRAM / OGIVE
 Cumulative frequency is the total number of persons in each
particular range from the lowest value of the characteristic
up to & including any higher group value.
5/5/2020 77
SCATTER OR DOT DIAGRAM2
It is a diagram which shows the relationship between two
variables. If the dots cluster around a straight line, it
shows a linear relationship.
5/5/2020 78
BAR DIAGRAM1
 Length of bar drawn (vertical or horizontal) - indicates the
frequency of a character.
 Bars may be drawn in ascending or descending order of
magnitude or in serial order of events.
5/5/2020 79
PIE OR SECTOR DIAGRAM2
 These are so called because the entire graph looks like
a pie and its component represents slices cut from a pie.
 The total angle at the centre of a circle is equal to
360◦ and it represents the total frequency.
 It is divided into different sectors corresponding to the
frequencies of the variables in the distribution.
 The segments are then shaded with different shades or colors.
5/5/2020 80
PICTURE DIAGRAM OR PICTOGRAM2
Small pictures or symbols
are used for presenting
data. They are especially
used for common man.
5/5/2020 81
MAP DIAGRAM
 These maps are prepared to show geographical
distribution of frequencies.
5/5/2020 82
METHODS OF
SUMMARIZING THE DATA
5/5/2020 83
MEASURES OF CENTRAL
TENDENCY – AVERAGES1,2
• It’s the central value around which the other value are
distributed.
• The main objective of measures of central
tendency is to condense the entire mass of data and to
facilitate comparison.
5/5/2020 84
A good measure of central tendency should satisfy the
following properties,
• It should be easy to understand and compute.
• It should be based on each and every item in the
series.
5/5/2020 85
• It should not be affected by extreme observation
either too small or large values ).
• It should have sampling stability, say 10, are picked
up from the same population, and the measure of
central tendency is calculated, they should not differ
from each other markedly.
5/5/2020 86
MEASURES OF CENTRAL
TENDENCY – AVERAGES1,2
5/5/2020 87
3 measures of central tendency:
1.MEAN
2. MEDIAN
3. MODE
MEAN
 This measure implies the arithmetic average or mean
which is obtained by summing up all the observations
and dividing the total by the number of observations.
 Most commonly used in statistical methods.
5/5/2020 88
Eg. Erythrocyte sedimentation rates of 7 subjects are
7,5,3,4,6,4,5.
Mean = (7+5+3+4+6+4+5 / 7)=34/7=4.85
MEDIAN
 The observations arranged in ascending or descending
order- middle observation is the median.
 It implies the mid-value of the series.
5/5/2020 89
E.g., ESRs of 7 subjects are arranged in ascending
order i.e. 3,4,4,5,5,6,7.
The 4th observation i.e. 5 is the median in this series.
Where should we use Median?
• Where there is an extreme range of observations, mean
value gives a distorted result, therefore, median is
preferred.
5/5/2020 90
MODE
 Most frequently occurring observation in the series.
 Rarely used in medical studies.
5/5/2020 91
Eg. In the series
7, 9, 4, 9, 7, 1, 3, 7, 4, 7, 5, 1.
The mode is 7.
PERCENTILES1
It measures other points in the range other than central value.
It divides total observation by a imaginary line into two
parts, expressed in percentages such as 10% and 90% or
25% and 75%, etc.
In all there are 99 percentile
Centile or percentile are values in a series of observation
arranged in ascending of magnitude which divide the
distribution into 100 equal parts.
5/5/2020 92
5/5/2020 93
5/5/2020 94
MEASURES OF VARIABILITY OF
INDIVIDUAL OBSERVATIONS
Range.
Mean deviation.
Standard deviation.
Coefficient of variation.
5/5/2020 95
MEASURES OF VARIABILITY
Measures of variability help to find how individual
observations are dispersed around the mean of a large series.
They may also be called measures of
Dispersions
Variation or
Scatter.
5/5/2020 96
RANGE 1,2
 It is the simplest method , defined as the difference
between the value of the largest item and the value of the
smallest item.
 This method gives no information about the values that
lie in between the extreme values.
 Though this measurement is simple to calculate, it is not
based on all the items and is subject to fluctuations of
considerable magnitude from sample to sample.
 E.g., Fasting blood sugar: 80-120 mg per 100 ml.
5/5/2020 97
MEAN DEVIATION
 It is the average of deviations from the arithmetic mean.
 Found by summing up the differences from the mean &
divide by the no. of observations.
 Formula: M.D.=Σ(x-x)/η
5/5/2020 98
STANDARD DEVIATION1
 It is a improvement over mean deviation as a measure
of dispersion.
 It is most frequently used measure of deviation in
statistical analyses.
 Denoted by the Greek letter sigma (σ).
 Formula:
S.D.= √variance= √Σ(x-x)2/η-1 or
= √[Σx2-(Σx)2/η]/n-1
5/5/2020 99
E.g.,
Find SD of ESR, found to be 3, 4, 5, 4, 2, 4, 5 & 3 in 8
normal individuals.
 Sum of observations or
ΣX=3+4+5+4+2+4+5+3=30
 Sum of squares of observations or
ΣX2=9+16+25+16+4+16+25+9= 120
variance(s2)= [ΣX2-(ΣX)2/n ]/n-1
= [120-(30)2/8]/8-1
= 120-112.5/7=7.5/7
s=7.5/7=√1.07=1.03
5/5/2020 100
COEFFICIENT OF VARIATION1
 It is a measure used to compare relative variability,
i.e., to compare the variability between 2
characteristics or groups.
 Coefficient of Variation (CV) = (SD/mean) × 100.
5/5/2020 101
EXAMPLE: in a series of boys, the mean systolic BP was
120mmHg & SD was 10.
In the same series mean height & SD were 160cm & 5
respectively.
Find which character shows greater variation?
CV of BP= (10/120)x100=8.3%
CV of height= (5/160)x100= 3.1%
Thus BP is found to be a more variable character than
height, 8.3/3.1=2.7 times.
CORRELATION AND
REGRESSION2,5
5/5/2020 102
CORRELATION AND REGRESSION2,5
5/5/2020 103
5/5/2020 104
 Correlation coefficient only measures the degree of
relationship between X and Y variables but does not
give an idea about the changes in which variable
results in the change of the other
 This is done in
5/5/2020 105
Interpretation of correlation coefficient
a) The correlation coefficient is zero when there is no
covariation between the two variables.
b) When there is complete relationship, the correlation
coefficient is +1 or -1.
c) A value near +1, indicates a positive correlation and a
value near -1, indicates a negative correlation.
5/5/2020 106
 Estimation or prediction of the unknown value of one variable
from the known value of the other variable.
 The variable used to predict variable of interest- independent
variable & variable predicted- dependent variable.
 E.g., pharmaceutical companies use regression for studying the
effect of new drugs on patients by way of experimentation.
5/5/2020 107
5. Beaglehole R, Bonita R, Kjellstrom T. Basic Epidemiology. 2004; ISBN:53-70.
NORMAL DISTRIBUTION AND NORMAL
CURVE
5/5/2020 108
NORMAL DISTRIBUTION AND
NORMAL CURVE1
 Histogram of the same frequency distribution of heights,
with large no. of observations & small class interval gives
a frequency curve which is symmetrical in nature. This is
called the normal curve.
 A distribution of this nature or shape is called normal or
Gaussian distribution. It is one of the standard
distributions.
5/5/2020 109
The distribution of standard deviation in the normal curve.
5/5/2020 110
It can be arithmetically expressed as follows in terms of mean and SD.
Mean ± 1SD limits, include 68.27% or roughly 2/3rd of all the observations.
Mean ± 2SD limits, include 95.45% of all the observations.
Mean ± 2.58SD limits, include 99% of all the observations.
Mean ± 3SD limits, include 99.73% of all the observations.
Bell shaped
It is
symmetrical
in
distribution.
Mean, mode
and median
coincide.
CHARACTERISTICS
5/5/2020 111
METHODS OF ANALYSING THE DATA1
5/5/2020 112
PROBABILITY (CHANCE)
Probability may be defined as the relative
frequency or probable chances of occurrence
with which an event is expected to occur on an
average, such as such as probability of getting 6
in one throw of dice.
It is usually expressed by the symbol ‘p’.
 It ranges from 0 to 1.
5/5/2020 113
Probability of an event happening in a sample is
denoted as ‘p’ and that of not happening is
denoted by the symbol ‘q’, then
q= 1-p or p+q=1
5/5/2020 114
P-VALUE & NULL HYPOTHESIS 6
 This is a probability value and its lies between 0 and 1.
 An event cannot occur if P=0 and it must occur if P=1.
 The P-value represents the probability of getting the observed
results (or more extreme results) if the null hypothesis is true.
 p < 0.05 means rejection of null hypothesis and the test is
significant.
 p < 0.01 test is very significant
 p > 0.05 test is not significant at all.
5/5/2020 115
6.Shenoy R, Priya H. Overview of Statistics used in Dentistry. Journal of Indian
Association of Public Health Dentistry. 2011;18:778-80
LAWS OF PROBABILITY
ADDITIONAL LAW
MULTIPLICATION LAW
BINOMIAL LAW OF
PROBALITY
DISTRIBUTION
PROBABILITY FROM
SHAPE OF NORMAL
CURVE
PROBABILITY OF
CALCULATED VALUES
FROM TABLES
5/5/2020 116
ADDITIONAL LAW
TOTAL PROBABILITY OF GETTING HEADS “OR” TAILS = ½ + ½
= 1 5/5/2020 117
MULTIPLICATION LAW
TOTAL PROBABILITY OF GETTING 4 IN FIRST THROW
“AND” 2 IN SECOND THROW= 1/6 X 1/6 = 1/365/5/2020 118
BINOMIAL LAW
X
½ x ½ = ¼
½ x ½ = ¼
½ x ½ = ¼
½ x ½ = ¼
5/5/2020 119
PROBABILITY FROM SHAPE OF NORMAL
DISTRIBUTION
5/5/2020 120
PROBABILITY OF CALCULATED VALUES
FROM TABLES
5/5/2020 121
TEST OF SIGNIFICANCE1,2
When different samples are drawn from the same
population, the estimate might differ.
This difference in the estimates is called sampling
variability.
 Tests of significance deals with techniques to know how
far the difference between the estimates of different
sample is due to sampling variation.
5/5/2020 122
TEST OF STATISTICAL HYPOTHESIS
To test the statistical hypothesis about the population
parameter or true value of universe, two hypothesis or
presumptions are made to draw:
Null hypothesis:
It is a hypothesis which reflects no change or no
difference, usually denoted by H0
.
5/5/2020 123
Alternative hypothesis:
Any alternative assumption to null hypothesis, usually
denoted by H1.
By this we shall adopt a procedure to choose between
null hypothesis and alternate hypothesis by applying
relevant statistical technique.
5/5/2020 124
To make minimum error in rejection or acceptance of
H0 , we divide the sampling distribution or the area
under the normal curve into two regions or zones.
1. A zone of acceptance
2. A zone of rejection
5/5/2020 125
5/5/2020 126
Two types of error while accepting or rejecting a null
hypothesis1:
Type I error : if null hypothesis is rejected when it is
actually true, falls in the acceptance zone.
Type II error : if null hypothesis is accepted when it is
actually false, falls in the rejection zone.
5/5/2020 127
THE TESTS OF SIGNIFICANCE CAN BE
BROADLY CLASSIFIED AS1
PARAMETRIC
TESTS
NON
PARAMETRIC
TESTS
5/5/2020 128
PARAMETRIC TESTS are those tests in which certain
assumptions are made
Data has specific distribution.
Constants are used
NON PARAMETRIC TESTS are those in which no
assumptions are made
 Data do not follow any specific distribution
No constant of a population is used.
5/5/2020 129
PARAMETRIC TESTS
t - test( paired or unpaired)
z – test
F - test
5/5/2020 130
NON PARAMETRIC TESTS
Mann Whitney test
Phi coefficient test
Fischer’s Exact test
Sign Test
Freidmans Test
5/5/2020 131
PARAMETRIC TEST
5/5/2020 132
When the sample size is small, ‘t’ test is used to test the
hypothesis.
Designed by W.S. Gossett whose pen name was ‘Student’
Hence, this test is also called ‘Student’s t-test’
t = ratio of observed difference between two means of small
samples to the standard error of difference in the same
STUDENT ‘T’TEST
5/5/2020 133
Criteria for applying ‘t’ test2 :
• Sample must be randomly selected
• Quantitative data
• Variable is assumed to follow a normal distribution
• Samples should be less than 30
5/5/2020 134
Unpaired ‘t’ test2
The test is applied to unpaired data of independent
observations made on individuals of two different or
separate groups or samples drawn from two populations,
to test if the difference between them is real or it can be
attributed to sampling variability
5/5/2020 135
Paired ‘t’ test
It is applied to paired data of independent observation
from one sample only when each individual gives a pair
of observation.
5/5/2020 136
Z-TEST
It used to test the significance of difference in means for
large samples ( >30)
Criteria :
Sample must be randomly selected
Data must be quantitative
Variable should follow a normal distribution
Sample larger than 30
5/5/2020 137
5/5/2020 138
It was developed by Karl Pearson
When the data is measured in terms of attributes or
qualities, and it is intended to test whether the difference in
the distribution of attributes in different groups is due to
sampling variation or not, the chi square test is applied
5/5/2020 139
CHI SQUARE TEST FOR QUALITATIVE DATA
For e.g., if there are 2 groups, one of which has received
dental hygiene instructions on caries in children and the
other without instruction; and if it is desired to test if the
number of new cavities is associated with the instructions :
X2 = ∑
Where ∑denotes summation
5/5/2020 140
Expected frequencies
(Observed frequencies – expected frequencies)2
OCCURENCE OF NEW CAVITIES
GROUP PRESENT ABSENT TOTAL
No. who received
instructions
10 40 50
No. who did not
receive instructions
32 8 40
TOTAL 42 48 90
Consider the example of instructions and new
cavities :
5/5/2020 141
To test whether there is an association between instructions
received in dental hygiene and the number of new cavities,
state the null hypothesis as ‘there is no association between
instructions received in dental hygiene and the no. of new
cavities’.
Then the x2 statistic is calculated as :
x2 = (O – E)2
O = observed frequency, E = Expected frequency
E
∑
5/5/2020 142
OCCURENCE OF NEW CAVITIES
GROUP PRESENT ABSENT TOTAL
No. who received
instructions
10 40 50
No. who did not
receive instructions
32 8 40
TOTAL 42 48 90
Proportion of people with caries = 42 / 90 = 0.47
Proportion of people without caries = 48 / 90 = 0.53
Among those who received instructions:
Expected number attacked = 50 x 0.47 = 23.5
Expected number not attacked = 50 x 0.53 = 26.5
Among those who did not received instructions:
Expected number attacked = 40 x 0.47 = 18.8
Expected number not attacked = 40 x 0.53 = 21.2
5/5/2020 143
Table of expected frequencies is as follows :
NUMBER OF NEW CAVITIES
GROUP ATTACKED NOT ATTACKED
No. who received
instructions
O= 10
E= 23.5
O-E=13.5
O=40
E=26.5
O-E=13.5
No. who did not
receive instructions
O=32
E=18.8
O-E=13.2
O=8
E=21.2
O-E=13.2
5/5/2020 144
Then, c2 = (13.5)2 + (13.5)2 + (13.2)2 + (13.2)2
= 7.76+ 6.88 + 9.27 + 8.22 = 32.13
Degree of Freedom = (r-1) x (c-1) = (2-1) x (2-1)
= 1x1 =1
23.5 26.5 18.8 21.2
5/5/2020 145
5/5/2020 146
• With 1 degree of freedom, the x2 value for a probability
of 0.05 is 3.84.
• Since the observed value 32 is much higher it is
concluded that null hypothesis is false.
• We conclude that there is an association between dental
hygiene instructions and the no. of new cavities
5/5/2020 147
ANOVA TESTS1
Analysis of variance test which is not confined to
comparing 2 samples but more than two samples
drawn from corresponding normal population.
5/5/2020 148
• One way ANOVA
Where only one factor will effect the result between
2 groups
• Two way ANOVA
Where we have 2 factors that affect the result or
outcome
• Multi way ANOVA
Three or more factors affect the result or outcomes
between groups
5/5/2020 149
Example : Role of occupation on causation of blood pressure
Take BP of randomly selected 10 officers, 10 clerks, 10
laboratory technicians and 10 attendants.
Find means and variances of BP of the 4 classed of employees
If occupation plays no role in the causation of BP, the groups
when compared among themselves will not differ significantly.
If occupation plays a significant role, the 4 means will differ
significantly.
To test this ANOVA test has to be applied
5/5/2020 150
Officers Clerks Lab Technicians Attendants
125 120 120 118
130 122 115 120
135 115 115 118
120 110 130 120
115 125 120 120
120 122 125 115
135 120 115 125
140 126 126 120
135 120 118 115
125 120 120 118
1285 1200 1206 1196
128.5 120.0 120.6 119.6
5/5/2020 151
∑X = 1285+1200+1206+1196 = 4887
Sum of squares of all the 40 observations
= 1252 + 1302 +……1152 = 598751
Total sum of squares = ∑ X 2 - ( ∑ X )2 / n =
598751- (4887)2 / 40 =
1681.78
5/5/2020 152
Occupation sum of squares
∑X = (1285)2 / 10 +(1200) 2 / 10 +(1206) 2 /
10 + (1196)2 / 10 - (4887) 2 / 40
= 538.48
Error sum of squares = Total sum of squares –
occupational sum of squares
= 1681.78 – 538.48 = 1143.30
5/5/2020 153
SQUARE OF
VARIANCE
df SUM OF
SQUARE
MEAN SUM F- ratio of
square
Between the
occupation
4-1 = 3 538.48/ 3 179.49 5.65
Occupation
Error
39-3 = 36 1143.30/ 36 31.76
Computed ‘ F’ ratio = 179.49 / 31.76 = 5.65
5/5/2020 154
5.65 > 2.86
Computed F ratio > Table F ratio
Therefore the mean BP of the 4 types of employees
differ significantly
5/5/2020 155
MANN-WHITNEY U TEST
It is a nonparametric test equal to that of t test.
All observation are divided in a study of two
samples :
Experimental and control group
5/5/2020 156
Samples are ranked numerically from the smallest to the
largest ,
without regard to whether the observations came from the
experimental group or from the control group.
Observation from the experimental group are identified , the
values of the ranks in this sample are summed, and the
average rank and the variance of those ranks are determined.
5/5/2020 157
Same process repeated for observation from the control group.
If the null hypothesis is true , the average ranks of the two
samples should be similar.
If the average rank of one sample is greater than other , then null
hypothesis is rejected.
5/5/2020 158
• When one or more of the expected counts in a 2x2 table is
small (i.e., <2), the chi-square test cannot be used.
• To calculate the exact probability of such a finding fisher exact
probability test is applied.
Disadvantage: Tedious to calculate unless the investigator
has calculator
FISHER EXACT PROBABILITY TEST
5/5/2020 159
5/5/2020 160
SCIENTIFIC METHOD
• It refers to a series of standardized procedures
used in research to increase the likelihood that
information gathered will be relevant, reliable
and unbiased.
• The steps in the scientific method are-
5/5/2020 161
1. Problem formulation- identification and
statement of a problem in need of a solution
or a question in need of an answer.
2. Hypothesis formulation-formulation of a
solution or answer to the question that is
observable, measurable and consistent with
what is already known in the field.
3. Data collection-collection of facts that can be
used to solve the problem, answer the
question or test the hypothesis.
5/5/2020 162
4. Analysis and interpretation- Analysis and
interpretation of the meaning off the data
collected.
5. Writing a report- The final step in the
scientific method whose purpose is to
communicate the findings of the research.
5/5/2020 163
These steps are cyclic and involve
inductive and deductive reasoning
WHAT IS INDUCTIVE REASONING ?
Inductive reasoning involves the observation of
facts and their organisation into a method of
explaining phenomena in the real world(theory)
5/5/2020 164
WHAT IS DEDUCTIVE REASONING ?
Deductive reasoning is to observe and verify the
conditions of a theory developed through
induction.
5/5/2020 165
PROBLEM FORMULATION
Ideal requirements of a researchable problem
• A problem must be significant to some aspect of oral
health care.
• If solved, it should contribute to oral health delievery
by leading to a new knowledge , confirming or
improving current practices.
5/5/2020 166
• The problem must be observable and capable
of measurement through known methods of
quantification.
• The problem must be of interest to researcher
who must be capable of accessing the
necessary resources for pproper cientific
investigation.
5/5/2020 167
HYPOTHEESIS FORMUALTION
• Hypothesis are carefully constructed
statements about a phenomenon in the
population. The hypothesis may have been
generated by deductive reasoning or based on
inductive reasoning from prior observations.
5/5/2020 168
WRITING A PROTOCOL
• A protocol is a document that explicitly states
the reasoning behind and structure of a
research project.
• It is a draft summary indicating why and how
the study will be undertaken.
5/5/2020 169
The preparation of a protocol is a most important stage
In the research process and is carried out for the
following reasons
1) it states the question you want to answer.
2)it encourages you to plan the project in detail, before you
start.
3) it allows you to see the total process of your project.
4) it acts as a guide for all personnel involved in the project.
5) it enables you to monitor the progress of the project.
5/5/2020 170
All protocols are divided into two main sections
The problem to be investigated.
Project title
 The research problem.
 Background (including the literature review)
 the aims
 The hypothesis
5/5/2020 171
 Method of investigation.
Plan of the investigation (including sample
size calculation and statistical methods).
Project milestones
Resources required.
Dissemination of the results.
5/5/2020 172
THE AIMS
• Aim is an overall statement of the reason for
undertaking the study
e.g. to determine the dental health of 12-year-old state
school children within a, b, c districts. The aims of the
project should be explicitly stated. These should be
confined to the intention of the project.
5/5/2020 173
THE OBJECTIVES
Objectives are the means to achieve the aim.
They must be
o Measurable
o Achievable
o Statements to achieve aimAppropriate to the
group under study
5/5/2020 174
THE DESIGN
• The selection of a research strategy is the core
of research design and the choice of strategy,
whether descriptive, analytical, experimental,
or a combination of these, depeby on a number
of considerations.
5/5/2020 175
The specific type of studies are as follows,
 Descriptive strategies ( observational hypothesis
generation rather than testing)
 Observational analytical strategies (hypothesis
testing)
 Experimental strategies
At this stage of the protocol the inclusion and exclusion
criteria can also be determined.
5/5/2020 176
THE PROCEDURE
• This will describe exactly what is going to be done with
the subjects, how the data will be collected, who will be
collecting the data, what is the duration of the study,
examiner training and calibration and the systematic
procedure of the examination.
• Details of consent/permission of appropriate authorities
and the conduct of pilot study should be included
5/5/2020 177
MATERIALS MEASUREMENT AND
APPRATUS
Describe the materials and the instruments to be
used in the study-
Instruments are tools by which data are collected. They
include-
• Questionnaire and interview schedules
• Medical examination
5/5/2020 178
• Laboratory tests
Screening procedures
When indices/ criteria are used, write the
criteria in full eg- if using WHO criteria for caries,
state all the details.
5/5/2020 179
SAMPLE SIZE CALCULATION
• Sampling is the process or technique of selecting a
sample of appropriate and manageable size fr the
study.
• If a sampling size is too small there is a considerable
risk that the study may not be sufficiently powrful to
detect a difference between the groups, if a true
difference exists.
• The study would therefore b worthless and a great
deal of effort will be wasted.
5/5/2020 180
STATISTICAL METHOD
• It is also essential that the statistical methods to be
used in the investigations are outlined in detail.
• It is not sufficient to merely state the names of the
tests to be used.
• The rationale for the choice of the statistical tests
should be described.
5/5/2020 181
RESOURES REQUIRED
• Finally a list of all the resources that are required too
successfully complete the investigation must be
made.
• If these resources have cost implications, the potential
cost of the investigation must be noted.
5/5/2020 182
5/5/2020 183
REFERENCES
1. Mahajan BK. Method in biostatistics for medical student & research workers.
6th ed. Noida: jaypee brothers; 2005.
2. Peter S. Essential of public health dentistry.5th edition, arya medi
publication:2013.
3. S Hiremath. Textbook of preventive and community dentistry. New delhi:
Elsevier; 2007:482-88.
4.Jekel FJ, Katz LD, Elmore GJ, Wild MGD. Epidemiology, Biostatistics &
Preventive Medicine. 3rd edition, Saunders Elsevier; 2007:139-220.
5/5/2020 184
5.Beaglehole R, Bonita R, Kjellstrom T. Basic Epidemiology. 2004;
ISBN:53-70.
6.Shenoy R, Priya H. Overview of Statistics used in Dentistry. Journal of
Indian Association of Public Health Dentistry. 2011;18:778-80
5/5/2020 185
5/5/2020 186

Biostatistics

  • 1.
    STATISTICS AND BIOSTATISTICS • MADEBY: • Dr. KUMARI KALPANA • PG-1st yr • Department of Prosthodontics 5/5/2020 *
  • 2.
    I . INTRODUCTION III.HISTORY IV. NEED TO STUDY BIOSTATISTICS II. DEFINITION V. SAMPLING VI. METHODS OF PRESENTATION OF DATA 5/5/2020 2
  • 3.
    VII. METHODS OFSUMMARIZING THE DATA : Measures of Central Tendency :Mode : Measures of Dispersion :Mean :Median :Range :Standard deviation :Mean deviation :Coefficient of variation5/5/2020 3
  • 4.
    VIII. CORRELATION &REGRESSION IX. NORMAL DISTRIBUTION AND NORMAL CURVE. X. METHODS OF ANALYZING THE DATA XI. SUMMARY & CONCLUSION 5/5/2020 4
  • 5.
    INTRODUCTION1-3 1. Mahajan BK.Method in biostatistics for medical student & research workers. 6th ed. Noida: jaypee brothers; 2005. 2. Peter S. Essential of public health dentistry.5th edition, arya medi publication:2013. 3. S Hiremath. Textbook of preventive and community dentistry. New delhi: Elsevier; 2007:482- 88.5/5/2020 5
  • 6.
    It is saidwhen you can measure what you are speaking about and express it in numbers , you know something about it , but when you cannot express it in numbers your knowledge is of meagre and unsatisfactory kind. 65/5/2020
  • 7.
    Analysis and interpretationis done using biostatistics. The word “statistics” comes from Italian word ‘statista’ meaning “statesman” or the German word “statistik” which means a political state.2 5/5/2020 7
  • 8.
    WHY BIOSTATISTICS ?? Haveyou ever wondered from where did signs of a disease or the leading causes of death become known? Or which age group/ social class/ profession or place is affected the most? Or how the levels of standard of health has reached? Or whether a particular population is rising, falling, ageing or ailing??? 85/5/2020
  • 9.
    Medical science requires precision forits development For precision, facts, observations or measurements have to be expressed in figures The data after collection are of no use unless properly sorted, presented, compared, analysed and interpreted For such a study of figures, one has to apply certain mathematical techniques called 95/5/2020
  • 10.
    DEFINITION2,3 2. Peter S.Essential of public health dentistry.5th edition, arya medi publication:2013. 3. S Hiremath. Textbook of preventive and community dentistry. New delhi: Elsevier; 2007:482- 88.5/5/2020 10
  • 11.
    STASTICS is thescience of compiling, classifying and tabulating numerical data and expressing the results in a mathematical or graphical form. Peter S. Essential of public health dentistry.5th edition, arya medi publication:2013 5/5/2020 11
  • 12.
    BIOSTATISTICS is thatbranch of statistics concerned with the mathematical facts and data related to biological events. 5/5/2020 12
  • 13.
    INCIDENCE: The numberof new cases of a specific disease occurring in a defined population during a specified period of time. INCIDENCE = Number of new cases of a specific disease during a given time period x 1000 The population at risk PREVALENCE: The term ‘disease prevalence’ is used to indicate all current cases (both old and new) existing in a given population at a given point in time, or over a period of time. 5/5/2020 13
  • 14.
    Variable - Acharacteristic that takes on different values in different persons, places or things. Eg. Height, weight, blood pressure, age etc. It is denoted as X. Constant - The quantities that do not vary such as π=3.143. In biostatistics, mean, standard deviation, correlation coefficient & proportion of a particular population are considered as constant. S Hiremath. Textbook of preventive and community dentistry. New delhi: Elsevier; 2007:482- 88. 5/5/2020 14
  • 15.
    Observation - Anevent and its measurements such as blood pressure(event) and 120 mm of Hg(measurement). Observational unit - The source that gives observations such as object, person etc. 5/5/2020 15
  • 16.
    Data - Aset of values recorded on one or more observational units. Population – It is an entire group of people or study elements- persons, things, or measurements for which we have an interest at a particular time. 5/5/2020 16
  • 17.
    Population consists of fixed no.- FINITE Population consisting of endless succession - INFINITE 5/5/2020 17
  • 18.
    Parameter - Itis a summary value or constant of a variable that describes the population such as mean, variance, correlation coefficient, proportion etc. E.g. Mean height, birth rate, morbidity & mortality rates, etc. 5/5/2020 18
  • 19.
    USES AND APPLICATIONOF BIOSTATISTICS AS A SCIENCE1 1. Mahajan BK. Method in biostatistics for medical student & research workers. 6th ed. Noida: jaypee brothers; 2005. 5/5/2020 19
  • 20.
  • 21.
    1. To testwhether the difference between the two population is real or a chance occurrence. 2. To study the correlation between attributes in the same population. 3. To evaluate the efficacy of vaccines, sera etc. 4. To measure mortality and morbidity. 5/5/2020 21
  • 22.
    4. To evaluateachievements of public health programs. 5. To fix priorities in public health programs. 6. To help promote health legislation and create administrative standards for oral health. 5/5/2020 22
  • 23.
  • 24.
    1. In physiologyand anatomy To define what is normal/healthy in a population and to find limits of normality in variables such as weight and pulse rate. To find a correlation between two variables X & Y such as height & weight. 5/5/2020 24
  • 25.
    To compare theaction of two different drugs or two successive dosages of the same drug. 2. In pharmacology 5/5/2020 25
  • 26.
    3. In medicine Tocompare the efficacy of a particular drug, operation or line of treatment-for this percentage cured, relieved or died in the experiment & control groups, is compared & difference due to chance or otherwise is found by applying statistical technique. 5/5/2020 26
  • 27.
    4. In communitymedicine and public health To test usefulness of sera and vaccines in the field. In epidemiological studies-the role of causative factors is statistically tested. 5/5/2020 27
  • 28.
    1.By learning themethods in biostatistics a student learns to evaluate articles published in medical and dental journals or papers read in medical and dental conferences. 2.He also understands the basic methods of observation in his clinical practice and research. 5. For students 5/5/2020 28
  • 29.
    2. Peter S.Essential of public health dentistry.5th edition, arya medi publication:2013. 5/5/2020 29
  • 30.
    The science ofstatistics is said to have developed from registration of heads of families in ancient Egypt to the Roman census on military strength, births and deaths, etc. and found its application gradually in the field of health and medicine. John Graunt (1620-1674), who was neither a physician nor a mathematician is considered the father of health statistics.2 5/5/2020 30
  • 31.
  • 32.
    EPIDEMIOLOGICAL STUDIES Before controlof a disease it is mandatory to have a clear picture of the amount of disease in the population. This information should be available in terms of mortality, morbidity, disability, and so on, and should be preferably be available for different subgroups of the population. 5/5/2020 32
  • 33.
    • Measurement ofmortality is straightforward. • Morbidity has two aspects- incidence and prevalence • Incidence can be obtained from longitudinal studies and prevalence from cross sectional studies. 5/5/2020 33
  • 34.
    • Descriptive epidemiologymay use a cross sectional or longitudinal design to obtain estimates of magnitude of health and disease problems in human population. 5/5/2020 34
  • 35.
  • 36.
  • 37.
  • 38.
    Sampling unit -Each member of a population. Sample – It may be defined as a part of a population, generally selected so as to be representative of the population whose variables are under study. SAMPLING1,2,4 5/5/2020 38
  • 39.
    A sample isa part of a population , called the ‘universe’, ‘reference’ or ‘parent’ population . Sampling is the process or technique of selecting a sample of appropriate characteristics and adequate size. 5/5/2020 39
  • 40.
  • 41.
     The determinationof sample size is critical in planning clinical research because sample size is usually the most important factor determining the time and funding necessary to perform the research.  Statisticians are consulted to know the sample size required. 5/5/2020 41
  • 42.
    ADVANTAGES OF SAMPLING 1.It reduces the cost of the investigation, the time required and the number of personnel involved. 2. It allows thorough investigation of the units of observation. 3. It helps to provide adequate and in depth coverage of the sample units. 5/5/2020 42
  • 43.
    IDEAL REQUIREMENTS: 1. Efficiency 2.Representativeness 3. Measurability 4. Size 5. Coverage 6. Goal orientation 7. Feasibility 8. Economy and cost-efficiency 5/5/2020 43
  • 44.
    SAMPLING TWO BASIC TYPES PURPOSIVESELECTION: RANDOM SELECTION: 5/5/2020 44
  • 45.
    METHODS OF SAMPLING SAMPLING CONVENIENCEPURPOSIVE SYSTEMATICSIMPLE NONPROBABILITYPROBABILITY STRATIFIED QUOTA 5/5/2020 45
  • 46.
    PROBABILITY SAMPLING 5/5/2020 • It isrecommended method of sampling, the distinctive feature of which is that each individual unit is the total population has a known probability of being selected. • They are of four types 46
  • 47.
    A) Simple random sampling 5/5/2020 • Inthis each and every unit in the population has an equal chance of being included in the sample. • The selection of the unit is by CHANCE only 47
  • 48.
    To ensure randomnessone may choose any one of the following methods- 1. LOTTERY METHOD- in this the population units are numbered on separate slips of paper of identical size and shape. When the population is large this method is not used. 5/5/2020 48
  • 49.
    2. TABLE OFRANDOM NUMBERS- The table of random numbers consist of random arrangements of digits from 0 to 9 in rows and columns, arranged in a cunning manner to eliminate personal selection. • The selection is done either in a horizontal or vertical direction. 5/5/2020 49
  • 50.
    B) Systemic sampling 5/5/2020 • Asystemic sample is obtained by selecting one unit at random and then selecting additional units at evenly spaced interval till the sample of required size has been got. 50
  • 51.
    C) Stratified sampling 5/5/2020 • Thpopulation is divided into subgroups or strata according to certain common characteristics. • Then random or systemic sampling is performed independently in each stratum. 51
  • 52.
    D) Cluster sampling 5/5/2020 • Thismethod is used when the population forms natural groups or clusters, such as villages, wards blocks or children of a school etc. • Here simple random sampling is selected not of individual subjects but of groups or clusters of individuals. • SAMPLING UNIT- clusters • SAMPLING FRAME- list of these clusters 52
  • 53.
    NON PROBABILITY SAMPLING 5/5/2020 • They arenot truly representatives and are therefore less desirable than probability samples. • This is used in cases where a researcher may not be able to obtain random or stratified sample or it may be too expensive or when it may not be necessary to generalise to a larger population. 53
  • 54.
    A) QUOTA SAMPLING 5/5/2020 • Thegeneral composition of the sample is decided in advance. • The only requirement is that the right number of people be somehow found to fill these quotas. • This is done to insure the inclusion of a particular segment of the population. 54
  • 55.
    B) PURPOSIVE SAMPLING 5/5/2020 It is anon- representative subset of some larger population, and is constructed to serve a very specific need or purpose. A subset of purposive sampling is a snowball sample (chain referral sampling) So named because one picks up the sample along the way 55
  • 56.
    C) COVENIENCE SAMPLING 5/5/2020 • A conveniencesample is a matter of taking what you can get. • It is an accident sample. • It is not randomly obtained. • Volunteers would constitute a convenience sample. 56
  • 57.
    COLLECTION OF DATA2 5/5/202057 2. Peter S. Essential of public health dentistry.5th edition, arya medi publication:2013.
  • 58.
  • 59.
    PRIMARY SOURCE • Thedata is obtained by the investigator himself. • This is first hand information 5/5/2020 59
  • 60.
    SECONDARY SOURCE • Thedata already recorded is utilised to serve the purpose of the objective of the study • Eg- the records of the dental opd. 5/5/2020 60
  • 61.
    PRIMARY SOURCE A) Directpersonal interview- In this method, there is face to face contact with the persons from whom the information is to be obtained. 5/5/2020 61
  • 62.
    PRIMARY SOURCE B) Oralhealth examination –It is used when information is needed on the oral health status. It is conducted by dentists and dental auxillary personnel. 5/5/2020 62
  • 63.
    PRIMARY SOURCE C) Questionnairemethod–In this method a list of the questions pertaining to the survey, known as questionnaire is prepared and the various informants are requested to supply the information either personally or through post. This method is easy to adopt when a wide geographic area is to be covered. 5/5/2020 63
  • 64.
    METHODS OF PRESENTATION OFDATA1 5/5/2020 64
  • 65.
    PRESENTATION OF DATA1 Themain sources for collection of medical statistics are:  Experiments.  Surveys.  Records. 5/5/2020 65
  • 66.
    STATISTICAL DATA The statisticaldata obtained from various sources can be divided into two broad categories: Qualitative Quantitative 5/5/2020 66
  • 67.
    QUALITATIVE OR DISCRETEDATA Examples: died or cured, males or females, treated or not treated, on drug or on placebo, etc. Only one variable i.e. the number of persons & not the characteristics. Classified by counting the individuals having the same characteristic or attribute and not by measurement. 5/5/2020 67
  • 68.
    QUANTITATIVE OR CONTINUOUSDATA The characteristic is measured either on an interval or on a ratio scale. There are 2 variables- the characteristic (height) & the frequency, i.e., the number of persons with the same characteristic & in the same range. Has a magnitude. Continuous in nature. Example: Such as body temp 35 to 42oC 5/5/2020 68
  • 69.
    DATA PRESENTATION SHOULDINCLUDE: In a way that  Concise without losing the details.  Arouse interest in the reader.  Simple & meaningful  Need few words to explain  Define the problem & suggest the solution too  Become helpful in further analysis 5/5/2020 69
  • 70.
    METHODS OF PRESENTATION1 Thereare two main methods of presenting frequencies of a variable:  Tabulation.  Drawing. TABULATION - these are devices for presenting data from a mass of statistical data. 5/5/2020 70
  • 71.
    FREQUENCY DISTRIBUTION TABLE– the information is collected in large quantities and data is presented in the form of a table.  large number of observations are presented concisely.  It records how frequently a characteristic or an event occurs in persons of the same group. 5/5/2020 71
  • 72.
    Frequency distribution drawings GraphsDiagrams 5/5/2020 72 •Histogram. •Frequency polygon. •Frequency curve. •Line chart or graph. •Cumulative frequency diagram. •Scatter or dot diagram. •Bar diagram. •Pie or sector diagram. •Pictogram or picture diagram. •Map diagram or spot map.
  • 73.
    HISTOGRAM1,2  It isa pictorial diagram of frequency distribution .  There is no space between the cells on a histogram. Bar chart has space between the cells.  Variable characters of different groups are indicated on the horizontal line (x-axis) called abscissa while frequency i.e. number of observations is marked on the vertical line (y-axis) called ordinate.5/5/2020 73
  • 74.
    FREQUENCY POLYGON2  Itis also a pictorial diagram of frequency distribution.  To draw a frequency polygon, a point is marked over the mid-point of the histogram blocks.  Then these points are connected by straight lines. 5/5/2020 74
  • 75.
    FREQUENCY CURVE1  Whenthe number of observations is very large & the group interval is reduced, the frequency polygon tends to lose its angulation giving place to a smooth curve known as frequency curve.  This provides a continuous graph giving the relative frequency for each value of an attribute. 5/5/2020 75
  • 76.
    LINE CHART ORGRAPH  It shows the trend of an event over a period of time rising, falling or showing fluctuations such as of cancer deaths, infant mortality rate, birth rate, death rate etc.  Vertical axis may not start from zero. 5/5/2020 76
  • 77.
    CUMULATIVE FREQUENCY DIAGRAM/ OGIVE  Cumulative frequency is the total number of persons in each particular range from the lowest value of the characteristic up to & including any higher group value. 5/5/2020 77
  • 78.
    SCATTER OR DOTDIAGRAM2 It is a diagram which shows the relationship between two variables. If the dots cluster around a straight line, it shows a linear relationship. 5/5/2020 78
  • 79.
    BAR DIAGRAM1  Lengthof bar drawn (vertical or horizontal) - indicates the frequency of a character.  Bars may be drawn in ascending or descending order of magnitude or in serial order of events. 5/5/2020 79
  • 80.
    PIE OR SECTORDIAGRAM2  These are so called because the entire graph looks like a pie and its component represents slices cut from a pie.  The total angle at the centre of a circle is equal to 360◦ and it represents the total frequency.  It is divided into different sectors corresponding to the frequencies of the variables in the distribution.  The segments are then shaded with different shades or colors. 5/5/2020 80
  • 81.
    PICTURE DIAGRAM ORPICTOGRAM2 Small pictures or symbols are used for presenting data. They are especially used for common man. 5/5/2020 81
  • 82.
    MAP DIAGRAM  Thesemaps are prepared to show geographical distribution of frequencies. 5/5/2020 82
  • 83.
  • 84.
    MEASURES OF CENTRAL TENDENCY– AVERAGES1,2 • It’s the central value around which the other value are distributed. • The main objective of measures of central tendency is to condense the entire mass of data and to facilitate comparison. 5/5/2020 84
  • 85.
    A good measureof central tendency should satisfy the following properties, • It should be easy to understand and compute. • It should be based on each and every item in the series. 5/5/2020 85
  • 86.
    • It shouldnot be affected by extreme observation either too small or large values ). • It should have sampling stability, say 10, are picked up from the same population, and the measure of central tendency is calculated, they should not differ from each other markedly. 5/5/2020 86
  • 87.
    MEASURES OF CENTRAL TENDENCY– AVERAGES1,2 5/5/2020 87 3 measures of central tendency: 1.MEAN 2. MEDIAN 3. MODE
  • 88.
    MEAN  This measureimplies the arithmetic average or mean which is obtained by summing up all the observations and dividing the total by the number of observations.  Most commonly used in statistical methods. 5/5/2020 88 Eg. Erythrocyte sedimentation rates of 7 subjects are 7,5,3,4,6,4,5. Mean = (7+5+3+4+6+4+5 / 7)=34/7=4.85
  • 89.
    MEDIAN  The observationsarranged in ascending or descending order- middle observation is the median.  It implies the mid-value of the series. 5/5/2020 89 E.g., ESRs of 7 subjects are arranged in ascending order i.e. 3,4,4,5,5,6,7. The 4th observation i.e. 5 is the median in this series.
  • 90.
    Where should weuse Median? • Where there is an extreme range of observations, mean value gives a distorted result, therefore, median is preferred. 5/5/2020 90
  • 91.
    MODE  Most frequentlyoccurring observation in the series.  Rarely used in medical studies. 5/5/2020 91 Eg. In the series 7, 9, 4, 9, 7, 1, 3, 7, 4, 7, 5, 1. The mode is 7.
  • 92.
    PERCENTILES1 It measures otherpoints in the range other than central value. It divides total observation by a imaginary line into two parts, expressed in percentages such as 10% and 90% or 25% and 75%, etc. In all there are 99 percentile Centile or percentile are values in a series of observation arranged in ascending of magnitude which divide the distribution into 100 equal parts. 5/5/2020 92
  • 93.
  • 94.
  • 95.
    MEASURES OF VARIABILITYOF INDIVIDUAL OBSERVATIONS Range. Mean deviation. Standard deviation. Coefficient of variation. 5/5/2020 95
  • 96.
    MEASURES OF VARIABILITY Measuresof variability help to find how individual observations are dispersed around the mean of a large series. They may also be called measures of Dispersions Variation or Scatter. 5/5/2020 96
  • 97.
    RANGE 1,2  Itis the simplest method , defined as the difference between the value of the largest item and the value of the smallest item.  This method gives no information about the values that lie in between the extreme values.  Though this measurement is simple to calculate, it is not based on all the items and is subject to fluctuations of considerable magnitude from sample to sample.  E.g., Fasting blood sugar: 80-120 mg per 100 ml. 5/5/2020 97
  • 98.
    MEAN DEVIATION  Itis the average of deviations from the arithmetic mean.  Found by summing up the differences from the mean & divide by the no. of observations.  Formula: M.D.=Σ(x-x)/η 5/5/2020 98
  • 99.
    STANDARD DEVIATION1  Itis a improvement over mean deviation as a measure of dispersion.  It is most frequently used measure of deviation in statistical analyses.  Denoted by the Greek letter sigma (σ).  Formula: S.D.= √variance= √Σ(x-x)2/η-1 or = √[Σx2-(Σx)2/η]/n-1 5/5/2020 99
  • 100.
    E.g., Find SD ofESR, found to be 3, 4, 5, 4, 2, 4, 5 & 3 in 8 normal individuals.  Sum of observations or ΣX=3+4+5+4+2+4+5+3=30  Sum of squares of observations or ΣX2=9+16+25+16+4+16+25+9= 120 variance(s2)= [ΣX2-(ΣX)2/n ]/n-1 = [120-(30)2/8]/8-1 = 120-112.5/7=7.5/7 s=7.5/7=√1.07=1.03 5/5/2020 100
  • 101.
    COEFFICIENT OF VARIATION1 It is a measure used to compare relative variability, i.e., to compare the variability between 2 characteristics or groups.  Coefficient of Variation (CV) = (SD/mean) × 100. 5/5/2020 101 EXAMPLE: in a series of boys, the mean systolic BP was 120mmHg & SD was 10. In the same series mean height & SD were 160cm & 5 respectively. Find which character shows greater variation? CV of BP= (10/120)x100=8.3% CV of height= (5/160)x100= 3.1% Thus BP is found to be a more variable character than height, 8.3/3.1=2.7 times.
  • 102.
  • 103.
  • 104.
  • 105.
     Correlation coefficientonly measures the degree of relationship between X and Y variables but does not give an idea about the changes in which variable results in the change of the other  This is done in 5/5/2020 105
  • 106.
    Interpretation of correlationcoefficient a) The correlation coefficient is zero when there is no covariation between the two variables. b) When there is complete relationship, the correlation coefficient is +1 or -1. c) A value near +1, indicates a positive correlation and a value near -1, indicates a negative correlation. 5/5/2020 106
  • 107.
     Estimation orprediction of the unknown value of one variable from the known value of the other variable.  The variable used to predict variable of interest- independent variable & variable predicted- dependent variable.  E.g., pharmaceutical companies use regression for studying the effect of new drugs on patients by way of experimentation. 5/5/2020 107 5. Beaglehole R, Bonita R, Kjellstrom T. Basic Epidemiology. 2004; ISBN:53-70.
  • 108.
    NORMAL DISTRIBUTION ANDNORMAL CURVE 5/5/2020 108
  • 109.
    NORMAL DISTRIBUTION AND NORMALCURVE1  Histogram of the same frequency distribution of heights, with large no. of observations & small class interval gives a frequency curve which is symmetrical in nature. This is called the normal curve.  A distribution of this nature or shape is called normal or Gaussian distribution. It is one of the standard distributions. 5/5/2020 109
  • 110.
    The distribution ofstandard deviation in the normal curve. 5/5/2020 110 It can be arithmetically expressed as follows in terms of mean and SD. Mean ± 1SD limits, include 68.27% or roughly 2/3rd of all the observations. Mean ± 2SD limits, include 95.45% of all the observations. Mean ± 2.58SD limits, include 99% of all the observations. Mean ± 3SD limits, include 99.73% of all the observations.
  • 111.
    Bell shaped It is symmetrical in distribution. Mean,mode and median coincide. CHARACTERISTICS 5/5/2020 111
  • 112.
    METHODS OF ANALYSINGTHE DATA1 5/5/2020 112
  • 113.
    PROBABILITY (CHANCE) Probability maybe defined as the relative frequency or probable chances of occurrence with which an event is expected to occur on an average, such as such as probability of getting 6 in one throw of dice. It is usually expressed by the symbol ‘p’.  It ranges from 0 to 1. 5/5/2020 113
  • 114.
    Probability of anevent happening in a sample is denoted as ‘p’ and that of not happening is denoted by the symbol ‘q’, then q= 1-p or p+q=1 5/5/2020 114
  • 115.
    P-VALUE & NULLHYPOTHESIS 6  This is a probability value and its lies between 0 and 1.  An event cannot occur if P=0 and it must occur if P=1.  The P-value represents the probability of getting the observed results (or more extreme results) if the null hypothesis is true.  p < 0.05 means rejection of null hypothesis and the test is significant.  p < 0.01 test is very significant  p > 0.05 test is not significant at all. 5/5/2020 115 6.Shenoy R, Priya H. Overview of Statistics used in Dentistry. Journal of Indian Association of Public Health Dentistry. 2011;18:778-80
  • 116.
    LAWS OF PROBABILITY ADDITIONALLAW MULTIPLICATION LAW BINOMIAL LAW OF PROBALITY DISTRIBUTION PROBABILITY FROM SHAPE OF NORMAL CURVE PROBABILITY OF CALCULATED VALUES FROM TABLES 5/5/2020 116
  • 117.
    ADDITIONAL LAW TOTAL PROBABILITYOF GETTING HEADS “OR” TAILS = ½ + ½ = 1 5/5/2020 117
  • 118.
    MULTIPLICATION LAW TOTAL PROBABILITYOF GETTING 4 IN FIRST THROW “AND” 2 IN SECOND THROW= 1/6 X 1/6 = 1/365/5/2020 118
  • 119.
    BINOMIAL LAW X ½ x½ = ¼ ½ x ½ = ¼ ½ x ½ = ¼ ½ x ½ = ¼ 5/5/2020 119
  • 120.
    PROBABILITY FROM SHAPEOF NORMAL DISTRIBUTION 5/5/2020 120
  • 121.
    PROBABILITY OF CALCULATEDVALUES FROM TABLES 5/5/2020 121
  • 122.
    TEST OF SIGNIFICANCE1,2 Whendifferent samples are drawn from the same population, the estimate might differ. This difference in the estimates is called sampling variability.  Tests of significance deals with techniques to know how far the difference between the estimates of different sample is due to sampling variation. 5/5/2020 122
  • 123.
    TEST OF STATISTICALHYPOTHESIS To test the statistical hypothesis about the population parameter or true value of universe, two hypothesis or presumptions are made to draw: Null hypothesis: It is a hypothesis which reflects no change or no difference, usually denoted by H0 . 5/5/2020 123
  • 124.
    Alternative hypothesis: Any alternativeassumption to null hypothesis, usually denoted by H1. By this we shall adopt a procedure to choose between null hypothesis and alternate hypothesis by applying relevant statistical technique. 5/5/2020 124
  • 125.
    To make minimumerror in rejection or acceptance of H0 , we divide the sampling distribution or the area under the normal curve into two regions or zones. 1. A zone of acceptance 2. A zone of rejection 5/5/2020 125
  • 126.
  • 127.
    Two types oferror while accepting or rejecting a null hypothesis1: Type I error : if null hypothesis is rejected when it is actually true, falls in the acceptance zone. Type II error : if null hypothesis is accepted when it is actually false, falls in the rejection zone. 5/5/2020 127
  • 128.
    THE TESTS OFSIGNIFICANCE CAN BE BROADLY CLASSIFIED AS1 PARAMETRIC TESTS NON PARAMETRIC TESTS 5/5/2020 128
  • 129.
    PARAMETRIC TESTS arethose tests in which certain assumptions are made Data has specific distribution. Constants are used NON PARAMETRIC TESTS are those in which no assumptions are made  Data do not follow any specific distribution No constant of a population is used. 5/5/2020 129
  • 130.
    PARAMETRIC TESTS t -test( paired or unpaired) z – test F - test 5/5/2020 130
  • 131.
    NON PARAMETRIC TESTS MannWhitney test Phi coefficient test Fischer’s Exact test Sign Test Freidmans Test 5/5/2020 131
  • 132.
  • 133.
    When the samplesize is small, ‘t’ test is used to test the hypothesis. Designed by W.S. Gossett whose pen name was ‘Student’ Hence, this test is also called ‘Student’s t-test’ t = ratio of observed difference between two means of small samples to the standard error of difference in the same STUDENT ‘T’TEST 5/5/2020 133
  • 134.
    Criteria for applying‘t’ test2 : • Sample must be randomly selected • Quantitative data • Variable is assumed to follow a normal distribution • Samples should be less than 30 5/5/2020 134
  • 135.
    Unpaired ‘t’ test2 Thetest is applied to unpaired data of independent observations made on individuals of two different or separate groups or samples drawn from two populations, to test if the difference between them is real or it can be attributed to sampling variability 5/5/2020 135
  • 136.
    Paired ‘t’ test Itis applied to paired data of independent observation from one sample only when each individual gives a pair of observation. 5/5/2020 136
  • 137.
    Z-TEST It used totest the significance of difference in means for large samples ( >30) Criteria : Sample must be randomly selected Data must be quantitative Variable should follow a normal distribution Sample larger than 30 5/5/2020 137
  • 138.
  • 139.
    It was developedby Karl Pearson When the data is measured in terms of attributes or qualities, and it is intended to test whether the difference in the distribution of attributes in different groups is due to sampling variation or not, the chi square test is applied 5/5/2020 139 CHI SQUARE TEST FOR QUALITATIVE DATA
  • 140.
    For e.g., ifthere are 2 groups, one of which has received dental hygiene instructions on caries in children and the other without instruction; and if it is desired to test if the number of new cavities is associated with the instructions : X2 = ∑ Where ∑denotes summation 5/5/2020 140 Expected frequencies (Observed frequencies – expected frequencies)2
  • 141.
    OCCURENCE OF NEWCAVITIES GROUP PRESENT ABSENT TOTAL No. who received instructions 10 40 50 No. who did not receive instructions 32 8 40 TOTAL 42 48 90 Consider the example of instructions and new cavities : 5/5/2020 141
  • 142.
    To test whetherthere is an association between instructions received in dental hygiene and the number of new cavities, state the null hypothesis as ‘there is no association between instructions received in dental hygiene and the no. of new cavities’. Then the x2 statistic is calculated as : x2 = (O – E)2 O = observed frequency, E = Expected frequency E ∑ 5/5/2020 142
  • 143.
    OCCURENCE OF NEWCAVITIES GROUP PRESENT ABSENT TOTAL No. who received instructions 10 40 50 No. who did not receive instructions 32 8 40 TOTAL 42 48 90 Proportion of people with caries = 42 / 90 = 0.47 Proportion of people without caries = 48 / 90 = 0.53 Among those who received instructions: Expected number attacked = 50 x 0.47 = 23.5 Expected number not attacked = 50 x 0.53 = 26.5 Among those who did not received instructions: Expected number attacked = 40 x 0.47 = 18.8 Expected number not attacked = 40 x 0.53 = 21.2 5/5/2020 143
  • 144.
    Table of expectedfrequencies is as follows : NUMBER OF NEW CAVITIES GROUP ATTACKED NOT ATTACKED No. who received instructions O= 10 E= 23.5 O-E=13.5 O=40 E=26.5 O-E=13.5 No. who did not receive instructions O=32 E=18.8 O-E=13.2 O=8 E=21.2 O-E=13.2 5/5/2020 144
  • 145.
    Then, c2 =(13.5)2 + (13.5)2 + (13.2)2 + (13.2)2 = 7.76+ 6.88 + 9.27 + 8.22 = 32.13 Degree of Freedom = (r-1) x (c-1) = (2-1) x (2-1) = 1x1 =1 23.5 26.5 18.8 21.2 5/5/2020 145
  • 146.
  • 147.
    • With 1degree of freedom, the x2 value for a probability of 0.05 is 3.84. • Since the observed value 32 is much higher it is concluded that null hypothesis is false. • We conclude that there is an association between dental hygiene instructions and the no. of new cavities 5/5/2020 147
  • 148.
    ANOVA TESTS1 Analysis ofvariance test which is not confined to comparing 2 samples but more than two samples drawn from corresponding normal population. 5/5/2020 148
  • 149.
    • One wayANOVA Where only one factor will effect the result between 2 groups • Two way ANOVA Where we have 2 factors that affect the result or outcome • Multi way ANOVA Three or more factors affect the result or outcomes between groups 5/5/2020 149
  • 150.
    Example : Roleof occupation on causation of blood pressure Take BP of randomly selected 10 officers, 10 clerks, 10 laboratory technicians and 10 attendants. Find means and variances of BP of the 4 classed of employees If occupation plays no role in the causation of BP, the groups when compared among themselves will not differ significantly. If occupation plays a significant role, the 4 means will differ significantly. To test this ANOVA test has to be applied 5/5/2020 150
  • 151.
    Officers Clerks LabTechnicians Attendants 125 120 120 118 130 122 115 120 135 115 115 118 120 110 130 120 115 125 120 120 120 122 125 115 135 120 115 125 140 126 126 120 135 120 118 115 125 120 120 118 1285 1200 1206 1196 128.5 120.0 120.6 119.6 5/5/2020 151
  • 152.
    ∑X = 1285+1200+1206+1196= 4887 Sum of squares of all the 40 observations = 1252 + 1302 +……1152 = 598751 Total sum of squares = ∑ X 2 - ( ∑ X )2 / n = 598751- (4887)2 / 40 = 1681.78 5/5/2020 152
  • 153.
    Occupation sum ofsquares ∑X = (1285)2 / 10 +(1200) 2 / 10 +(1206) 2 / 10 + (1196)2 / 10 - (4887) 2 / 40 = 538.48 Error sum of squares = Total sum of squares – occupational sum of squares = 1681.78 – 538.48 = 1143.30 5/5/2020 153
  • 154.
    SQUARE OF VARIANCE df SUMOF SQUARE MEAN SUM F- ratio of square Between the occupation 4-1 = 3 538.48/ 3 179.49 5.65 Occupation Error 39-3 = 36 1143.30/ 36 31.76 Computed ‘ F’ ratio = 179.49 / 31.76 = 5.65 5/5/2020 154
  • 155.
    5.65 > 2.86 ComputedF ratio > Table F ratio Therefore the mean BP of the 4 types of employees differ significantly 5/5/2020 155
  • 156.
    MANN-WHITNEY U TEST Itis a nonparametric test equal to that of t test. All observation are divided in a study of two samples : Experimental and control group 5/5/2020 156
  • 157.
    Samples are rankednumerically from the smallest to the largest , without regard to whether the observations came from the experimental group or from the control group. Observation from the experimental group are identified , the values of the ranks in this sample are summed, and the average rank and the variance of those ranks are determined. 5/5/2020 157
  • 158.
    Same process repeatedfor observation from the control group. If the null hypothesis is true , the average ranks of the two samples should be similar. If the average rank of one sample is greater than other , then null hypothesis is rejected. 5/5/2020 158
  • 159.
    • When oneor more of the expected counts in a 2x2 table is small (i.e., <2), the chi-square test cannot be used. • To calculate the exact probability of such a finding fisher exact probability test is applied. Disadvantage: Tedious to calculate unless the investigator has calculator FISHER EXACT PROBABILITY TEST 5/5/2020 159
  • 160.
  • 161.
    SCIENTIFIC METHOD • Itrefers to a series of standardized procedures used in research to increase the likelihood that information gathered will be relevant, reliable and unbiased. • The steps in the scientific method are- 5/5/2020 161
  • 162.
    1. Problem formulation-identification and statement of a problem in need of a solution or a question in need of an answer. 2. Hypothesis formulation-formulation of a solution or answer to the question that is observable, measurable and consistent with what is already known in the field. 3. Data collection-collection of facts that can be used to solve the problem, answer the question or test the hypothesis. 5/5/2020 162
  • 163.
    4. Analysis andinterpretation- Analysis and interpretation of the meaning off the data collected. 5. Writing a report- The final step in the scientific method whose purpose is to communicate the findings of the research. 5/5/2020 163 These steps are cyclic and involve inductive and deductive reasoning
  • 164.
    WHAT IS INDUCTIVEREASONING ? Inductive reasoning involves the observation of facts and their organisation into a method of explaining phenomena in the real world(theory) 5/5/2020 164
  • 165.
    WHAT IS DEDUCTIVEREASONING ? Deductive reasoning is to observe and verify the conditions of a theory developed through induction. 5/5/2020 165
  • 166.
    PROBLEM FORMULATION Ideal requirementsof a researchable problem • A problem must be significant to some aspect of oral health care. • If solved, it should contribute to oral health delievery by leading to a new knowledge , confirming or improving current practices. 5/5/2020 166
  • 167.
    • The problemmust be observable and capable of measurement through known methods of quantification. • The problem must be of interest to researcher who must be capable of accessing the necessary resources for pproper cientific investigation. 5/5/2020 167
  • 168.
    HYPOTHEESIS FORMUALTION • Hypothesisare carefully constructed statements about a phenomenon in the population. The hypothesis may have been generated by deductive reasoning or based on inductive reasoning from prior observations. 5/5/2020 168
  • 169.
    WRITING A PROTOCOL •A protocol is a document that explicitly states the reasoning behind and structure of a research project. • It is a draft summary indicating why and how the study will be undertaken. 5/5/2020 169
  • 170.
    The preparation ofa protocol is a most important stage In the research process and is carried out for the following reasons 1) it states the question you want to answer. 2)it encourages you to plan the project in detail, before you start. 3) it allows you to see the total process of your project. 4) it acts as a guide for all personnel involved in the project. 5) it enables you to monitor the progress of the project. 5/5/2020 170
  • 171.
    All protocols aredivided into two main sections The problem to be investigated. Project title  The research problem.  Background (including the literature review)  the aims  The hypothesis 5/5/2020 171
  • 172.
     Method ofinvestigation. Plan of the investigation (including sample size calculation and statistical methods). Project milestones Resources required. Dissemination of the results. 5/5/2020 172
  • 173.
    THE AIMS • Aimis an overall statement of the reason for undertaking the study e.g. to determine the dental health of 12-year-old state school children within a, b, c districts. The aims of the project should be explicitly stated. These should be confined to the intention of the project. 5/5/2020 173
  • 174.
    THE OBJECTIVES Objectives arethe means to achieve the aim. They must be o Measurable o Achievable o Statements to achieve aimAppropriate to the group under study 5/5/2020 174
  • 175.
    THE DESIGN • Theselection of a research strategy is the core of research design and the choice of strategy, whether descriptive, analytical, experimental, or a combination of these, depeby on a number of considerations. 5/5/2020 175
  • 176.
    The specific typeof studies are as follows,  Descriptive strategies ( observational hypothesis generation rather than testing)  Observational analytical strategies (hypothesis testing)  Experimental strategies At this stage of the protocol the inclusion and exclusion criteria can also be determined. 5/5/2020 176
  • 177.
    THE PROCEDURE • Thiswill describe exactly what is going to be done with the subjects, how the data will be collected, who will be collecting the data, what is the duration of the study, examiner training and calibration and the systematic procedure of the examination. • Details of consent/permission of appropriate authorities and the conduct of pilot study should be included 5/5/2020 177
  • 178.
    MATERIALS MEASUREMENT AND APPRATUS Describethe materials and the instruments to be used in the study- Instruments are tools by which data are collected. They include- • Questionnaire and interview schedules • Medical examination 5/5/2020 178
  • 179.
    • Laboratory tests Screeningprocedures When indices/ criteria are used, write the criteria in full eg- if using WHO criteria for caries, state all the details. 5/5/2020 179
  • 180.
    SAMPLE SIZE CALCULATION •Sampling is the process or technique of selecting a sample of appropriate and manageable size fr the study. • If a sampling size is too small there is a considerable risk that the study may not be sufficiently powrful to detect a difference between the groups, if a true difference exists. • The study would therefore b worthless and a great deal of effort will be wasted. 5/5/2020 180
  • 181.
    STATISTICAL METHOD • Itis also essential that the statistical methods to be used in the investigations are outlined in detail. • It is not sufficient to merely state the names of the tests to be used. • The rationale for the choice of the statistical tests should be described. 5/5/2020 181
  • 182.
    RESOURES REQUIRED • Finallya list of all the resources that are required too successfully complete the investigation must be made. • If these resources have cost implications, the potential cost of the investigation must be noted. 5/5/2020 182
  • 183.
  • 184.
    REFERENCES 1. Mahajan BK.Method in biostatistics for medical student & research workers. 6th ed. Noida: jaypee brothers; 2005. 2. Peter S. Essential of public health dentistry.5th edition, arya medi publication:2013. 3. S Hiremath. Textbook of preventive and community dentistry. New delhi: Elsevier; 2007:482-88. 4.Jekel FJ, Katz LD, Elmore GJ, Wild MGD. Epidemiology, Biostatistics & Preventive Medicine. 3rd edition, Saunders Elsevier; 2007:139-220. 5/5/2020 184
  • 185.
    5.Beaglehole R, BonitaR, Kjellstrom T. Basic Epidemiology. 2004; ISBN:53-70. 6.Shenoy R, Priya H. Overview of Statistics used in Dentistry. Journal of Indian Association of Public Health Dentistry. 2011;18:778-80 5/5/2020 185
  • 186.