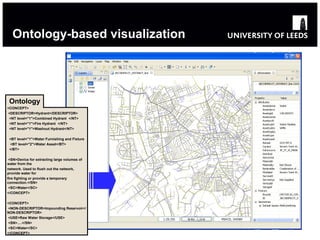
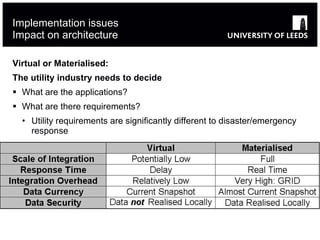
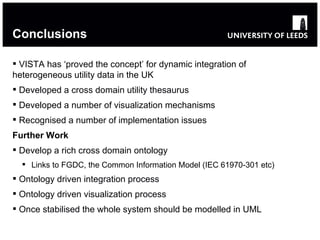
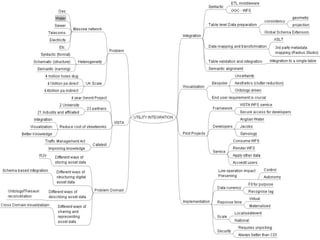
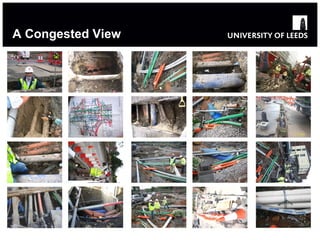
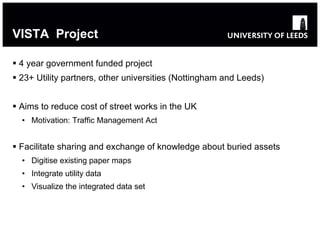
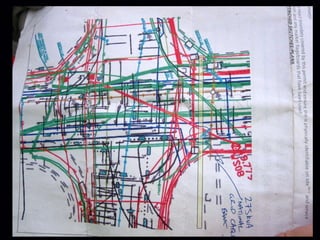
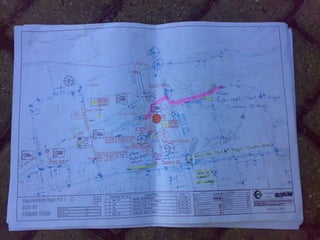
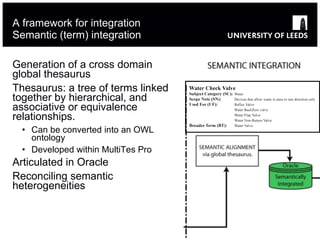
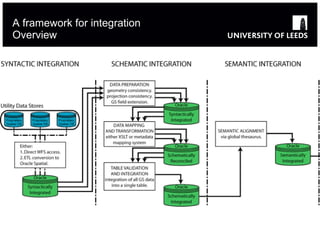
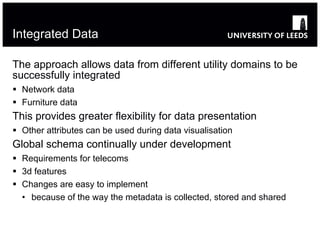
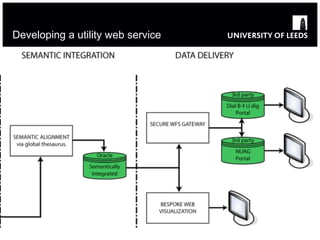
The VISTA project: Integrating UK utility data    Beck, Boukhelifa, Cohn, Fu & Parker
Overview
The Utility Underworld  Massive network of buried services: gas, water, electricity, telephone, cable, sewage, drains … Need to know asset location for planning and maintenance Many databases, varying accuracy and provenance Context ~4M street openings p.a. Direct costs of £1B p.a. Indirect costs of £3B-£5B p.a. Safety!
A Congested View
Overview Introduction - VISTA Utility Data Data Integration Data Delivery and Visualization Implementation Issues Conclusions
VISTA Consortium Visualising Integrated information on buried assets to reduce streetworks VISTA
VISTA  Project 4 year government funded project  23+ Utility partners, other universities (Nottingham and Leeds) Aims to reduce cost of street works in the UK Motivation: Traffic Management Act Facilitate sharing and exchange of knowledge about buried assets  Digitise existing paper maps Integrate utility data Visualize the integrated data set
The Vision (details) Tagline: Swift, safe, cost-effective streetworks Objectives for Leeds University Agree a core set of attributes Provide a framework for integrating and accessing this data  Investigate presentation needs for different classes of user Design appropriate presentation techniques
Overview Introduction - VISTA Utility Data Data Integration Data Delivery and Visualization Implementation Issues Conclusions
Utility Data Heterogeneous in nature Modern data is predominantly, but not exclusively, digital (GIS: vector)  Available in paper / raster / vector No common format or standard for data Captured over the past 200 years Variation in data quality Only 50% of buried infrastructure location known accurately (Marvin and Slater (1997)). Relative vs. Absolute positioning
The current picture
 
 
Current Practice Utility packs Combined service drawings are rare Reliance on Ordnance Survey backdrop for visual integration of asset information User preference for n+1 maps Users would like combined service drawings Preparation Manual process Informal design No standard format or symbology Vista aims to automate map production
Overview Introduction - VISTA Utility Data Data Integration Data Delivery and Visualization Implementation Issues Conclusions
Utility Data: Problem Domain Heterogeneous in Practice Different ways of storing asset data Paper – CAD – GIS Raster to Vector conversion Employed spatial grammar techniques through genetic algorithms Different ways of storing digital asset data Different syntactic models Global Schema based integration During prototype phase use ETL software (FME from Safe) Will recommend that OGC interoperable sources are implemented A mixed model is inevitable in the short term Different ways of structuring digital asset data Different syntactic and schematic models Integration based on a common utility data model (global schema)‏ Resolving schematic heterogeneity
Utility Data: Problem Domain Different ways of describing asset data Semantic inconsistency Ontology/Global Thesauri employed at the data level Resolving semantic heterogeneity When the same asset type is given different names by different companies When different asset types are given the same name by different companies Different ways of sharing and representing asset data Paper – CAD – GIS Different symbols and conventions Uncertainty User/domain tailored visualisations
Integration constraints Require low operational impact Organisations are unlikely to change their internal data model Organisations must retain full data autonomy
The Vision (details) Aim: Swift, safe, cost-effective streetworks Objectives Agree a core set of attributes Provide a framework for integrating and accessing this data  Investigate presentation needs for different classes of user Design appropriate presentation techniques
Agree a core set of attributes Currently 29 Global Schema fields grouped into 11 types Keep It Simple – flat file approach Semantically transparent field-names Distinguished between core and non-core data Asset  x 10 fields (5 core) Condition  x 1 field (0 core) Confidence  x 1 field (0 core) Date  x 1 field (0 core) Detection System  x 1 field (0 core) Dimension  x 5 fields (5 core) Domain  x 4 fields (2 core) GIS  x 2 fields (1 core) Location  x 3 fields (1 core) Rehabilitation work  x 1 field (0 core) Risk  x 1 field (0 core)
A framework for integration Overview
A framework for integration Syntactic (format) integration Essentially resolving the differences in GIS format between each utility dataset. Ideally will be done using a syntactically interoperable approach (OGC WFS).  Currently use FME middleware to convert the source data into the target format (ORACLE). This could be scripted to deal with data refreshing from different locations.  At implementation, there is likely to be a hybrid approach (middleware/WFS) in the short/medium term.
A framework for integration Schematic (structure) integration To generate the metadata that describes the relationship between the  source data  and the  global schema .  These may be direct 1-1 mappings or they could represent transformations: Scaling numerical data Calculated values (conversion of ‘depth of invert’ to ‘depth of cover’) Compound data needs splitting Atomised data needs compounding Furthermore, as utility data can be sparsely populated some error checking may be required.  Rule generation is a complex, iterative, process.
A framework for integration Schematic (structure) integration Metadata rules generated in RadiusStudio from 1Spatial  Simple user interface. Can do complex mapping and error checking. RadiusStudio is a web service.  We will be researching into techniques to deploy this metadata in XSLT. XSLT could be used to store all metadata natively.  However, is difficult to edit, design and share.  Domain knowledge is essential so the rules must be understood by the end-users.
 
A framework for integration Semantic (term) integration Generation of a cross domain global thesaurus Thesaurus: a tree of terms linked together by hierarchical, and associative or equivalence relationships. Can be converted into an OWL ontology Developed within MultiTes Pro  Articulated in Oracle Reconciling semantic heterogeneities
A framework for integration Overview
Integrated Data The approach allows data from different utility domains to be successfully integrated Network data Furniture data This provides greater flexibility for data presentation Other attributes can be used during data visualisation Global schema continually under development Requirements for telecoms 3d features Changes are easy to implement because of the way the metadata is collected, stored and shared
 
Overview Introduction - VISTA Utility Data Data Integration Data Delivery and Visualization Implementation Issues Conclusions
Developing a utility web service
Pilot Projects Infrastructure: Traditional Web GIS VISTA: ORACLE (datastore) Source utility data – materialized Schematically and semantically integrated VISTA: GeoServer (WFS delivery) Consumes data from Oracle Delivers OGC compliant WFS Via a secure link between Leeds and Developer servers Integrated data Materialized views of integrated data (faster delivery) Developer Service Consumes VISTA WFS Developer controls how the data is rendered Can be made fit for multiple different end-users (Planning, on site, etc.) Renders integrated data to ‘accredited’ users
Pilot Projects East Midlands x 2 Utilities: Anglian Water Central Networks National Grid Severn Trent United Utilities Yorkshire Water Portal Developer Jacobs Anglian Water Scotland Data partners Perth and Kinross Council Scottish Water Transport Scotland Portal Developer Symology
Bespoke Visualization
Bespoke utility visualization Uncertainty Visualization Include aspects of uncertainty onto the display Incorporating Aesthetics Reduce clutter and visual complexity Ontology-based Visualization Use utility ontology to drive the visualization End user requirements are crucial
Uncertainty visualization   EXAMPLES A. future environmental setting -> colour D. longitude /  magnitude -> glyphs B. contours -> line style H. local uncertainty -> volume C. regional uncertainty -> quadtree E. noise -> overlaid grid G. kind of object -> blur F. shape -> texture
Visualization Prototype USE OF BLUR  2D SVG map of utility Data Gas Sewer Water OS
Visualization Prototype USE OF BACKGROUND COLOUR Unified 3-colour scheme green : certain yellow : probable red : uncertain
Aesthetics and Clutter Close  proximity between assets Line  crossings and busy junctions Missing 3D information Label overlap Backdrop information
Aesthetics and Complexity Bends (b) Crosses (c) Angles (m) Orthogonality (o) Symmetry (s) [Purchase, 98]
Aesthetics – A graph example
Detect Detect cluttered areas
Then simplify
Aesthetics – Is it possible to improve this! Promote area of interest Declutter Graph the non-essential areas Retain context
Ontology Driven Visualization To be developed
Ontology-based visualization <CONCEPT> <DESCRIPTOR>Hydrant</DESCRIPTOR> <NT level=&quot;1&quot;>Combined Hydrant  </NT> <NT level=&quot;1&quot;>Fire Hydrant  </NT> <NT level=&quot;1&quot;>Washout Hydrant</NT> <BT level=&quot;1&quot;>Water Furnishing and Fixture <BT level=&quot;2&quot;>Water Asset</BT> </BT> <SN>Device for extracting large volumes of water from the network. Used to flush out the network, provide water for fire fighting or provide a temporary connection.</SN> <SC>Water</SC> </CONCEPT> <CONCEPT> <NON-DESCRIPTOR>Impounding Reservoir</NON-DESCRIPTOR> <USE>Raw Water Storage</USE> <SN>….</SN> <SC>Water</SC> </CONCEPT> Ontology
Overview Introduction - VISTA Utility Data Data Integration Data Delivery and Visualization Implementation Issues Conclusions
Implementation issues Operational Impact Require low operational impact Organisations are unlikely to change their internal data model Organisations must retain full data autonomy Changes, such as WFS, should have additional business benefits
Implementation issues Data Currency Data Currency Data currency should fit the purpose of the end use Back office planning Field requirements Recognise that there is always lag in the system
Implementation issues Other issues Other issues Response time Virtual vs. materialised Scale of integration Localised? National? Data Security Requires unpicking Always better than sharing data on CD!
Implementation issues Impact on architecture Virtual or Materialised:  The utility industry needs to decide What are the applications? What are there requirements? Utility requirements are significantly different to disaster/emergency response
Overview Introduction - VISTA Utility Data Data Integration Data Delivery and Visualization Implementation Issues Conclusions
Conclusions VISTA has ‘proved the concept’ for dynamic integration of heterogeneous utility data in the UK Developed a cross domain utility thesaurus Developed a number of visualization mechanisms Recognised a number of implementation issues  Further Work Develop a rich cross domain ontology Links to FGDC, the Common Information Model (IEC 61970-301 etc) Ontology driven integration process Ontology driven visualization process Once stabilised the whole system should be modelled in UML
Any Questions? www.mappingtheunderworld.ac.uk www.comp.leeds.ac.uk/mtu www.vistadtiproject.org e-mail: arb@comp.leeds.ac.uk

Integrating GIS utility data in the UK

  • 1.
    The VISTA project:Integrating UK utility data Beck, Boukhelifa, Cohn, Fu & Parker
  • 2.
  • 3.
    The Utility Underworld Massive network of buried services: gas, water, electricity, telephone, cable, sewage, drains … Need to know asset location for planning and maintenance Many databases, varying accuracy and provenance Context ~4M street openings p.a. Direct costs of £1B p.a. Indirect costs of £3B-£5B p.a. Safety!
  • 4.
  • 5.
    Overview Introduction -VISTA Utility Data Data Integration Data Delivery and Visualization Implementation Issues Conclusions
  • 6.
    VISTA Consortium VisualisingIntegrated information on buried assets to reduce streetworks VISTA
  • 7.
    VISTA Project4 year government funded project 23+ Utility partners, other universities (Nottingham and Leeds) Aims to reduce cost of street works in the UK Motivation: Traffic Management Act Facilitate sharing and exchange of knowledge about buried assets Digitise existing paper maps Integrate utility data Visualize the integrated data set
  • 8.
    The Vision (details)Tagline: Swift, safe, cost-effective streetworks Objectives for Leeds University Agree a core set of attributes Provide a framework for integrating and accessing this data Investigate presentation needs for different classes of user Design appropriate presentation techniques
  • 9.
    Overview Introduction -VISTA Utility Data Data Integration Data Delivery and Visualization Implementation Issues Conclusions
  • 10.
    Utility Data Heterogeneousin nature Modern data is predominantly, but not exclusively, digital (GIS: vector) Available in paper / raster / vector No common format or standard for data Captured over the past 200 years Variation in data quality Only 50% of buried infrastructure location known accurately (Marvin and Slater (1997)). Relative vs. Absolute positioning
  • 11.
  • 12.
  • 13.
  • 14.
    Current Practice Utilitypacks Combined service drawings are rare Reliance on Ordnance Survey backdrop for visual integration of asset information User preference for n+1 maps Users would like combined service drawings Preparation Manual process Informal design No standard format or symbology Vista aims to automate map production
  • 15.
    Overview Introduction -VISTA Utility Data Data Integration Data Delivery and Visualization Implementation Issues Conclusions
  • 16.
    Utility Data: ProblemDomain Heterogeneous in Practice Different ways of storing asset data Paper – CAD – GIS Raster to Vector conversion Employed spatial grammar techniques through genetic algorithms Different ways of storing digital asset data Different syntactic models Global Schema based integration During prototype phase use ETL software (FME from Safe) Will recommend that OGC interoperable sources are implemented A mixed model is inevitable in the short term Different ways of structuring digital asset data Different syntactic and schematic models Integration based on a common utility data model (global schema)‏ Resolving schematic heterogeneity
  • 17.
    Utility Data: ProblemDomain Different ways of describing asset data Semantic inconsistency Ontology/Global Thesauri employed at the data level Resolving semantic heterogeneity When the same asset type is given different names by different companies When different asset types are given the same name by different companies Different ways of sharing and representing asset data Paper – CAD – GIS Different symbols and conventions Uncertainty User/domain tailored visualisations
  • 18.
    Integration constraints Requirelow operational impact Organisations are unlikely to change their internal data model Organisations must retain full data autonomy
  • 19.
    The Vision (details)Aim: Swift, safe, cost-effective streetworks Objectives Agree a core set of attributes Provide a framework for integrating and accessing this data Investigate presentation needs for different classes of user Design appropriate presentation techniques
  • 20.
    Agree a coreset of attributes Currently 29 Global Schema fields grouped into 11 types Keep It Simple – flat file approach Semantically transparent field-names Distinguished between core and non-core data Asset x 10 fields (5 core) Condition x 1 field (0 core) Confidence x 1 field (0 core) Date x 1 field (0 core) Detection System x 1 field (0 core) Dimension x 5 fields (5 core) Domain x 4 fields (2 core) GIS x 2 fields (1 core) Location x 3 fields (1 core) Rehabilitation work x 1 field (0 core) Risk x 1 field (0 core)
  • 21.
    A framework forintegration Overview
  • 22.
    A framework forintegration Syntactic (format) integration Essentially resolving the differences in GIS format between each utility dataset. Ideally will be done using a syntactically interoperable approach (OGC WFS). Currently use FME middleware to convert the source data into the target format (ORACLE). This could be scripted to deal with data refreshing from different locations. At implementation, there is likely to be a hybrid approach (middleware/WFS) in the short/medium term.
  • 23.
    A framework forintegration Schematic (structure) integration To generate the metadata that describes the relationship between the source data and the global schema . These may be direct 1-1 mappings or they could represent transformations: Scaling numerical data Calculated values (conversion of ‘depth of invert’ to ‘depth of cover’) Compound data needs splitting Atomised data needs compounding Furthermore, as utility data can be sparsely populated some error checking may be required. Rule generation is a complex, iterative, process.
  • 24.
    A framework forintegration Schematic (structure) integration Metadata rules generated in RadiusStudio from 1Spatial Simple user interface. Can do complex mapping and error checking. RadiusStudio is a web service. We will be researching into techniques to deploy this metadata in XSLT. XSLT could be used to store all metadata natively. However, is difficult to edit, design and share. Domain knowledge is essential so the rules must be understood by the end-users.
  • 25.
  • 26.
    A framework forintegration Semantic (term) integration Generation of a cross domain global thesaurus Thesaurus: a tree of terms linked together by hierarchical, and associative or equivalence relationships. Can be converted into an OWL ontology Developed within MultiTes Pro Articulated in Oracle Reconciling semantic heterogeneities
  • 27.
    A framework forintegration Overview
  • 28.
    Integrated Data Theapproach allows data from different utility domains to be successfully integrated Network data Furniture data This provides greater flexibility for data presentation Other attributes can be used during data visualisation Global schema continually under development Requirements for telecoms 3d features Changes are easy to implement because of the way the metadata is collected, stored and shared
  • 29.
  • 30.
    Overview Introduction -VISTA Utility Data Data Integration Data Delivery and Visualization Implementation Issues Conclusions
  • 31.
  • 32.
    Pilot Projects Infrastructure:Traditional Web GIS VISTA: ORACLE (datastore) Source utility data – materialized Schematically and semantically integrated VISTA: GeoServer (WFS delivery) Consumes data from Oracle Delivers OGC compliant WFS Via a secure link between Leeds and Developer servers Integrated data Materialized views of integrated data (faster delivery) Developer Service Consumes VISTA WFS Developer controls how the data is rendered Can be made fit for multiple different end-users (Planning, on site, etc.) Renders integrated data to ‘accredited’ users
  • 33.
    Pilot Projects EastMidlands x 2 Utilities: Anglian Water Central Networks National Grid Severn Trent United Utilities Yorkshire Water Portal Developer Jacobs Anglian Water Scotland Data partners Perth and Kinross Council Scottish Water Transport Scotland Portal Developer Symology
  • 34.
  • 35.
    Bespoke utility visualizationUncertainty Visualization Include aspects of uncertainty onto the display Incorporating Aesthetics Reduce clutter and visual complexity Ontology-based Visualization Use utility ontology to drive the visualization End user requirements are crucial
  • 36.
    Uncertainty visualization EXAMPLES A. future environmental setting -> colour D. longitude / magnitude -> glyphs B. contours -> line style H. local uncertainty -> volume C. regional uncertainty -> quadtree E. noise -> overlaid grid G. kind of object -> blur F. shape -> texture
  • 37.
    Visualization Prototype USEOF BLUR 2D SVG map of utility Data Gas Sewer Water OS
  • 38.
    Visualization Prototype USEOF BACKGROUND COLOUR Unified 3-colour scheme green : certain yellow : probable red : uncertain
  • 39.
    Aesthetics and ClutterClose proximity between assets Line crossings and busy junctions Missing 3D information Label overlap Backdrop information
  • 40.
    Aesthetics and ComplexityBends (b) Crosses (c) Angles (m) Orthogonality (o) Symmetry (s) [Purchase, 98]
  • 41.
    Aesthetics – Agraph example
  • 42.
  • 43.
  • 44.
    Aesthetics – Isit possible to improve this! Promote area of interest Declutter Graph the non-essential areas Retain context
  • 45.
  • 46.
    Ontology-based visualization <CONCEPT><DESCRIPTOR>Hydrant</DESCRIPTOR> <NT level=&quot;1&quot;>Combined Hydrant </NT> <NT level=&quot;1&quot;>Fire Hydrant </NT> <NT level=&quot;1&quot;>Washout Hydrant</NT> <BT level=&quot;1&quot;>Water Furnishing and Fixture <BT level=&quot;2&quot;>Water Asset</BT> </BT> <SN>Device for extracting large volumes of water from the network. Used to flush out the network, provide water for fire fighting or provide a temporary connection.</SN> <SC>Water</SC> </CONCEPT> <CONCEPT> <NON-DESCRIPTOR>Impounding Reservoir</NON-DESCRIPTOR> <USE>Raw Water Storage</USE> <SN>….</SN> <SC>Water</SC> </CONCEPT> Ontology
  • 47.
    Overview Introduction -VISTA Utility Data Data Integration Data Delivery and Visualization Implementation Issues Conclusions
  • 48.
    Implementation issues OperationalImpact Require low operational impact Organisations are unlikely to change their internal data model Organisations must retain full data autonomy Changes, such as WFS, should have additional business benefits
  • 49.
    Implementation issues DataCurrency Data Currency Data currency should fit the purpose of the end use Back office planning Field requirements Recognise that there is always lag in the system
  • 50.
    Implementation issues Otherissues Other issues Response time Virtual vs. materialised Scale of integration Localised? National? Data Security Requires unpicking Always better than sharing data on CD!
  • 51.
    Implementation issues Impacton architecture Virtual or Materialised: The utility industry needs to decide What are the applications? What are there requirements? Utility requirements are significantly different to disaster/emergency response
  • 52.
    Overview Introduction -VISTA Utility Data Data Integration Data Delivery and Visualization Implementation Issues Conclusions
  • 53.
    Conclusions VISTA has‘proved the concept’ for dynamic integration of heterogeneous utility data in the UK Developed a cross domain utility thesaurus Developed a number of visualization mechanisms Recognised a number of implementation issues Further Work Develop a rich cross domain ontology Links to FGDC, the Common Information Model (IEC 61970-301 etc) Ontology driven integration process Ontology driven visualization process Once stabilised the whole system should be modelled in UML
  • 54.
    Any Questions? www.mappingtheunderworld.ac.ukwww.comp.leeds.ac.uk/mtu www.vistadtiproject.org e-mail: arb@comp.leeds.ac.uk

Editor's Notes

  • #4 This shows where assets are but in fact this should be where pipes might be.
  • #8 DTI has wide range of responsibilities: company law, trade, business growhth, innovation, employment law, energy, science, consumer law… in 2005 it was called the depth of productivity, energy and industry… TMA and level of accuracy