Download as PDF, PPTX

![Intelligent tutoring for skills mastery (CMU)
http://oli.cmu.edu
Lovett M, Meyer O and Thille C. (2008) The Open Learning Initiative: Measuring the effectiveness of the OLI statistics course in accelerating student
learning. Journal of Interactive Media in Education 14. http://jime.open.ac.uk/article/2008-14/352
“In this study, results showed
that OLI-Statistics students
[blended learning] learned a full
semester’s worth of material in
half as much time and
performed as well or better than
students learning from
traditional instruction over a full
semester.”](https://image.slidesharecdn.com/deri-learninganalytics-sbs-131003031128-phpapp02/75/insight-centre-galway-learning-analytics-47-2048.jpg)
![“We’re looking at the profiles of
what it means to be effective in the
21st century. […] Resilience will
be the defining concept. When
challenged and bent, you learn and
bounce back stronger.”
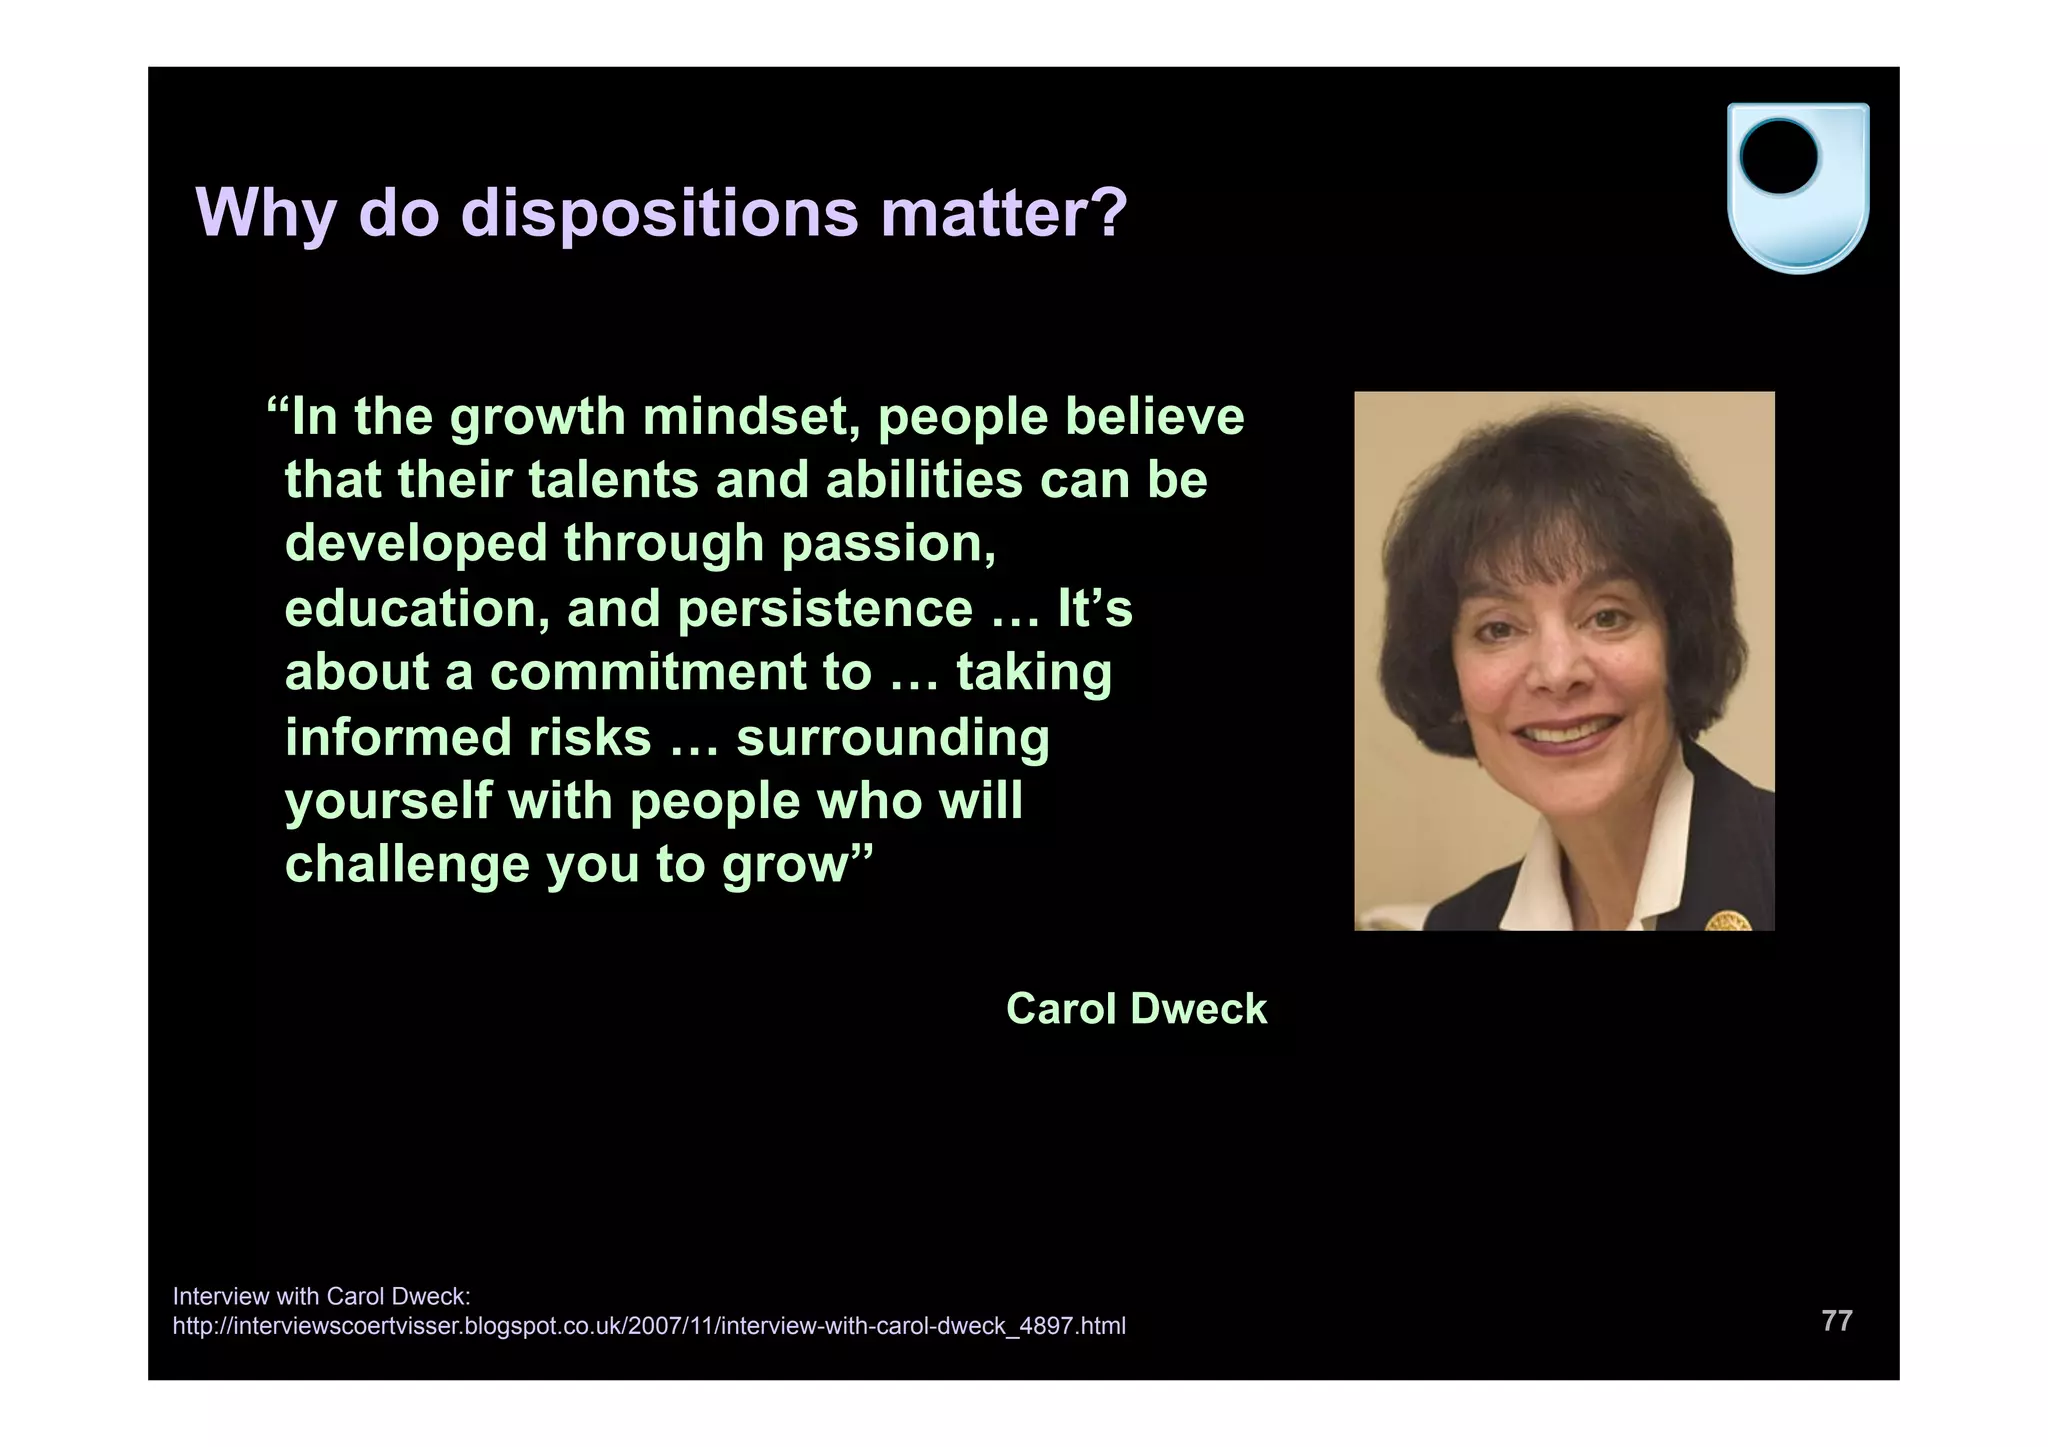
“Dispositions are now at least as
important as Knowledge and
Skills. …They cannot be taught.
They can only be cultivated.”
John Seely Brown
78
http://reimaginingeducation.org conference (May 28, 2013)
Dispositions clip: http://www.c-spanvideo.org/clip/4457327
Whole talk: http://www.c-spanvideo.org/program/SecD
Why do dispositions matter?](https://image.slidesharecdn.com/deri-learninganalytics-sbs-131003031128-phpapp02/75/insight-centre-galway-learning-analytics-78-2048.jpg)


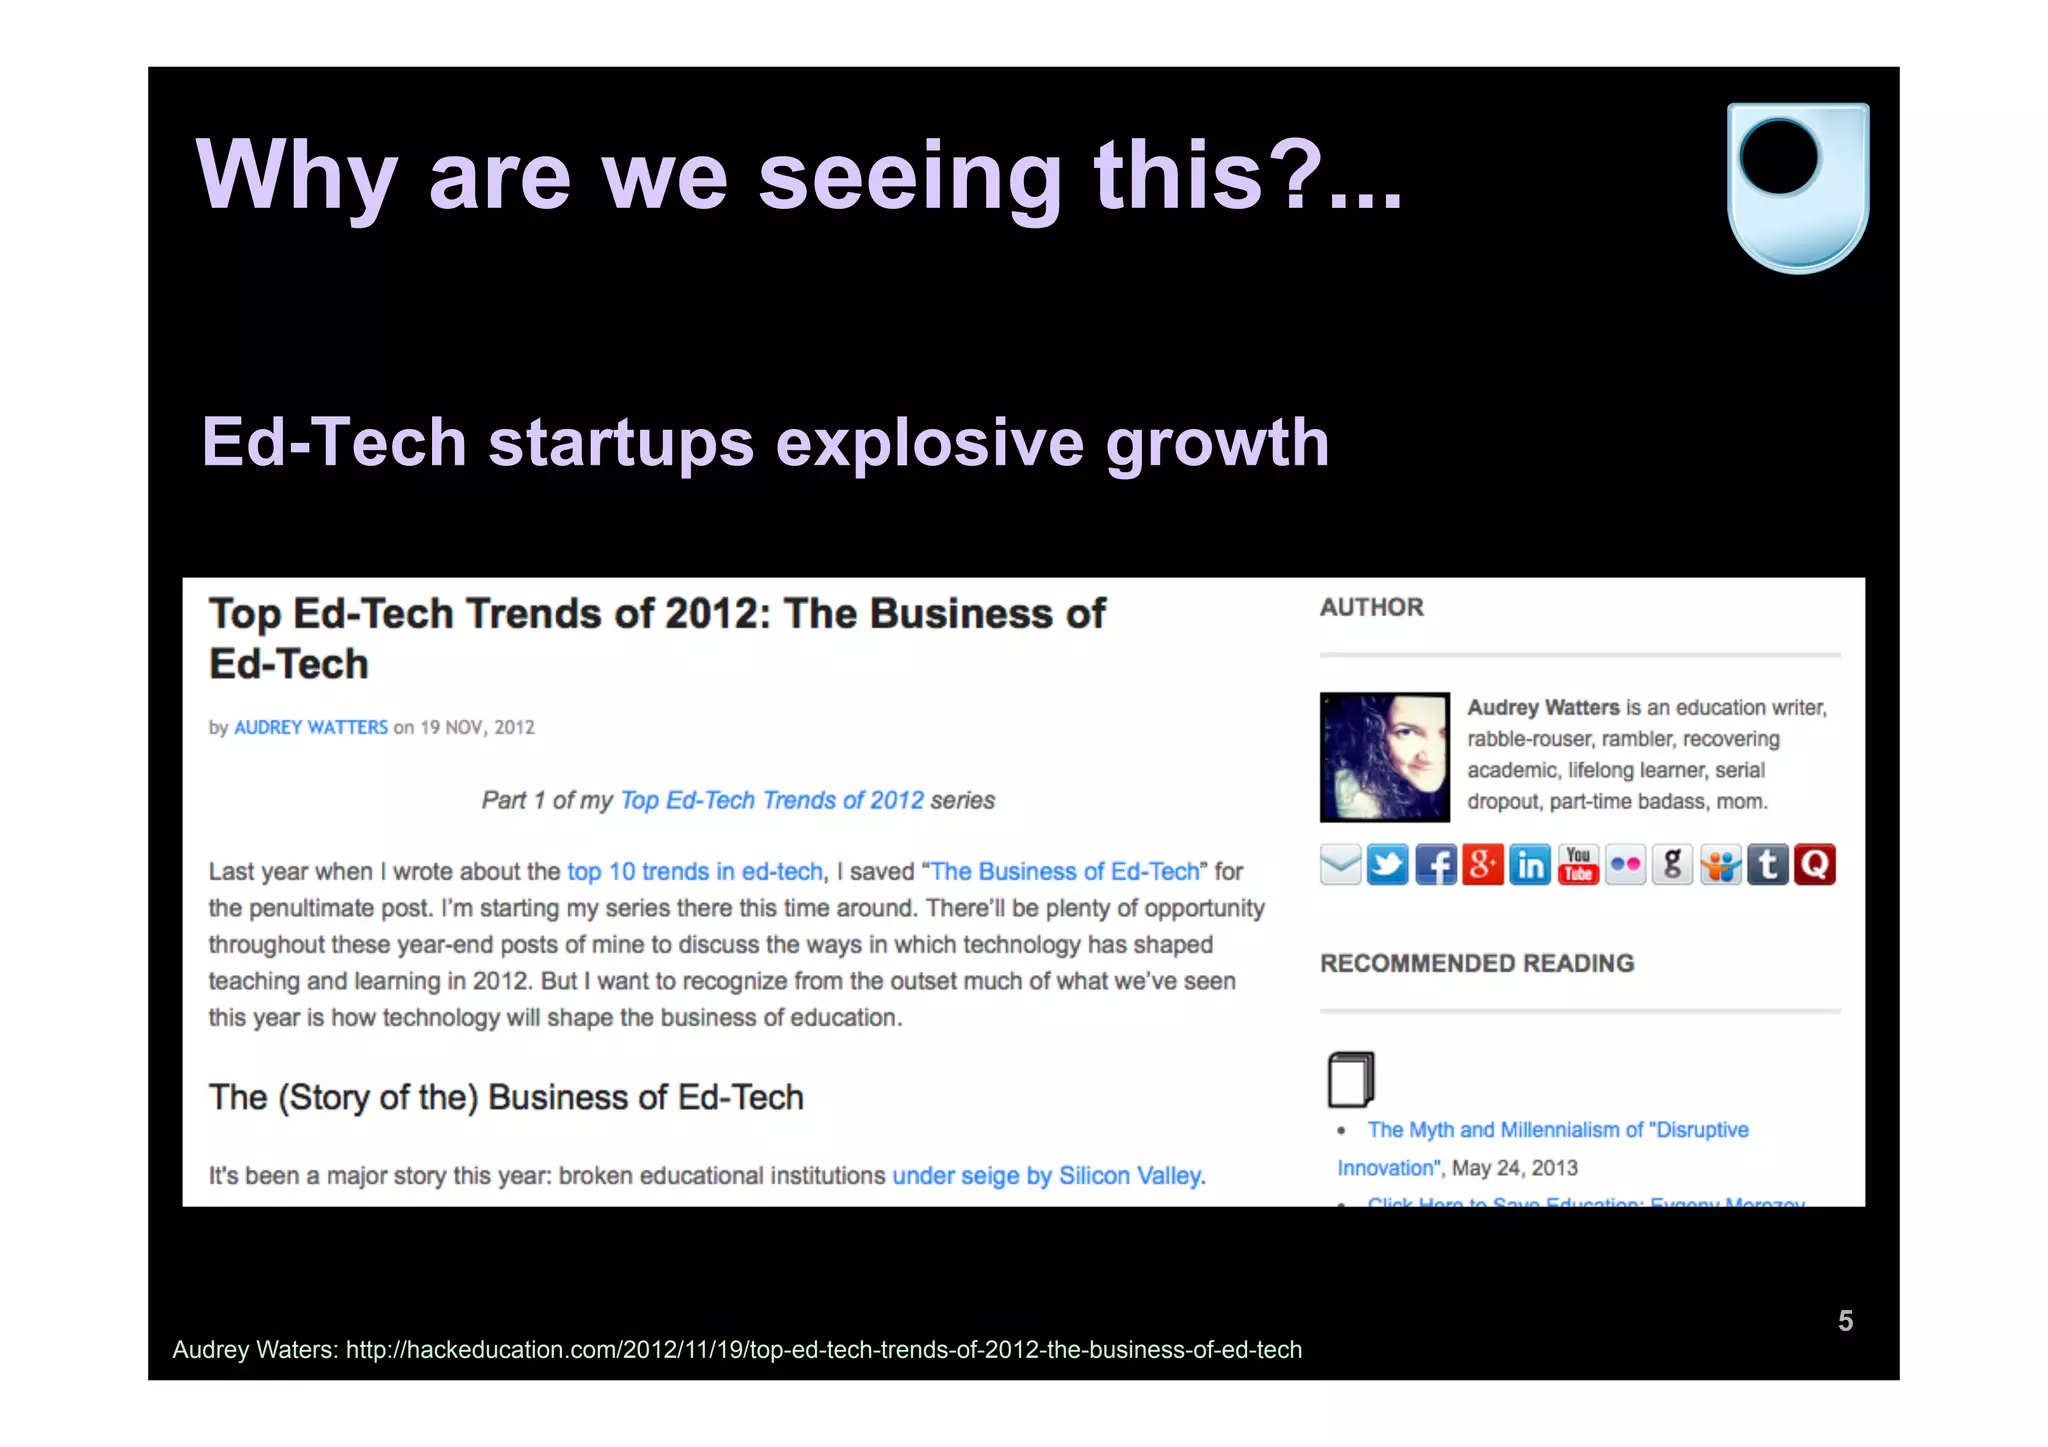
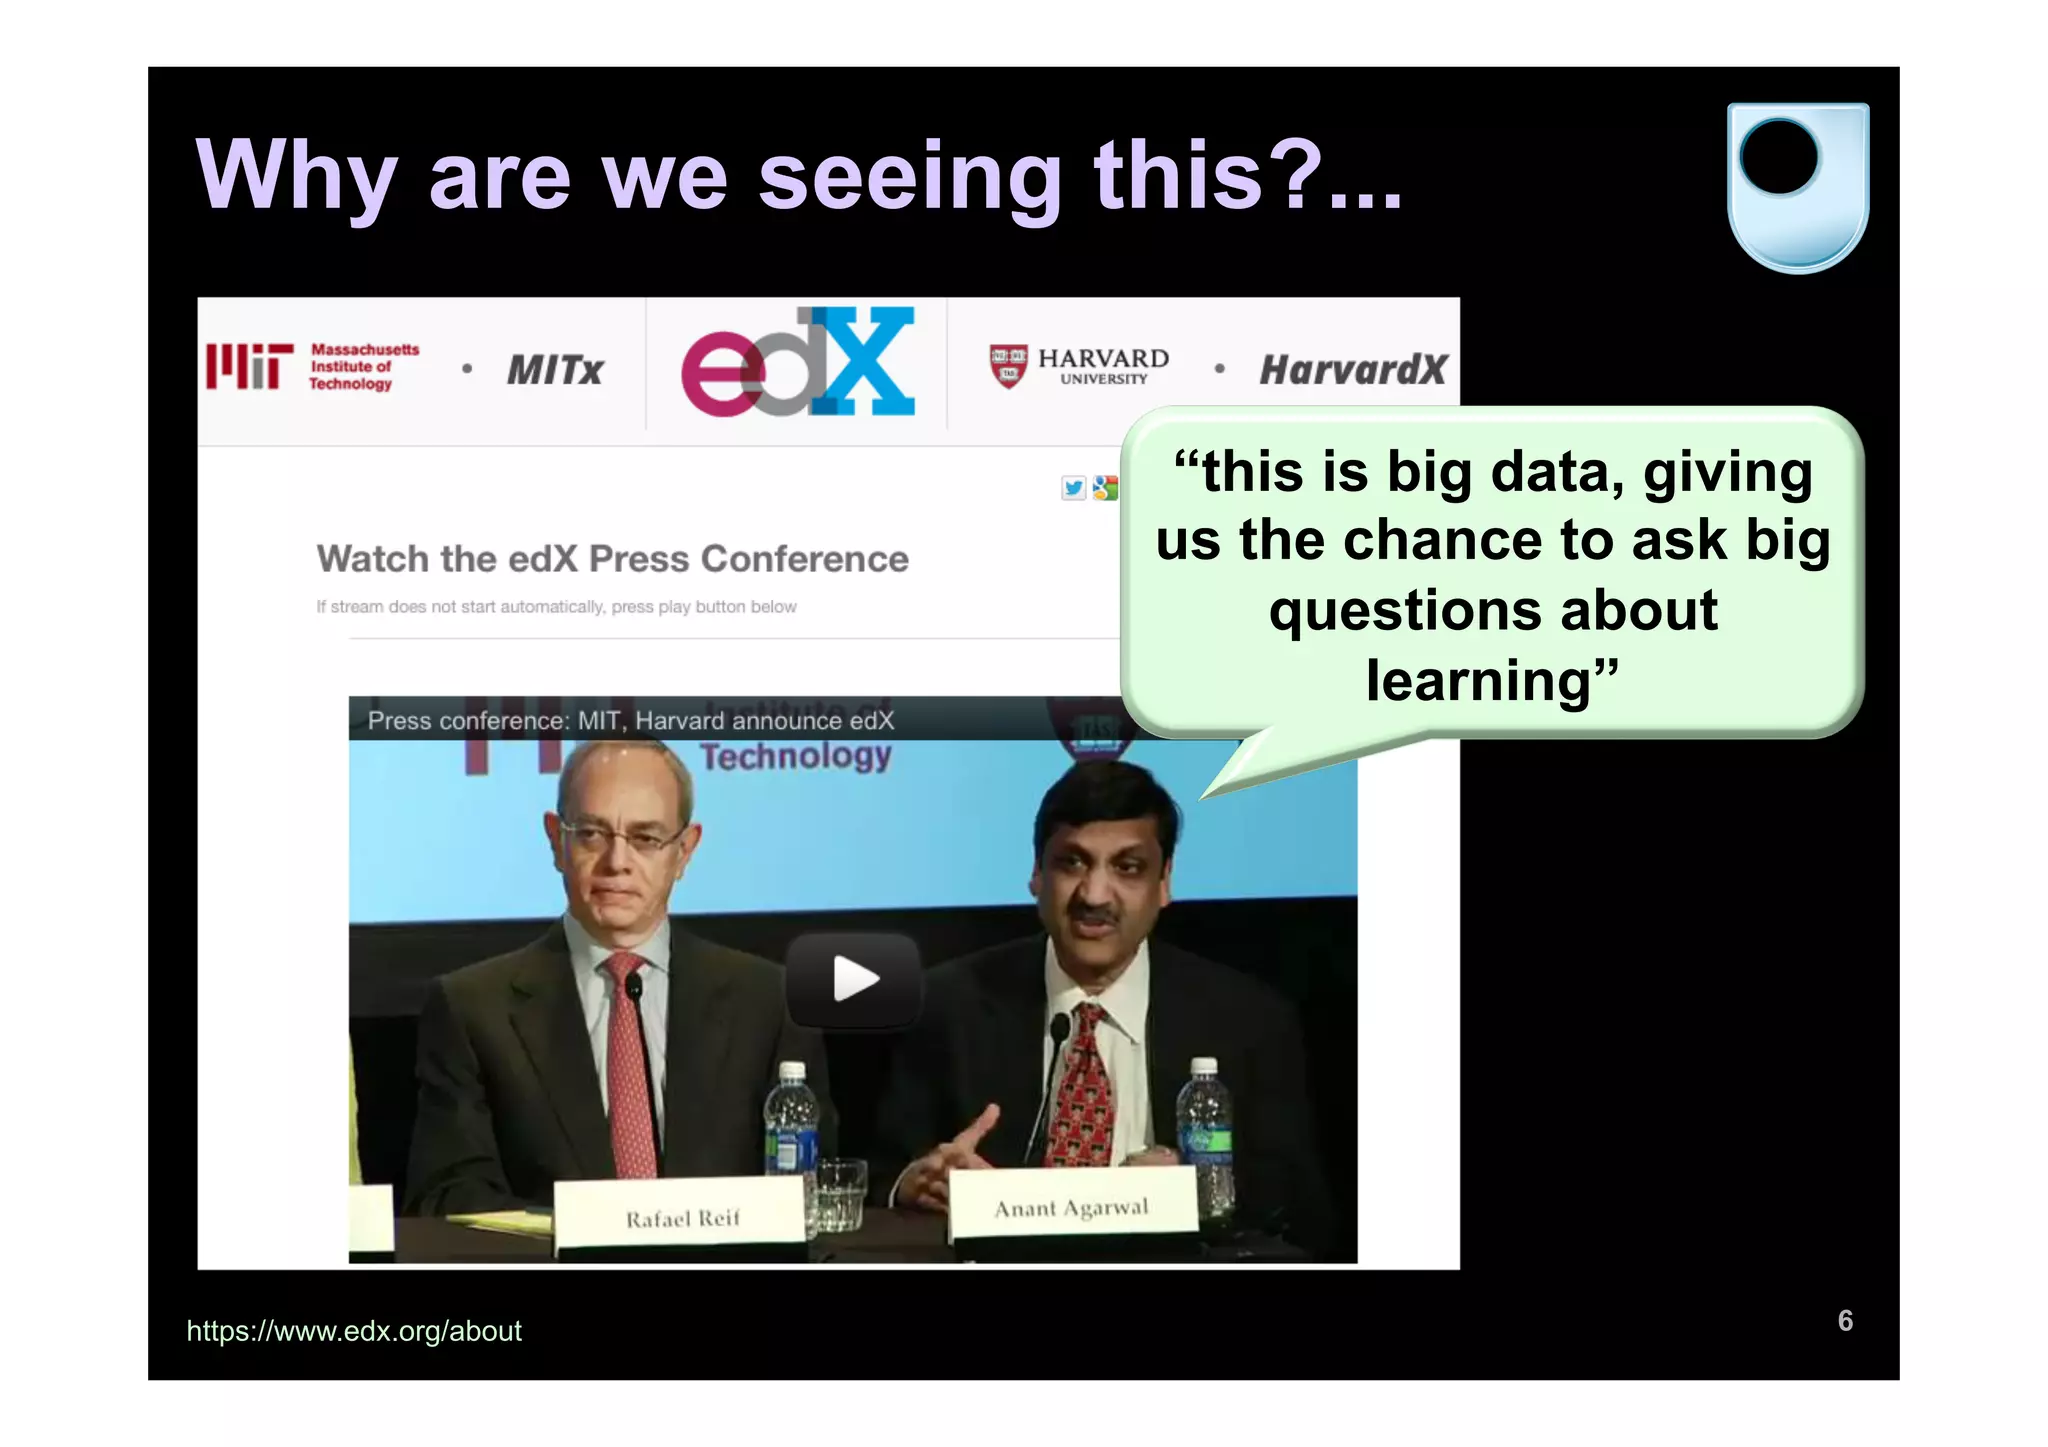
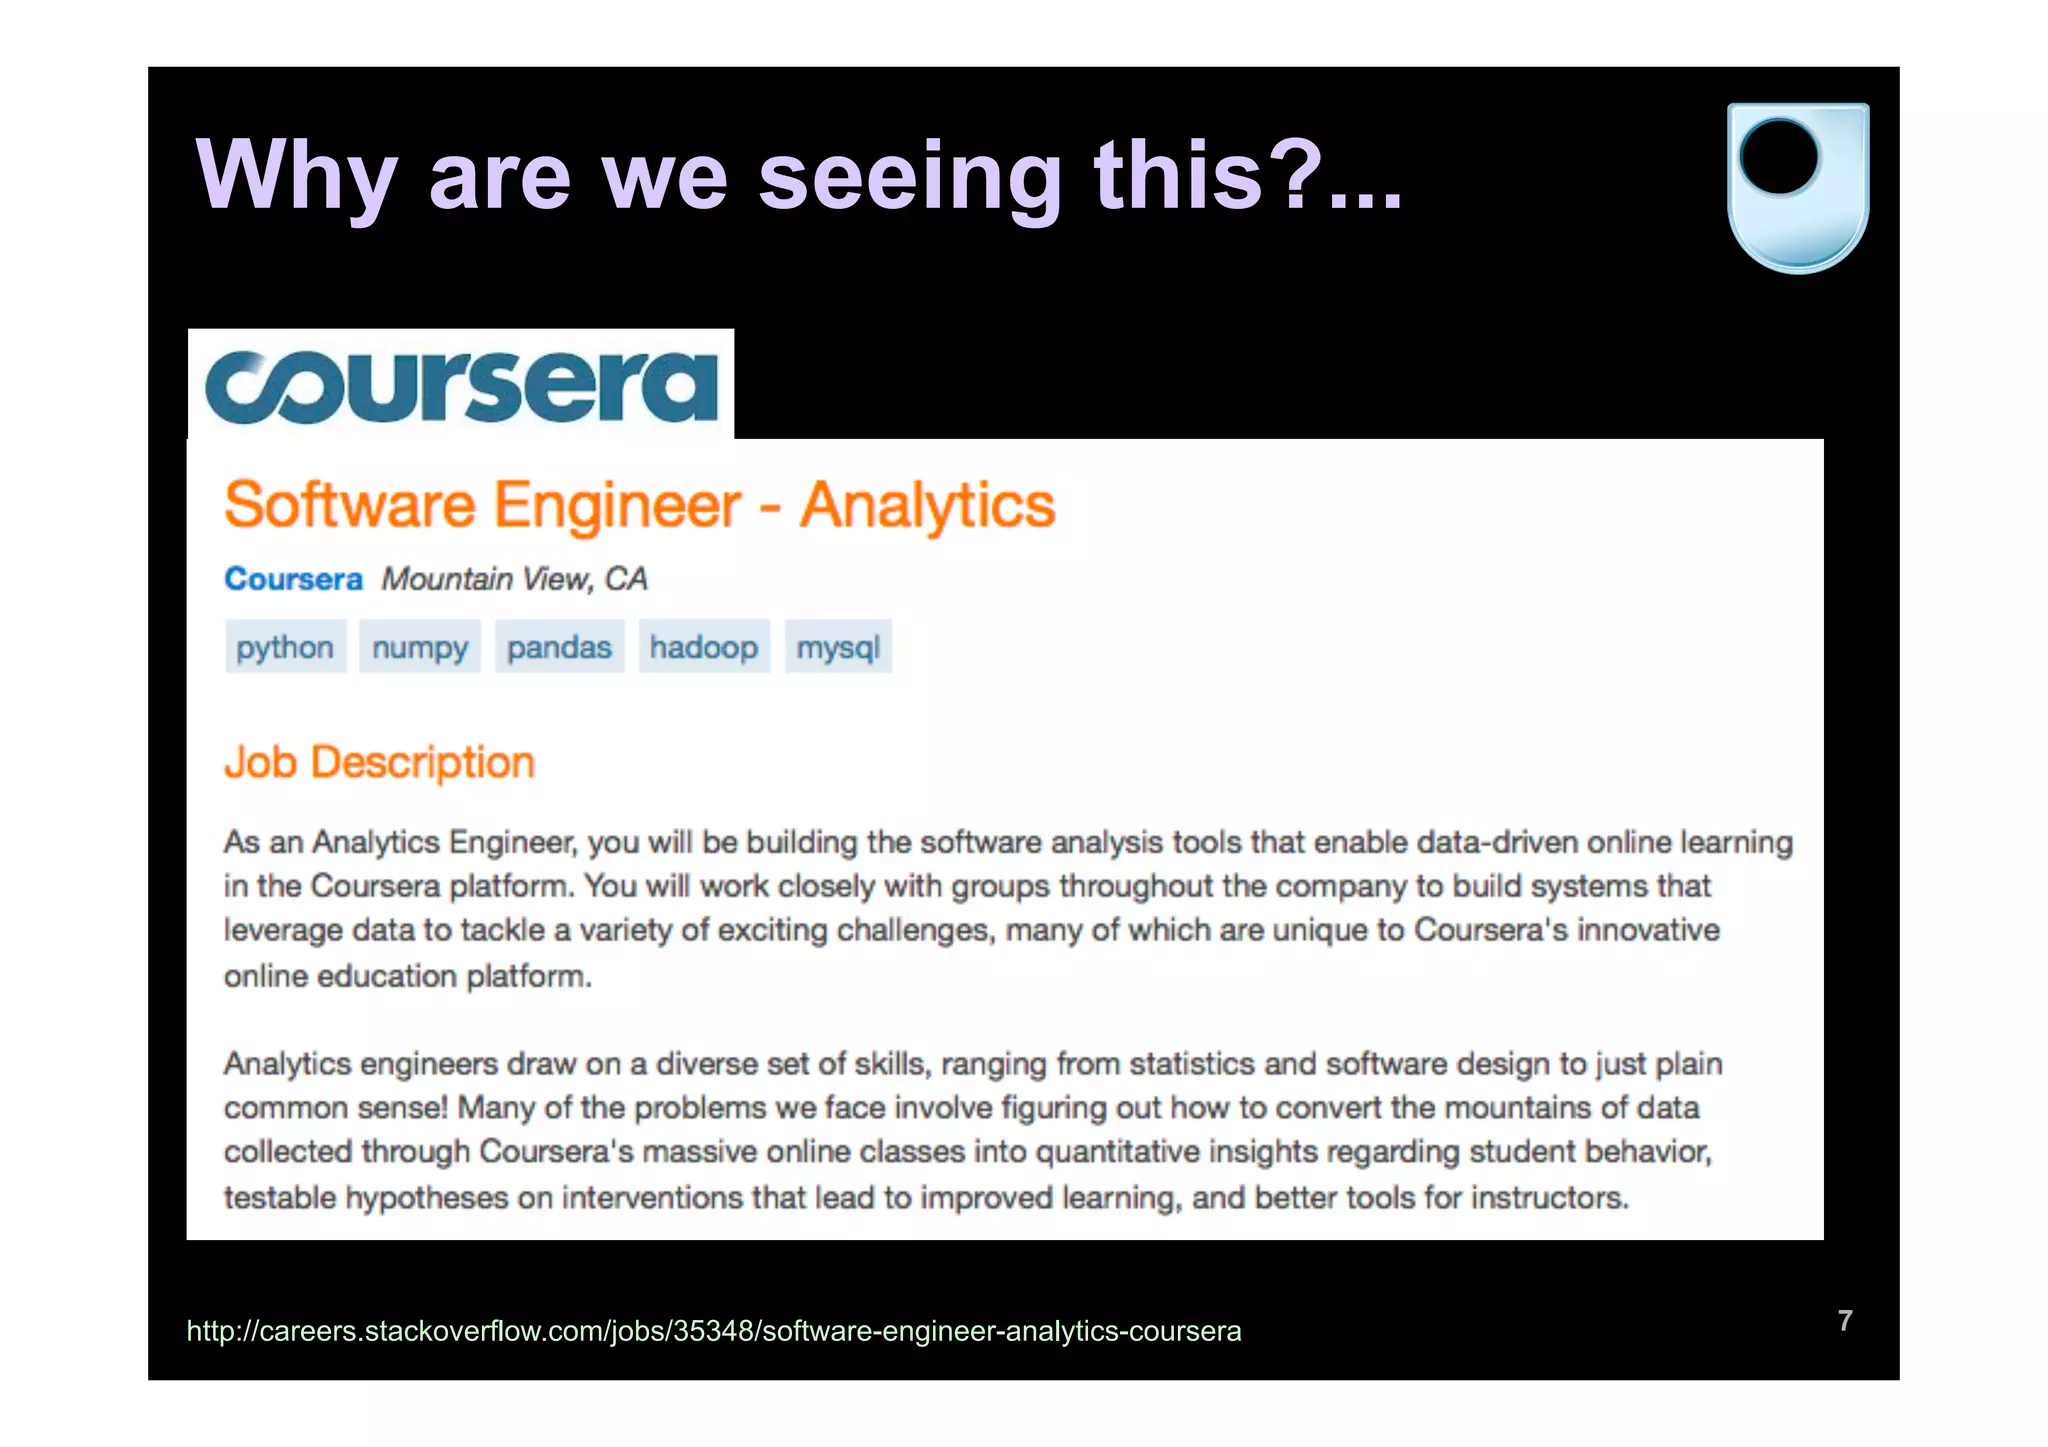
The document discusses the emerging field of learning analytics, highlighting its transformative potential in education by predicting and improving student engagement and performance. It outlines various predictive models and analytics tools being developed, such as Purdue University's Signals, which uses real-time data to identify at-risk students and enhance their learning outcomes. Furthermore, it explores the intersection of learning analytics with social media and discourse analytics, advocating for a data-driven approach to educational practices.


![[Extended] Bottom-up growth of learning analytics at two Australian universit...](https://cdn.slidesharecdn.com/ss_thumbnails/bottom-upgrowthofla-160416081432-thumbnail.jpg?width=640&height=640&fit=bounds)


