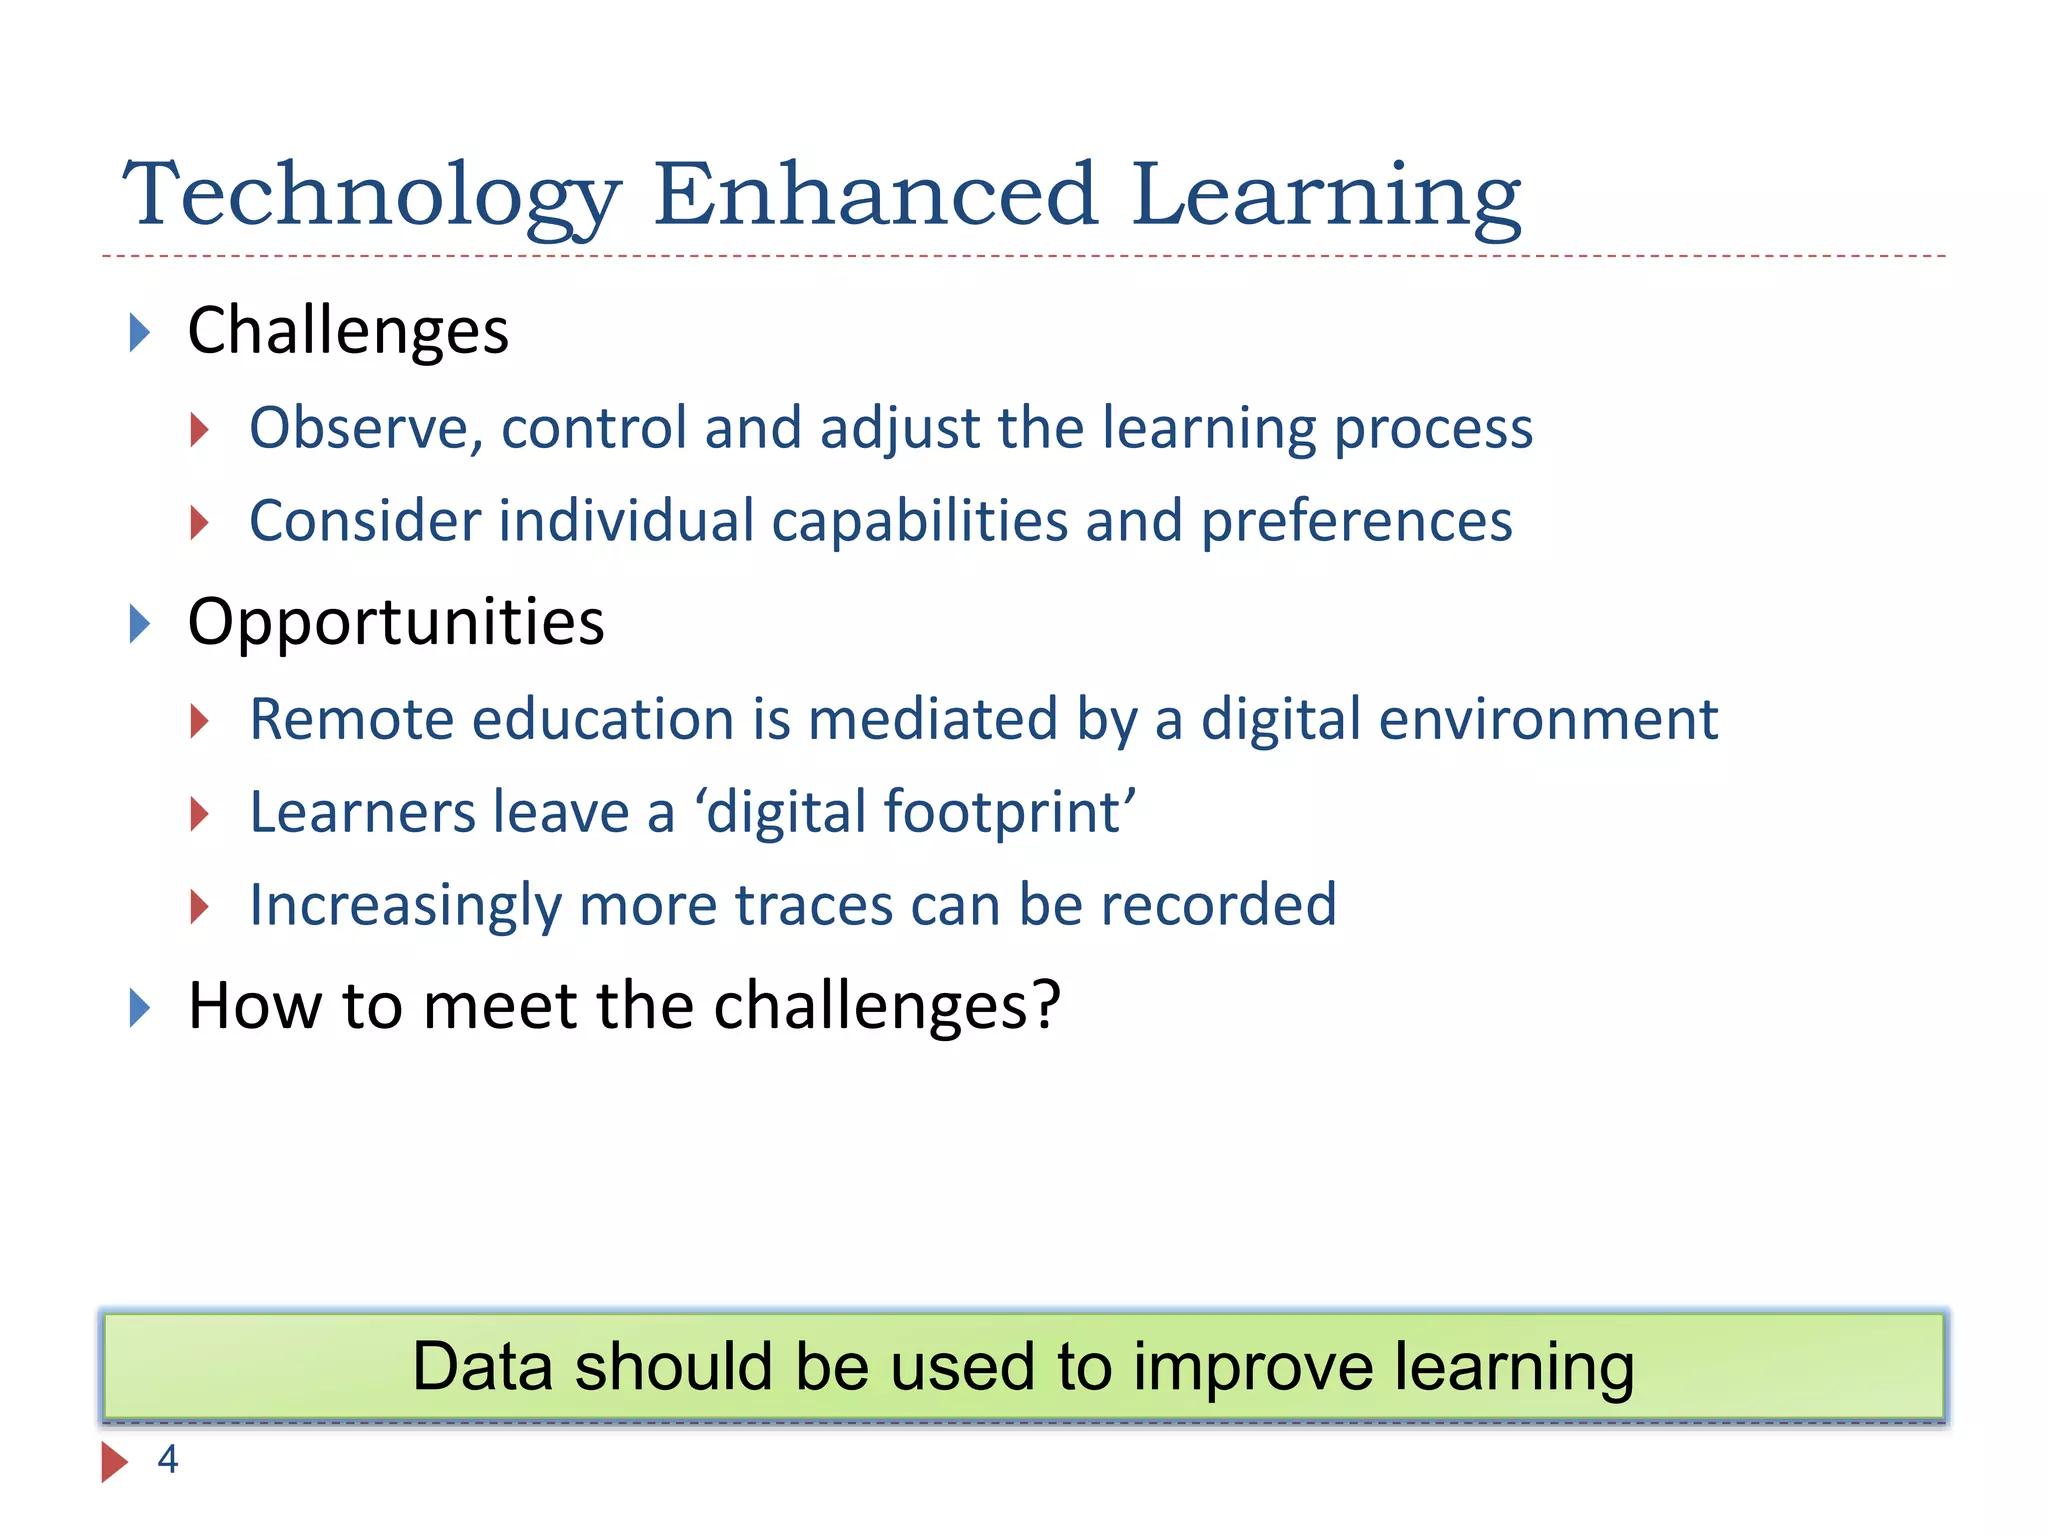
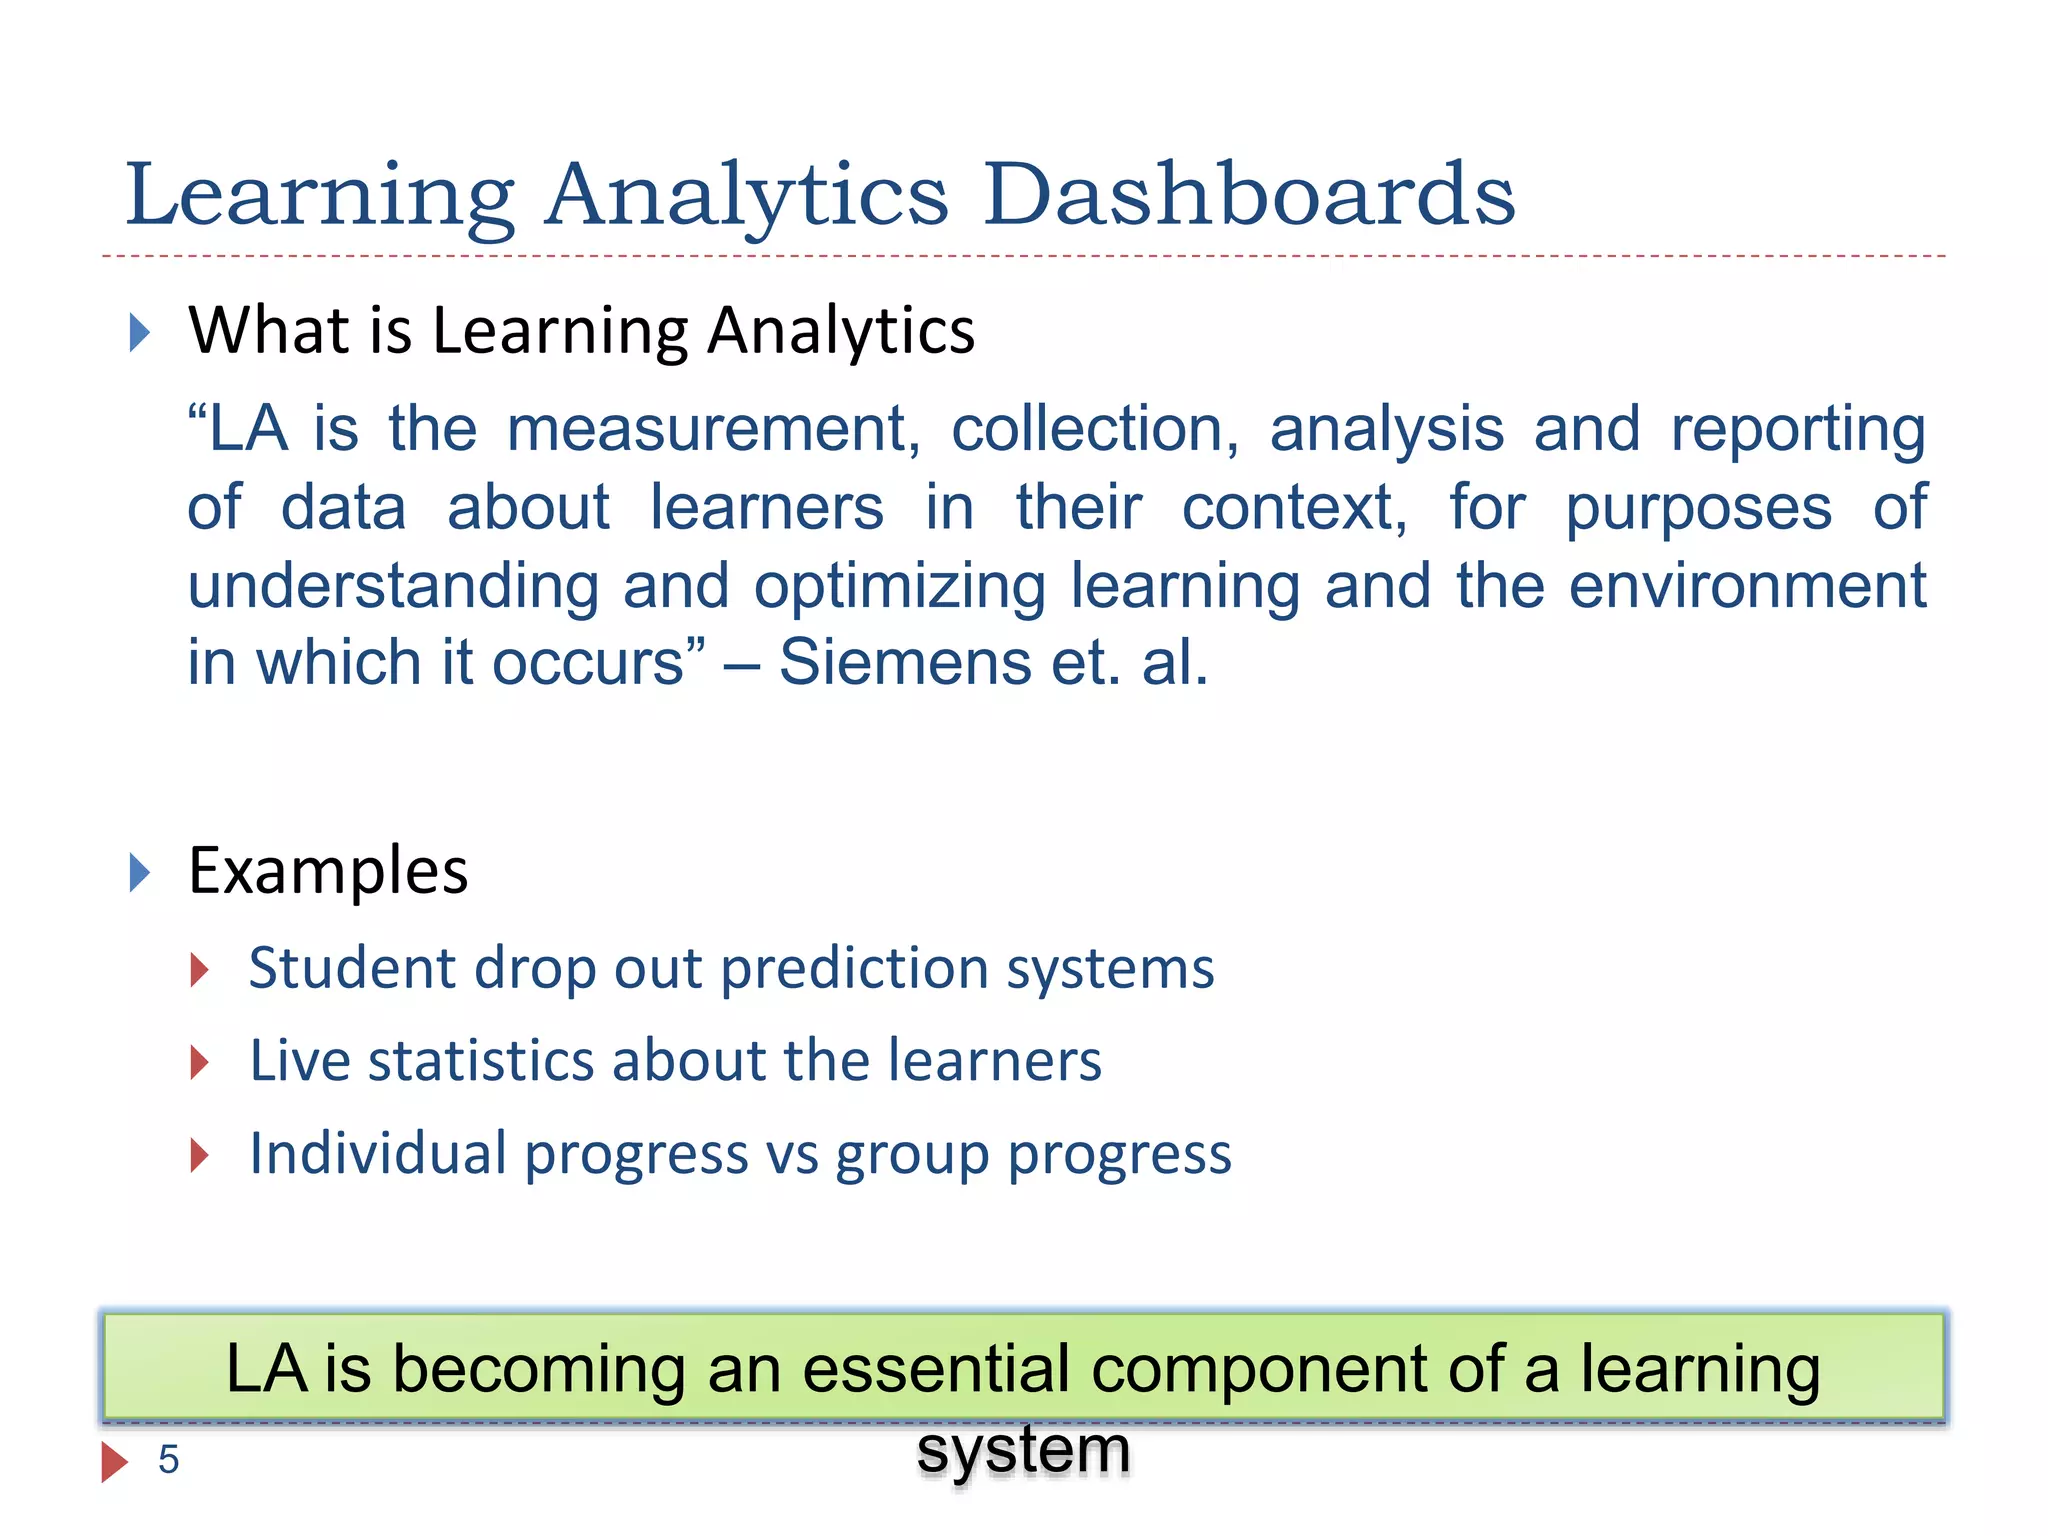
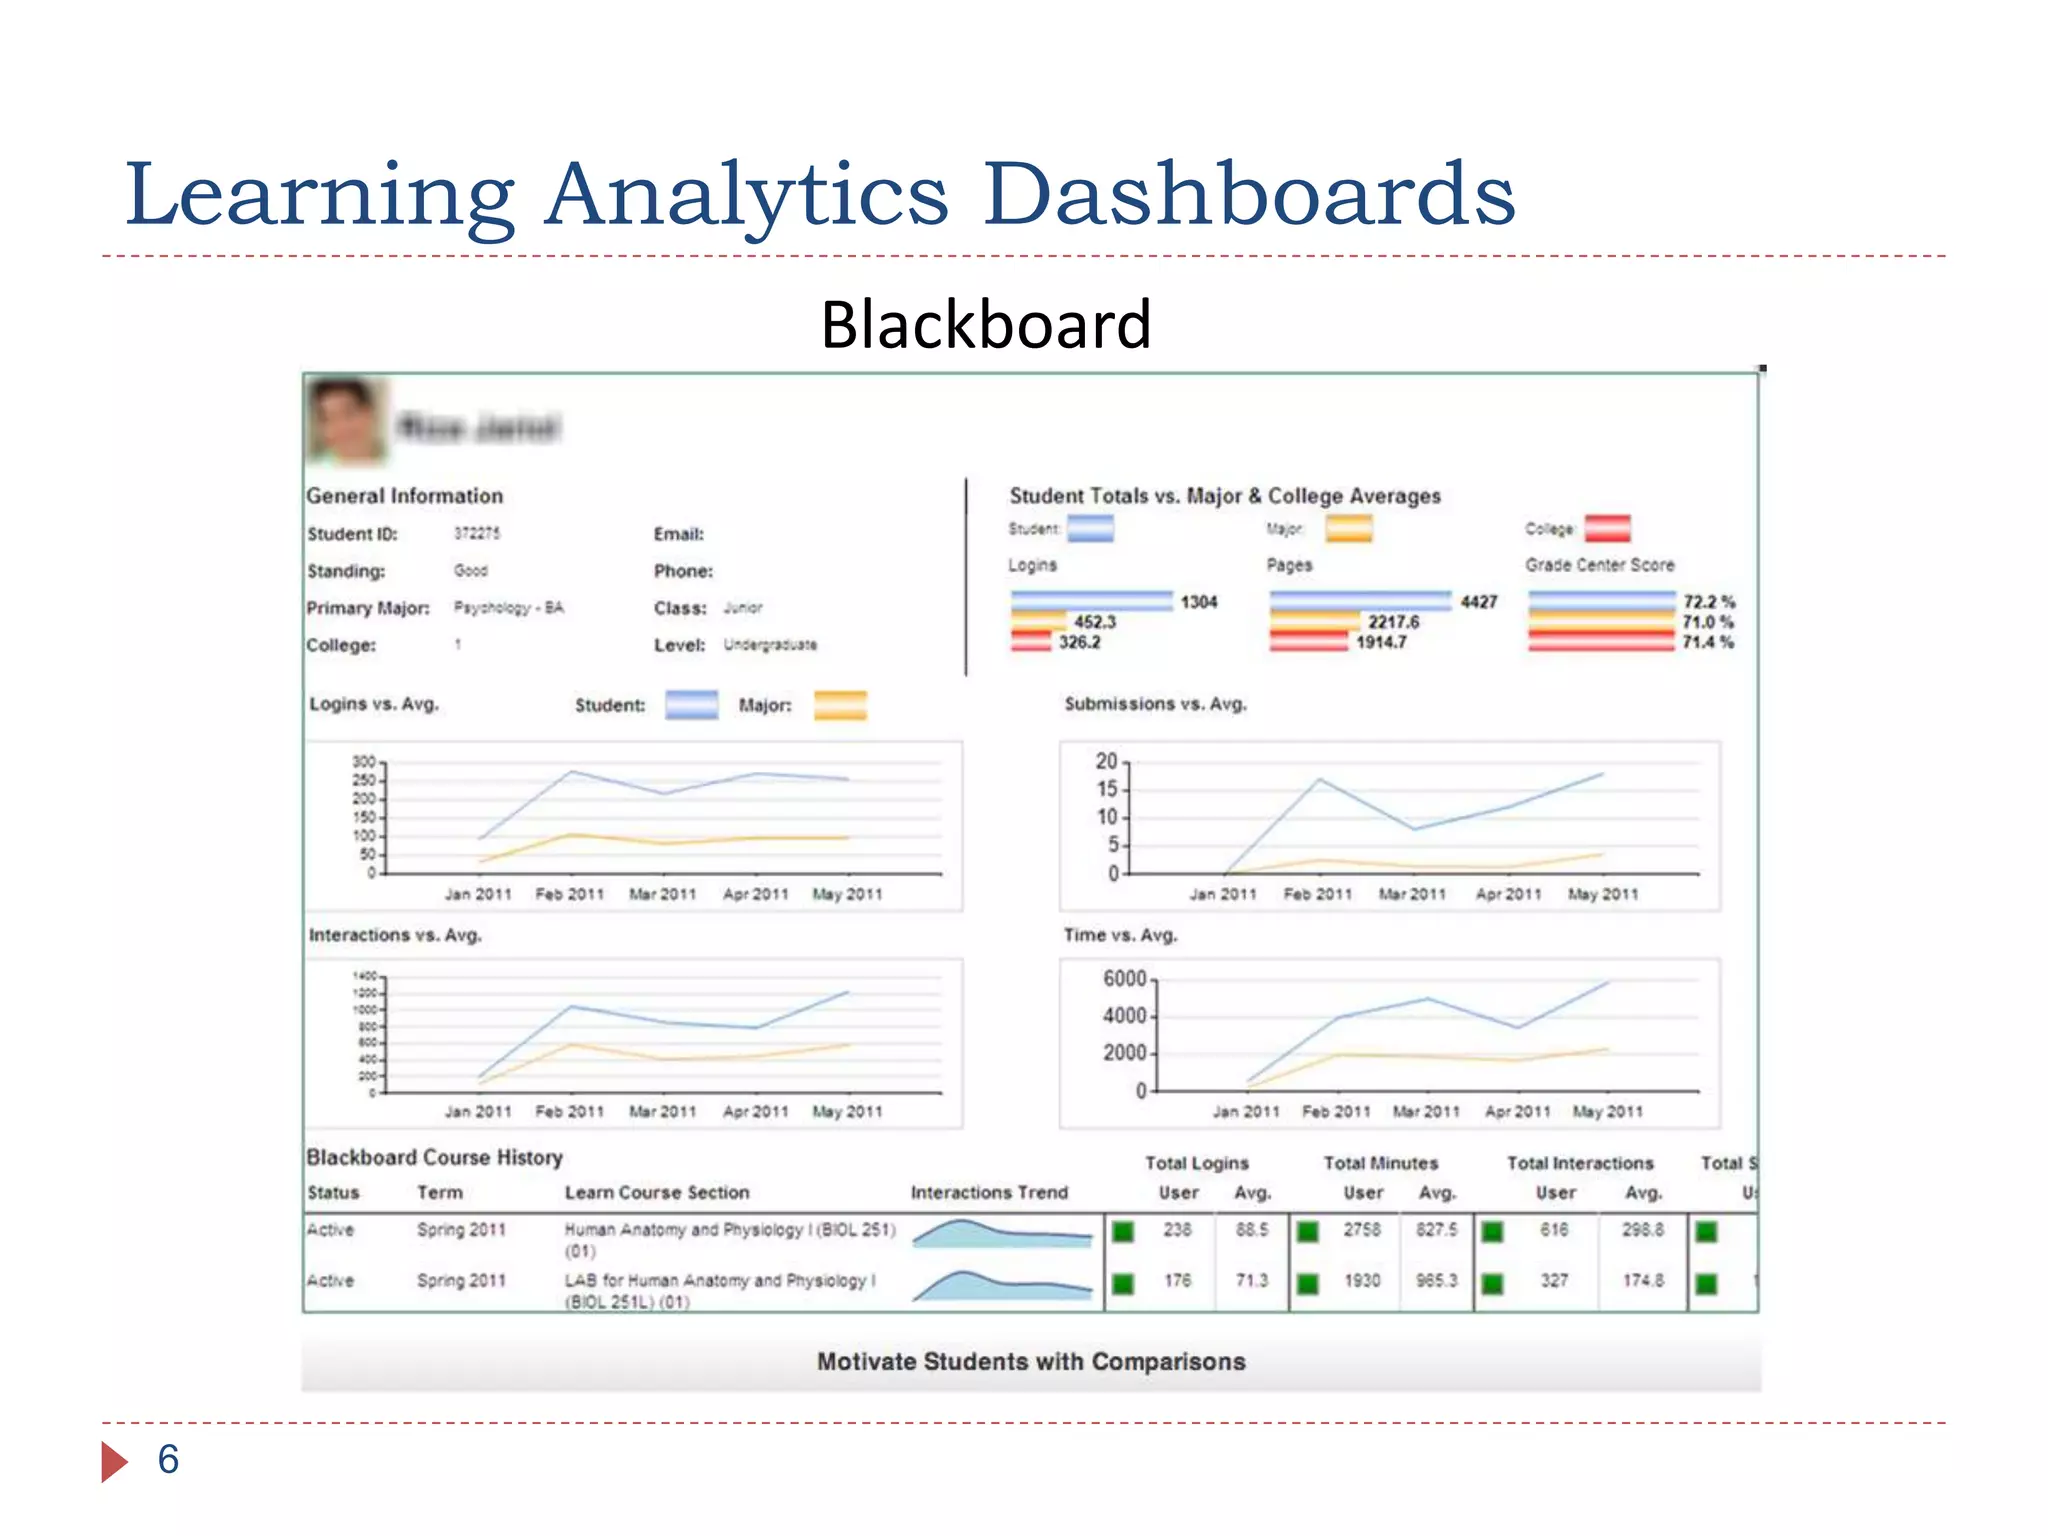
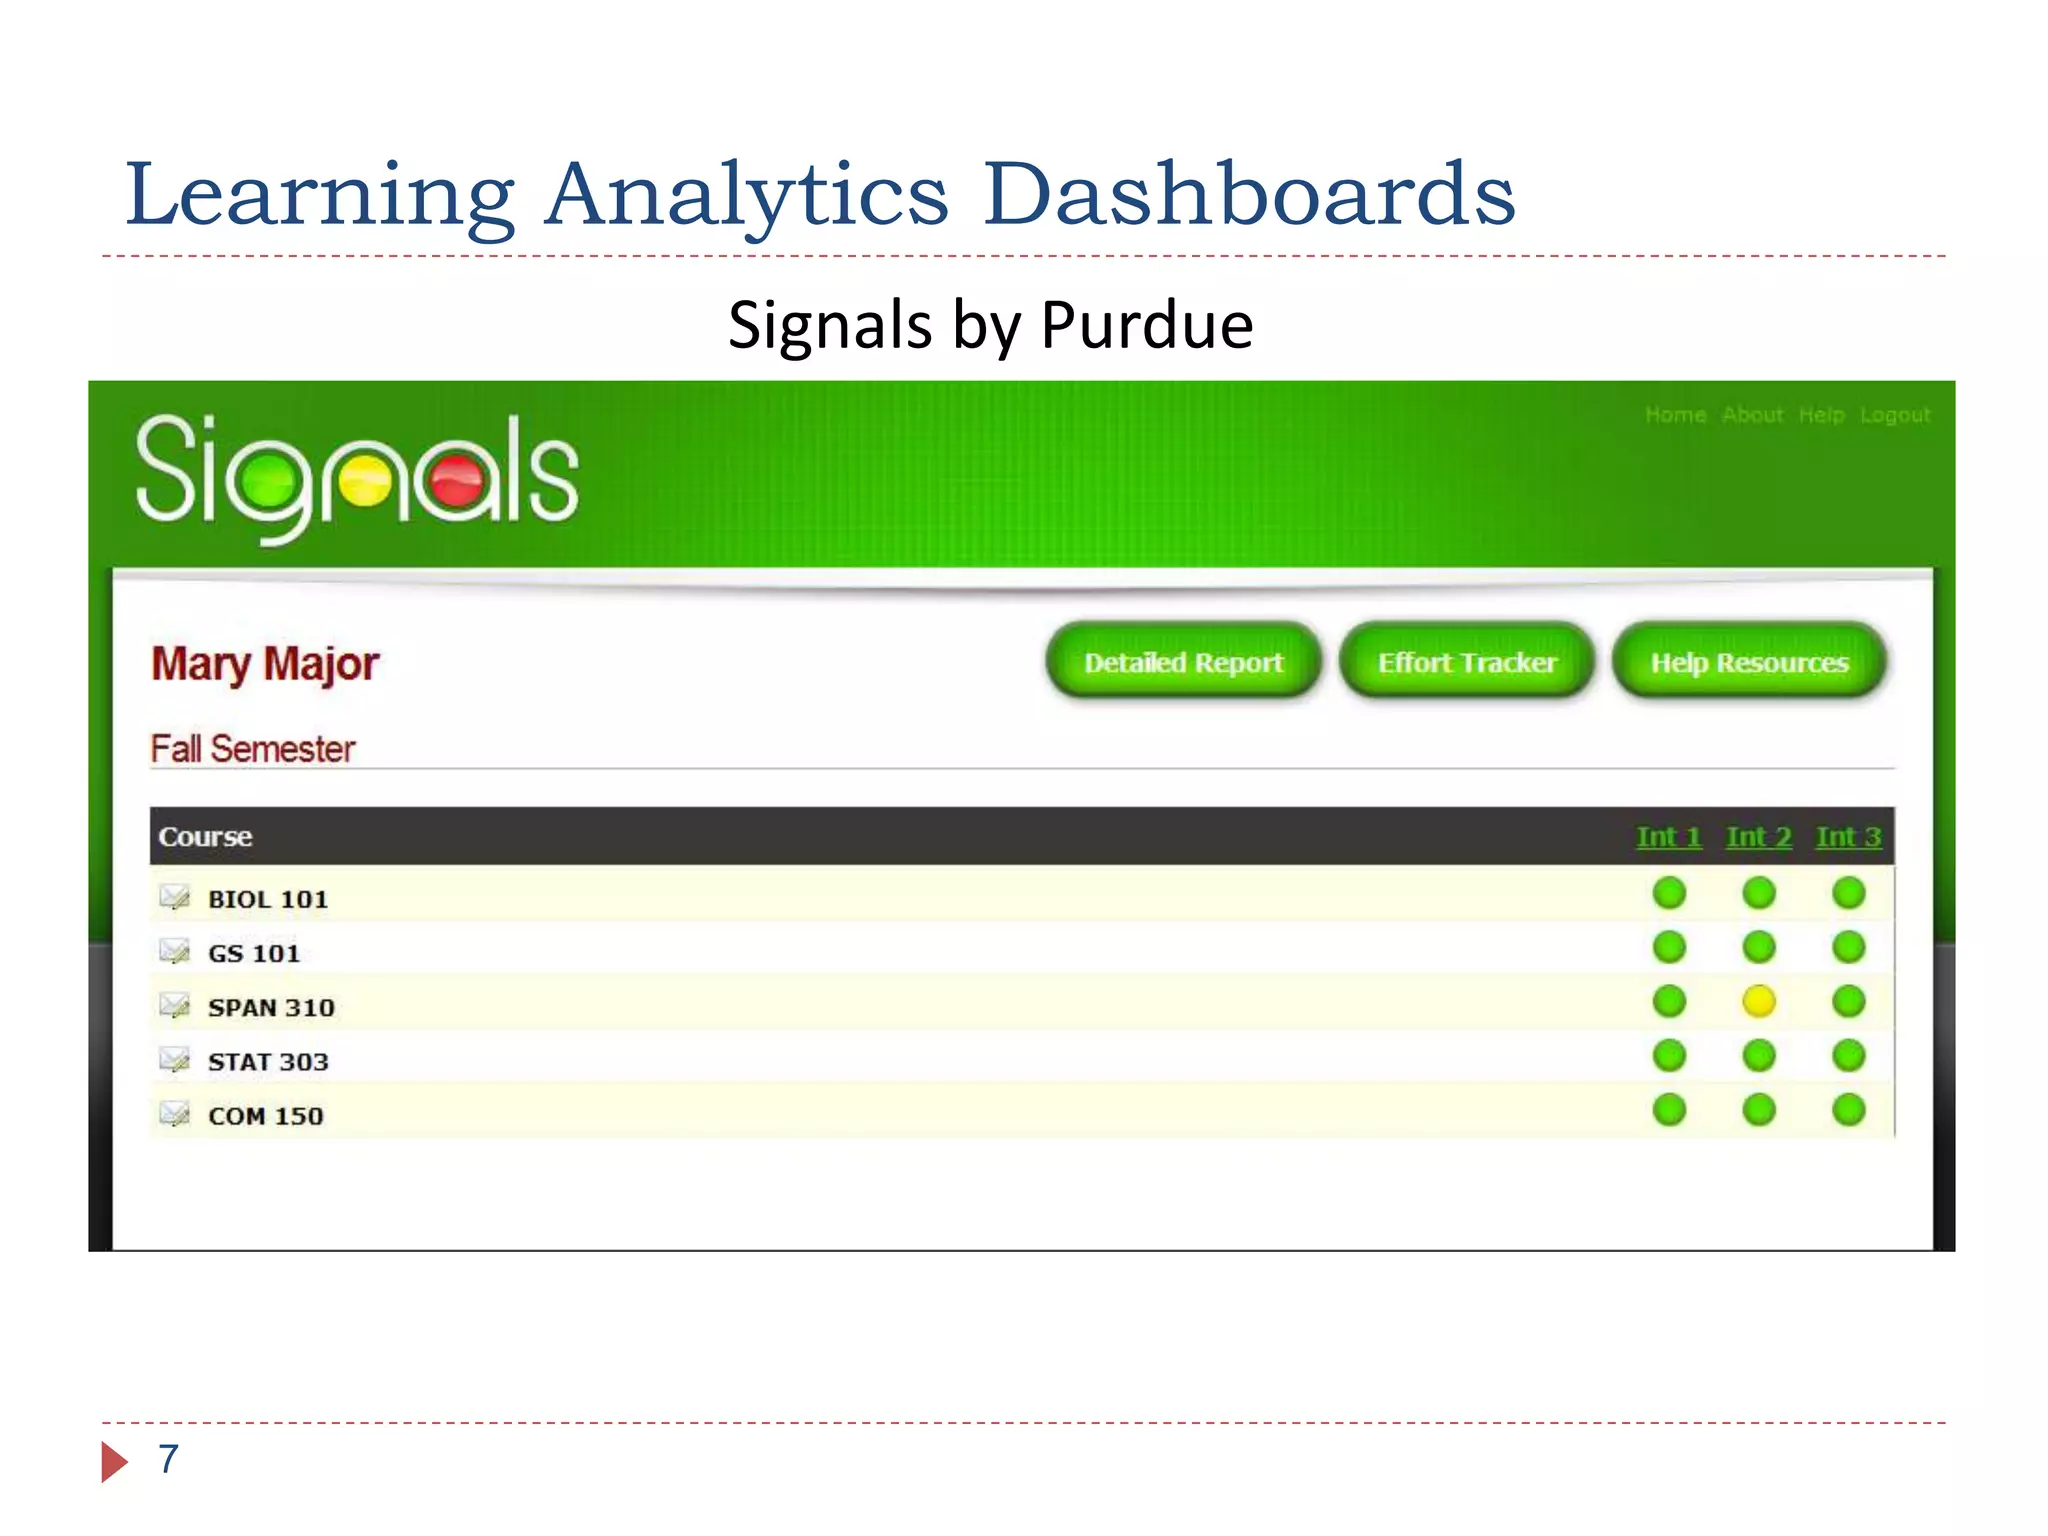
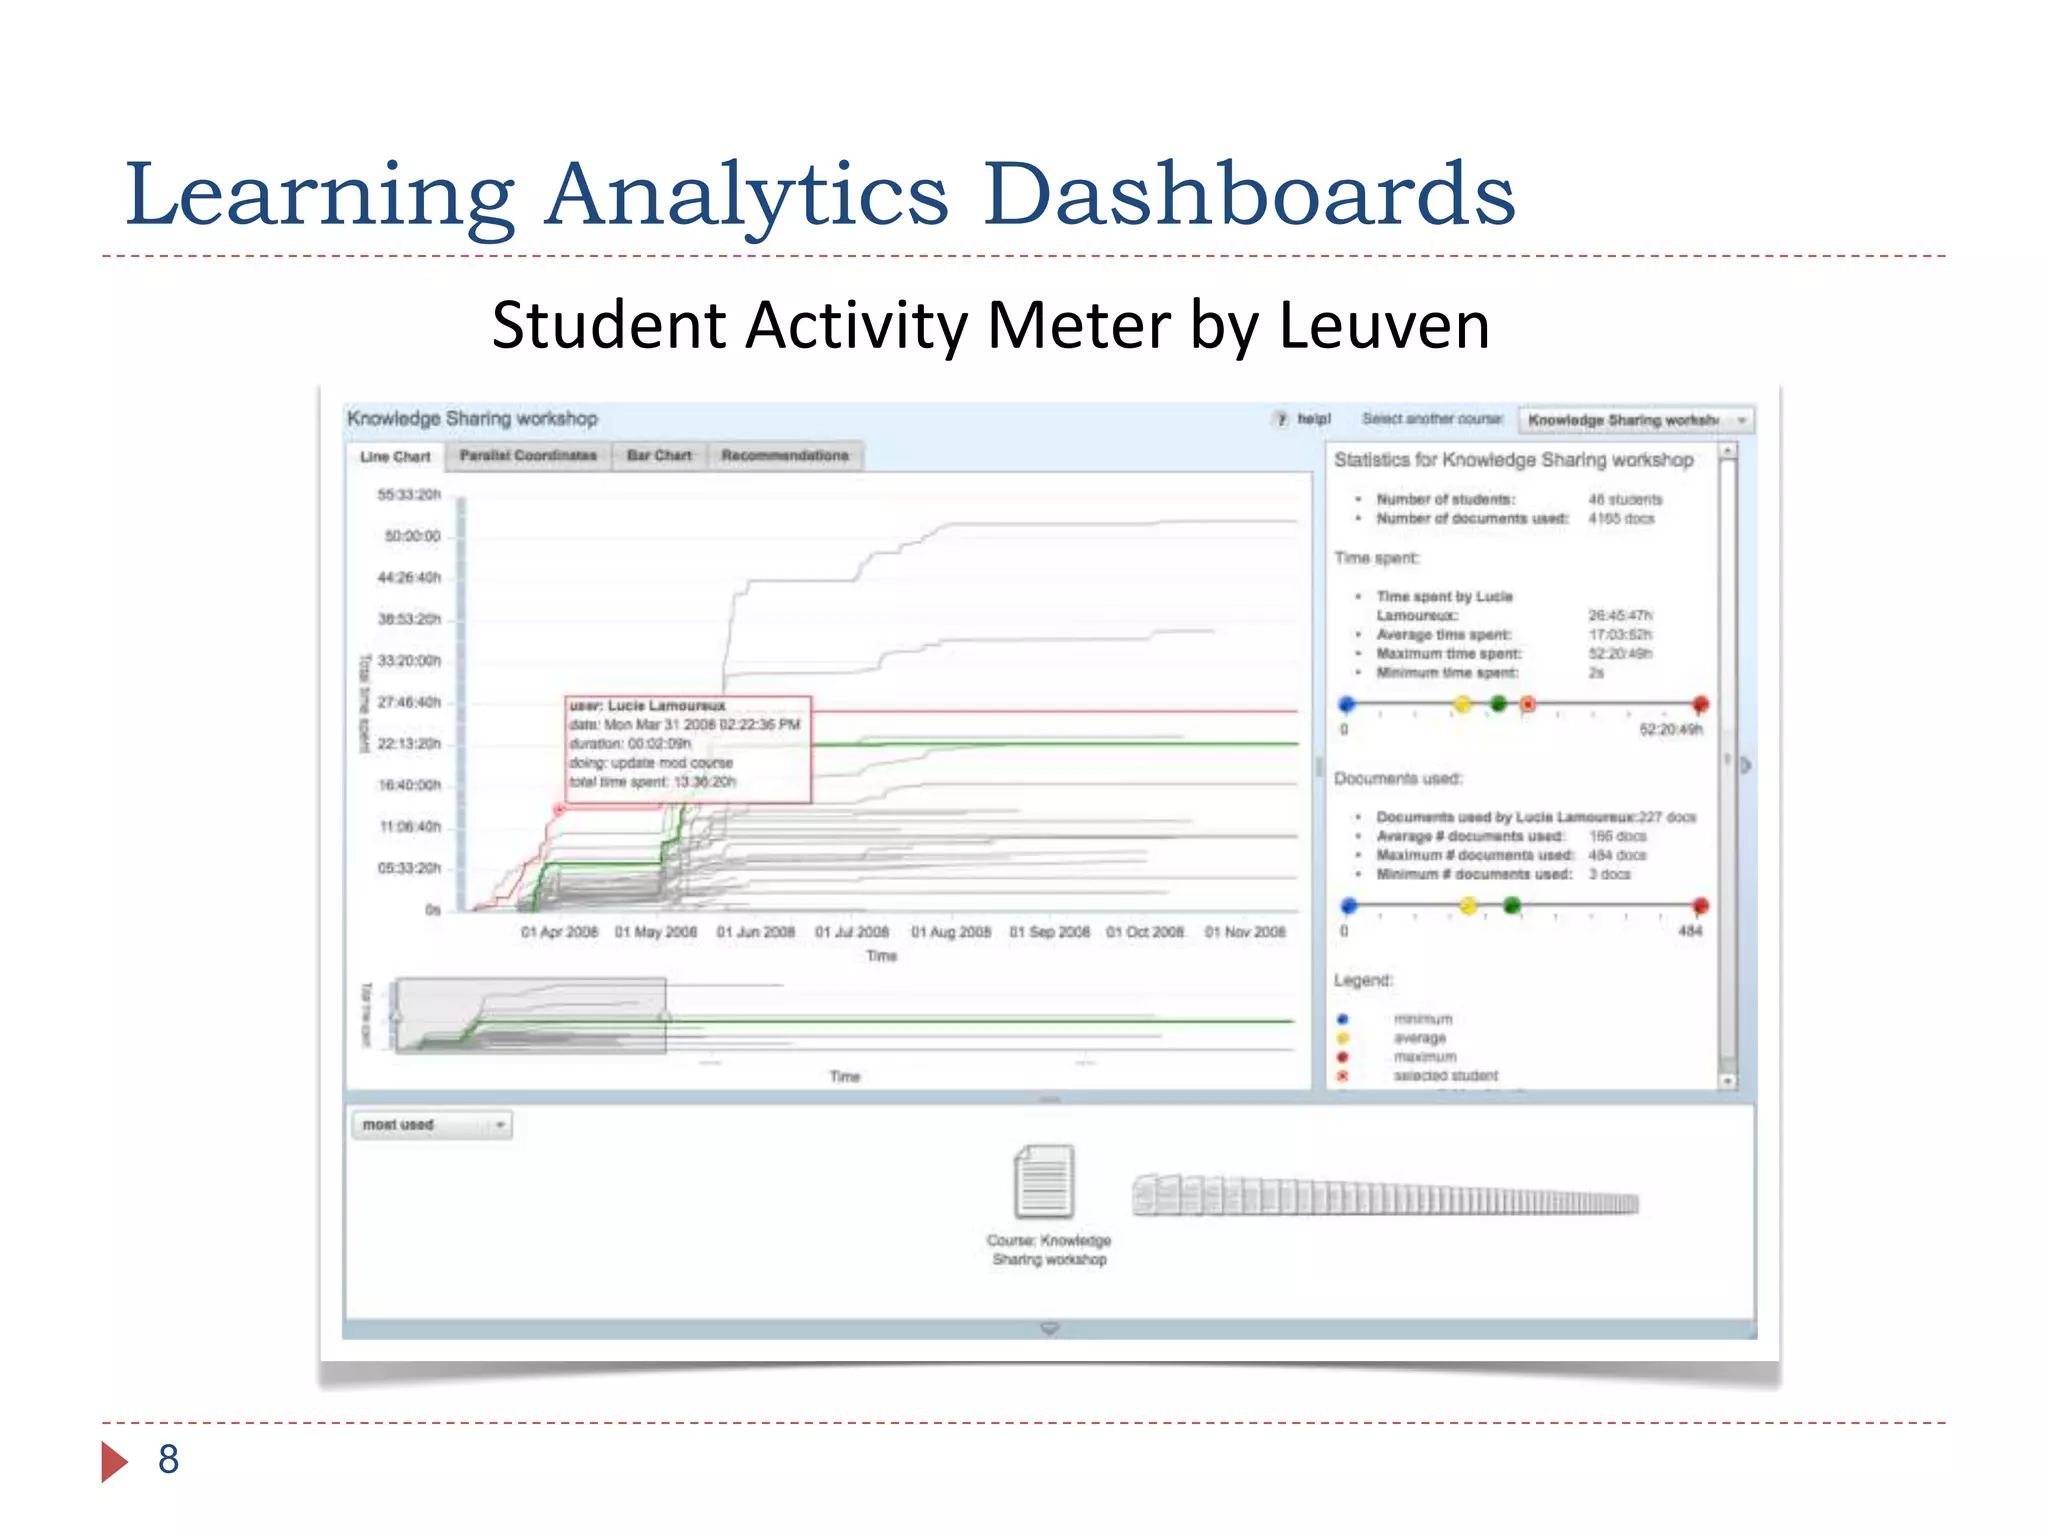
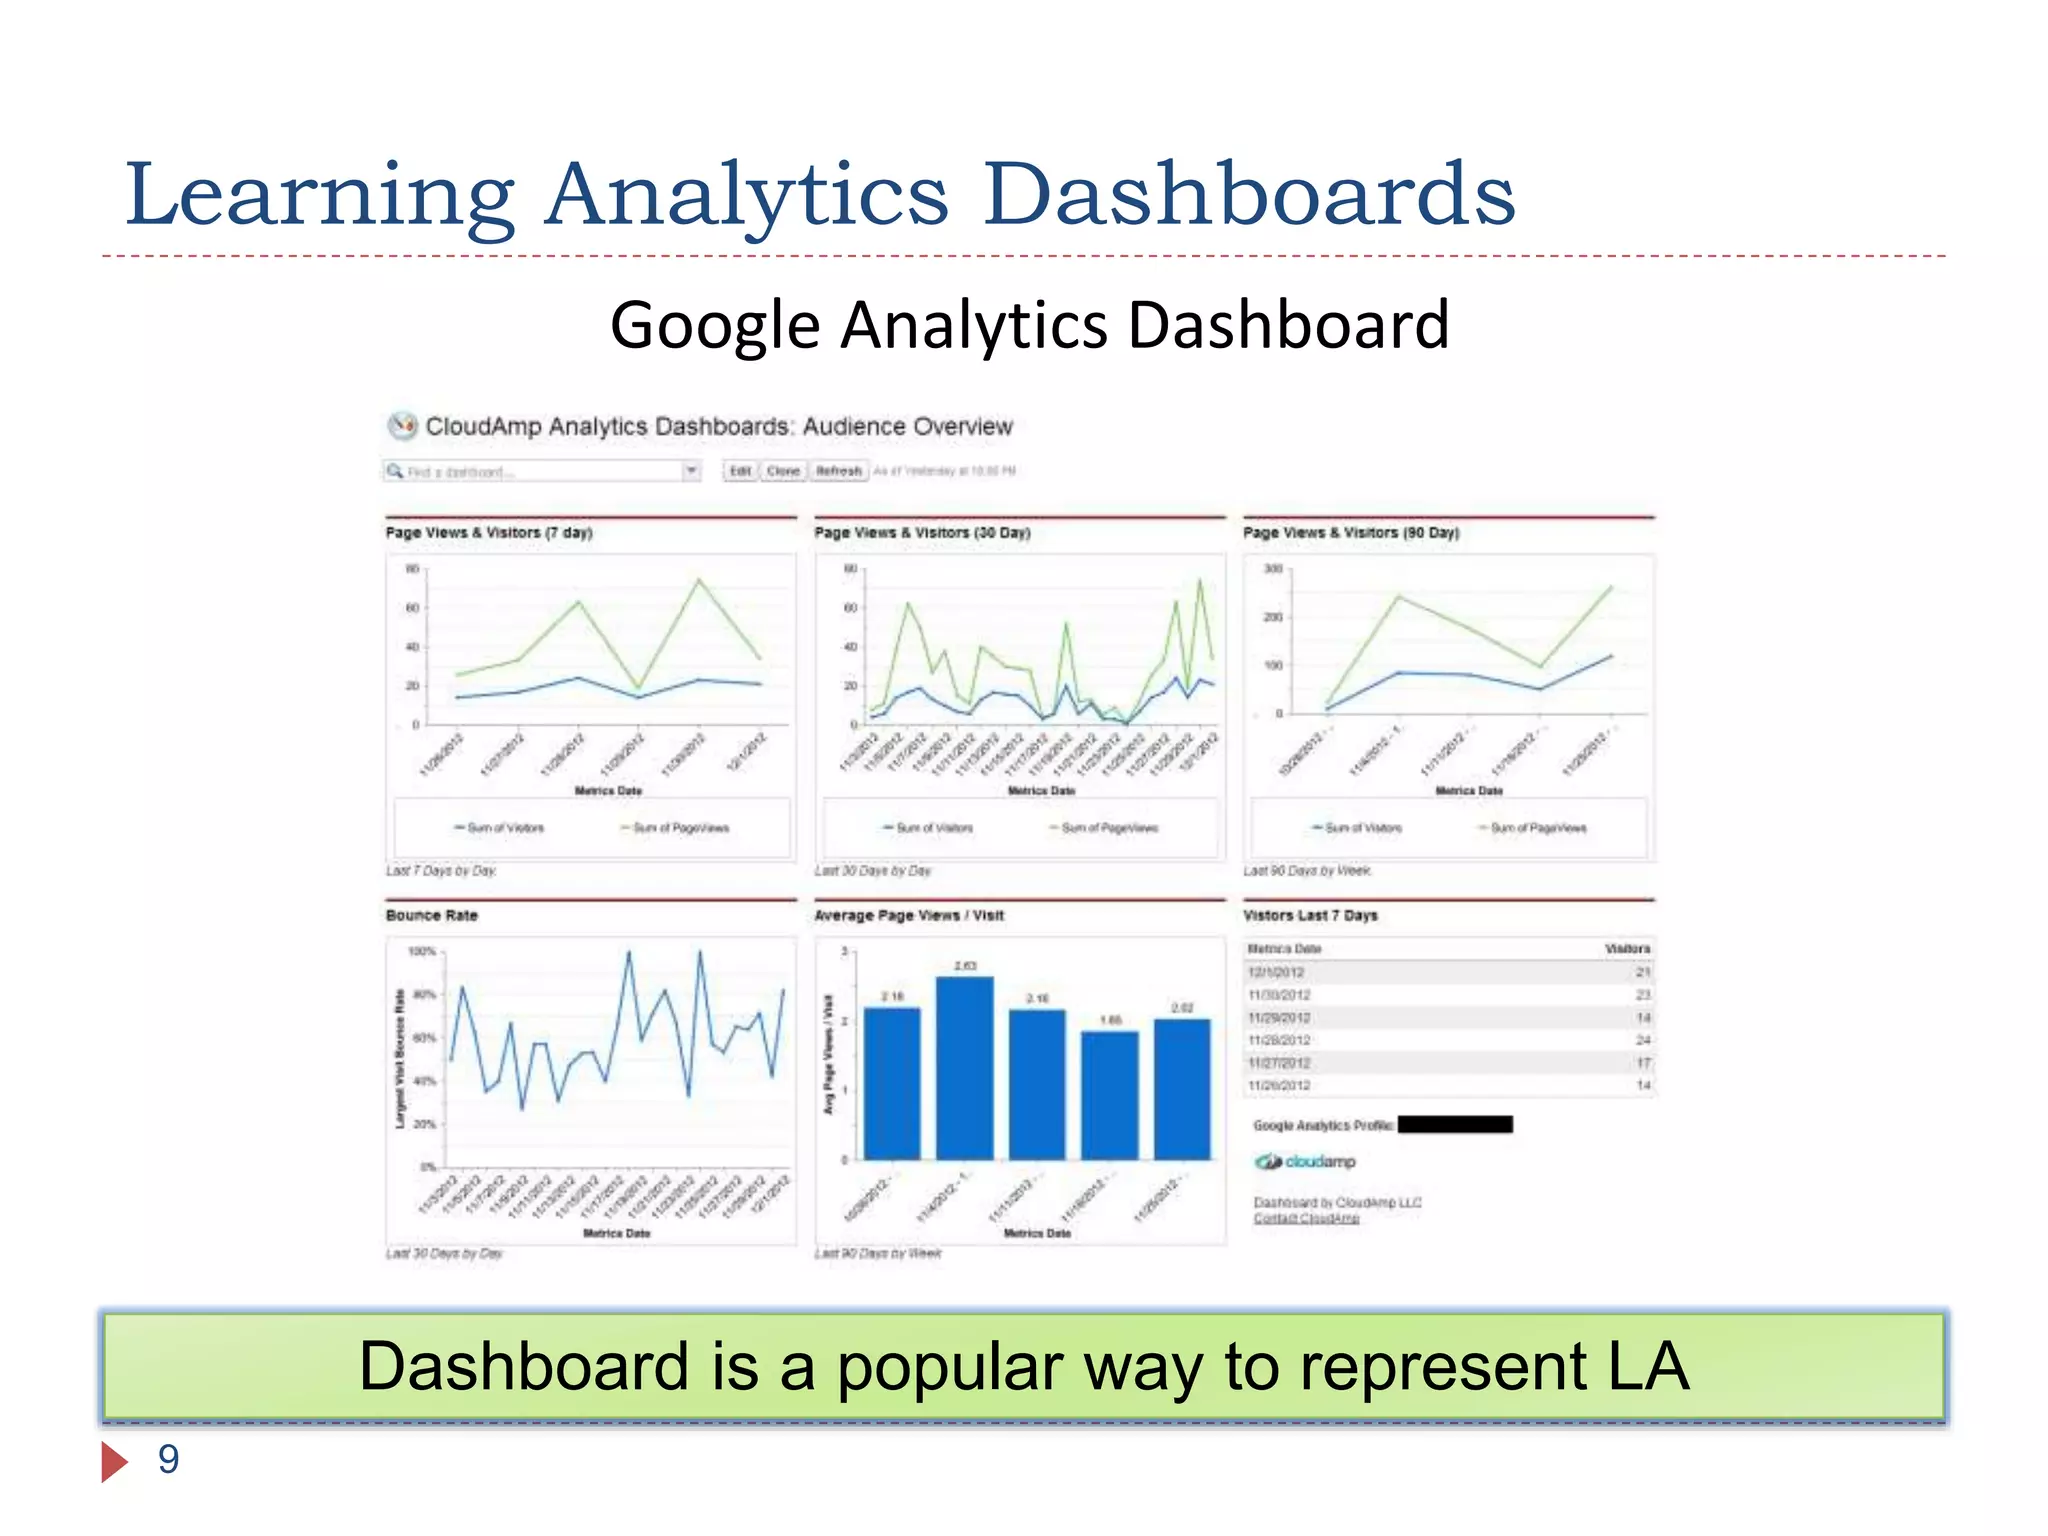
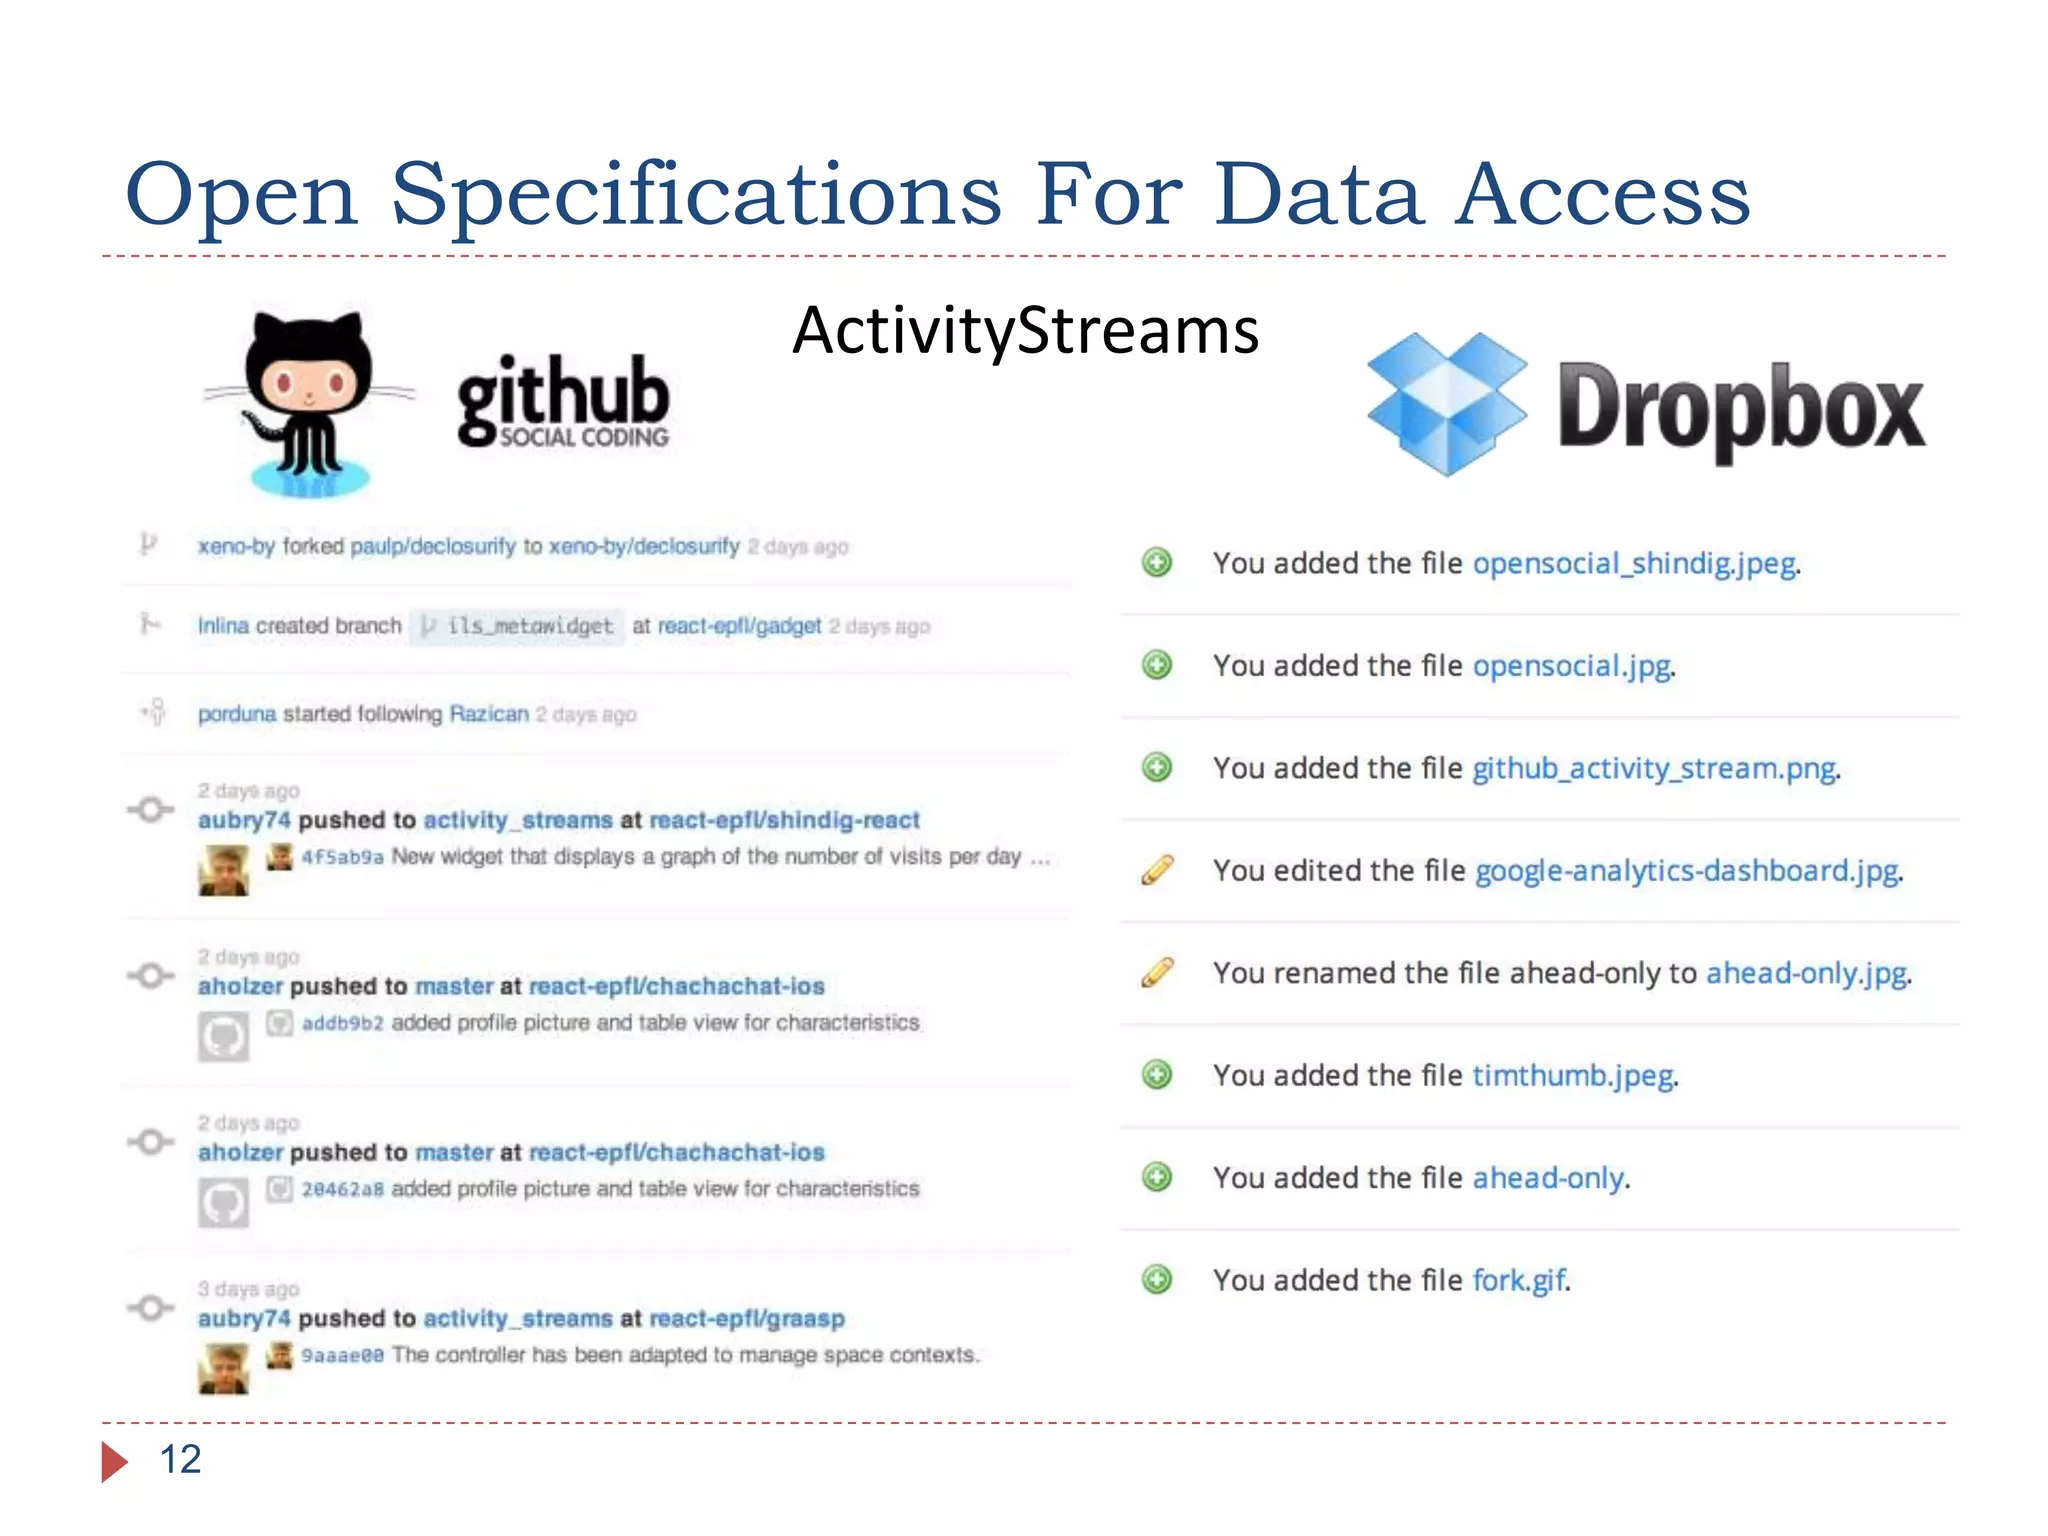
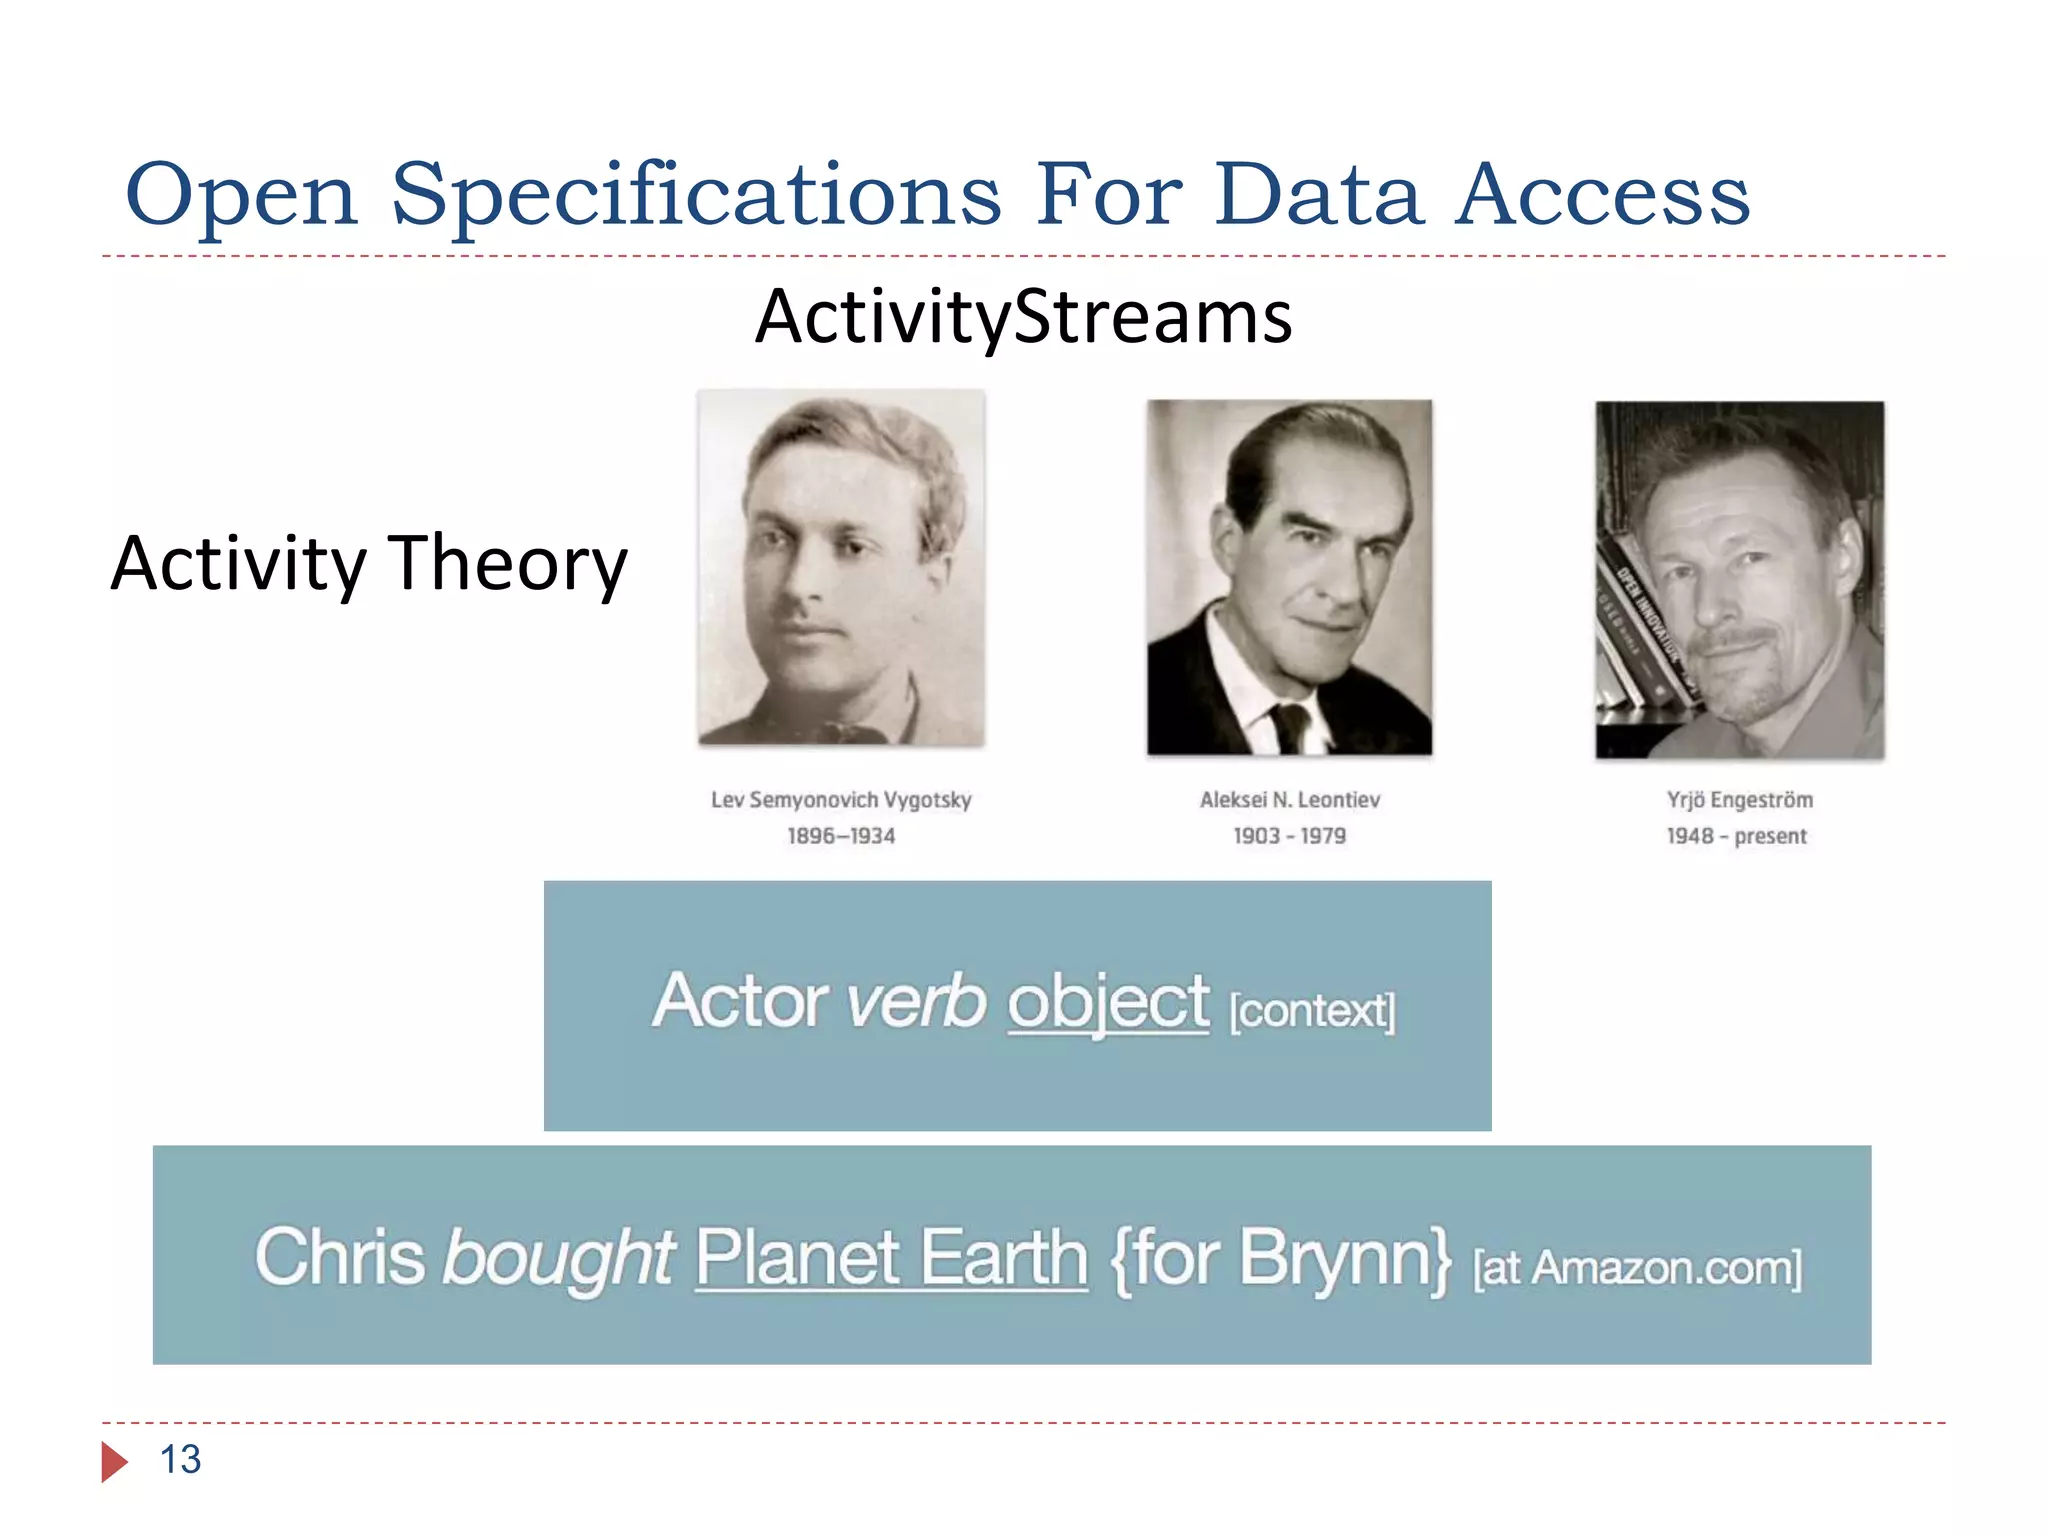
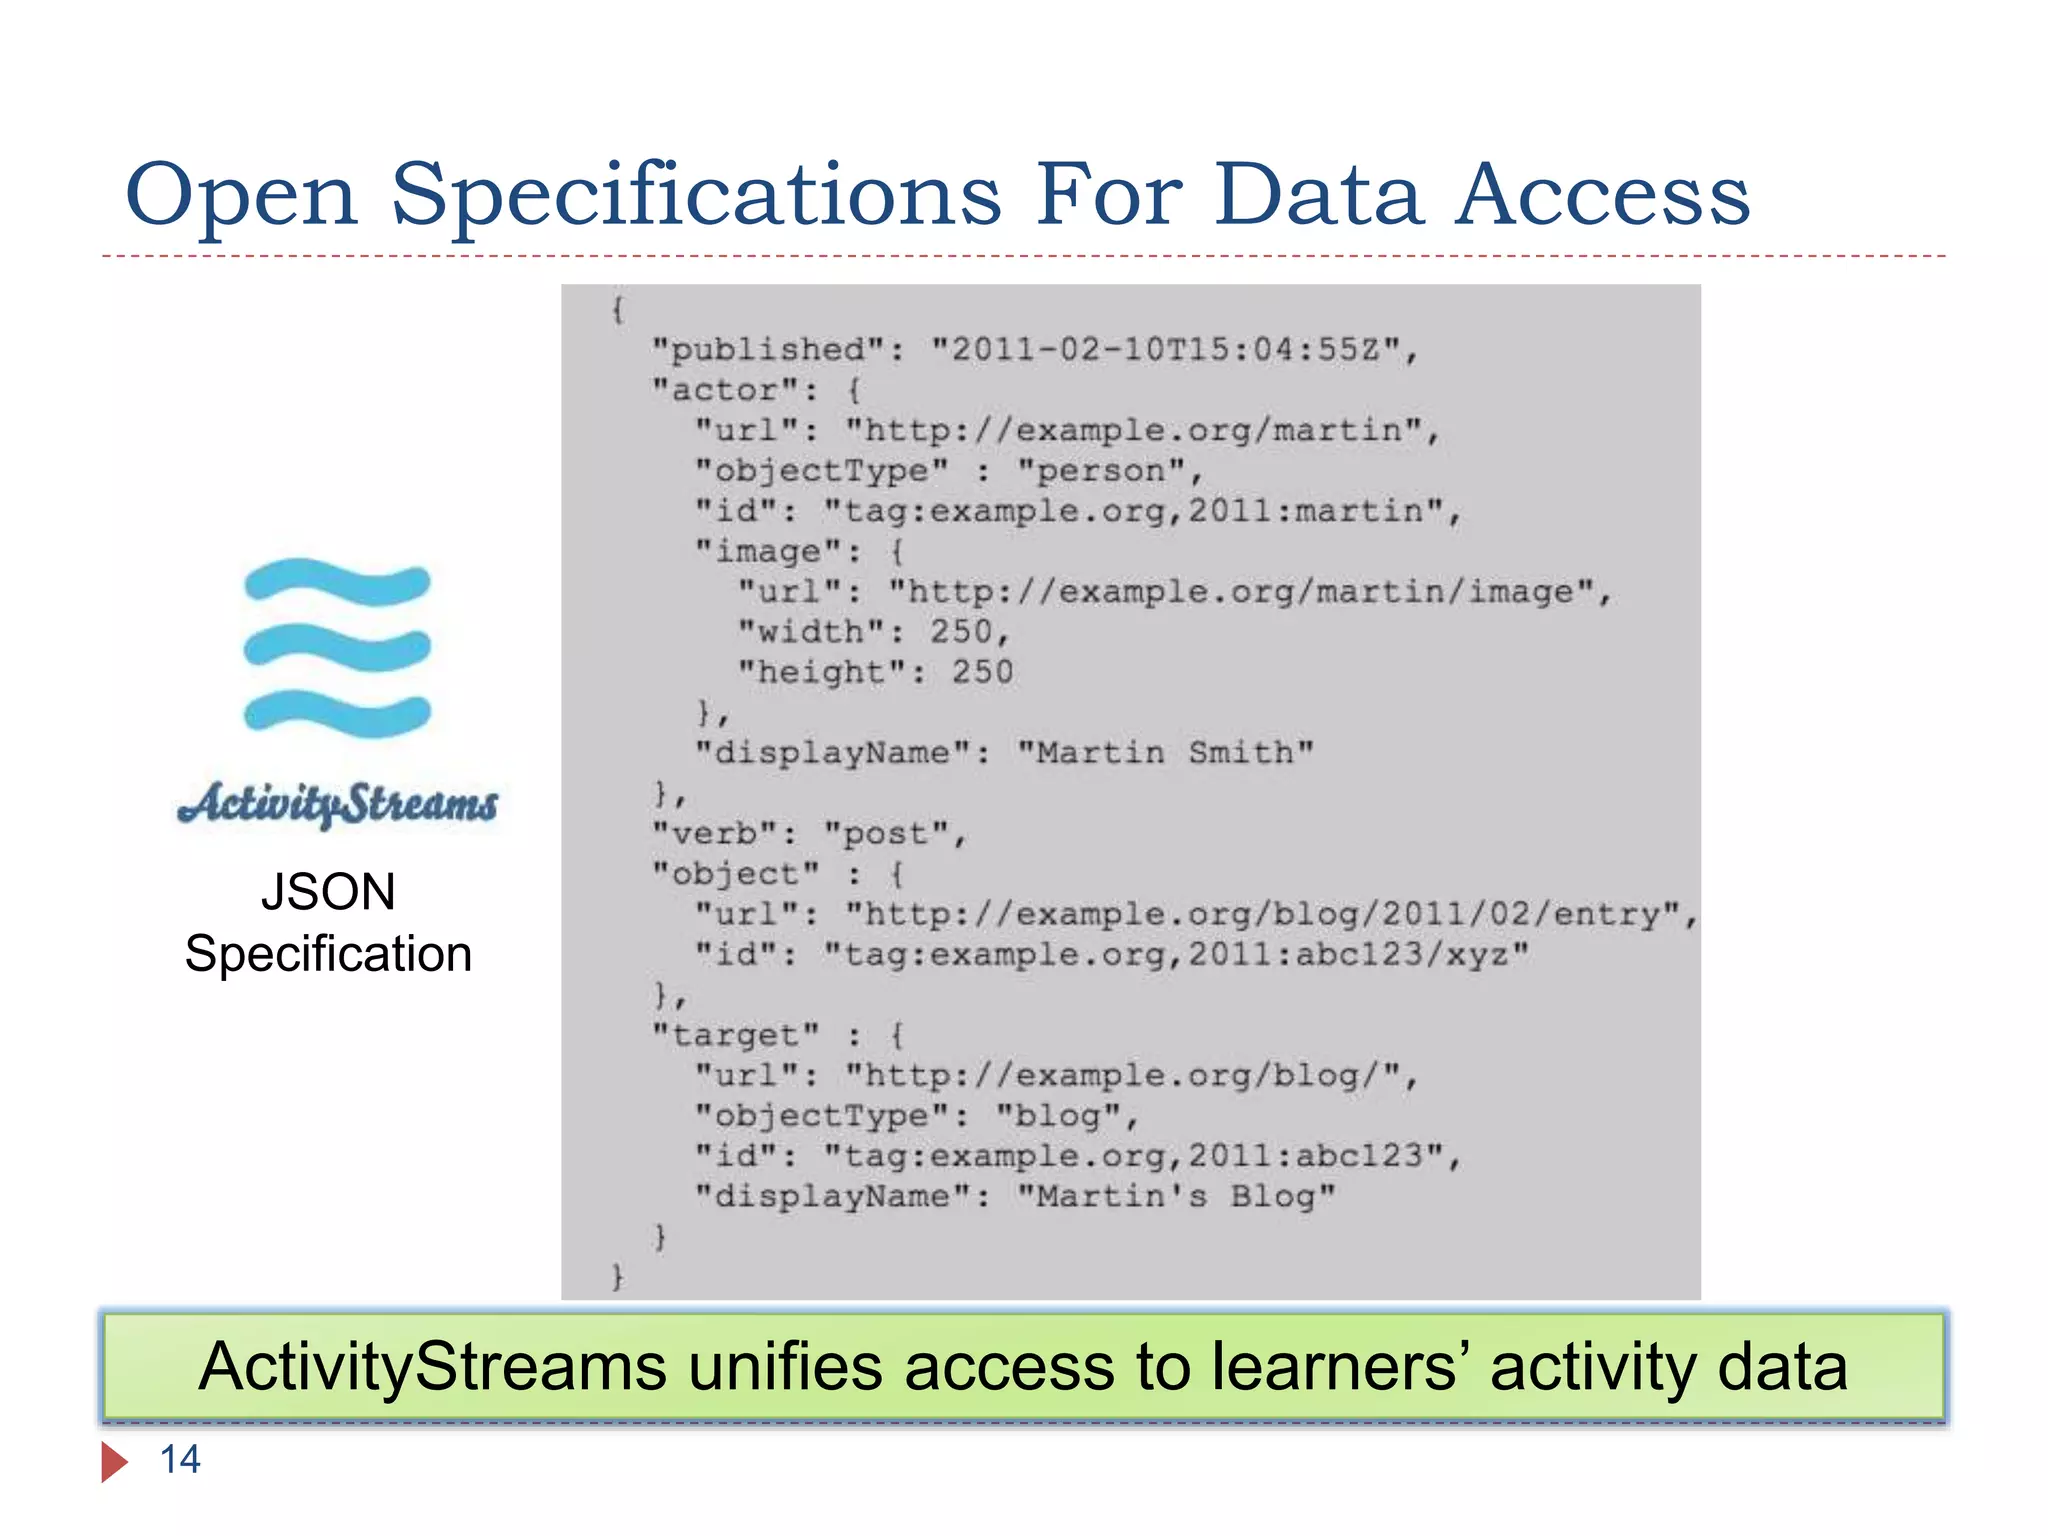
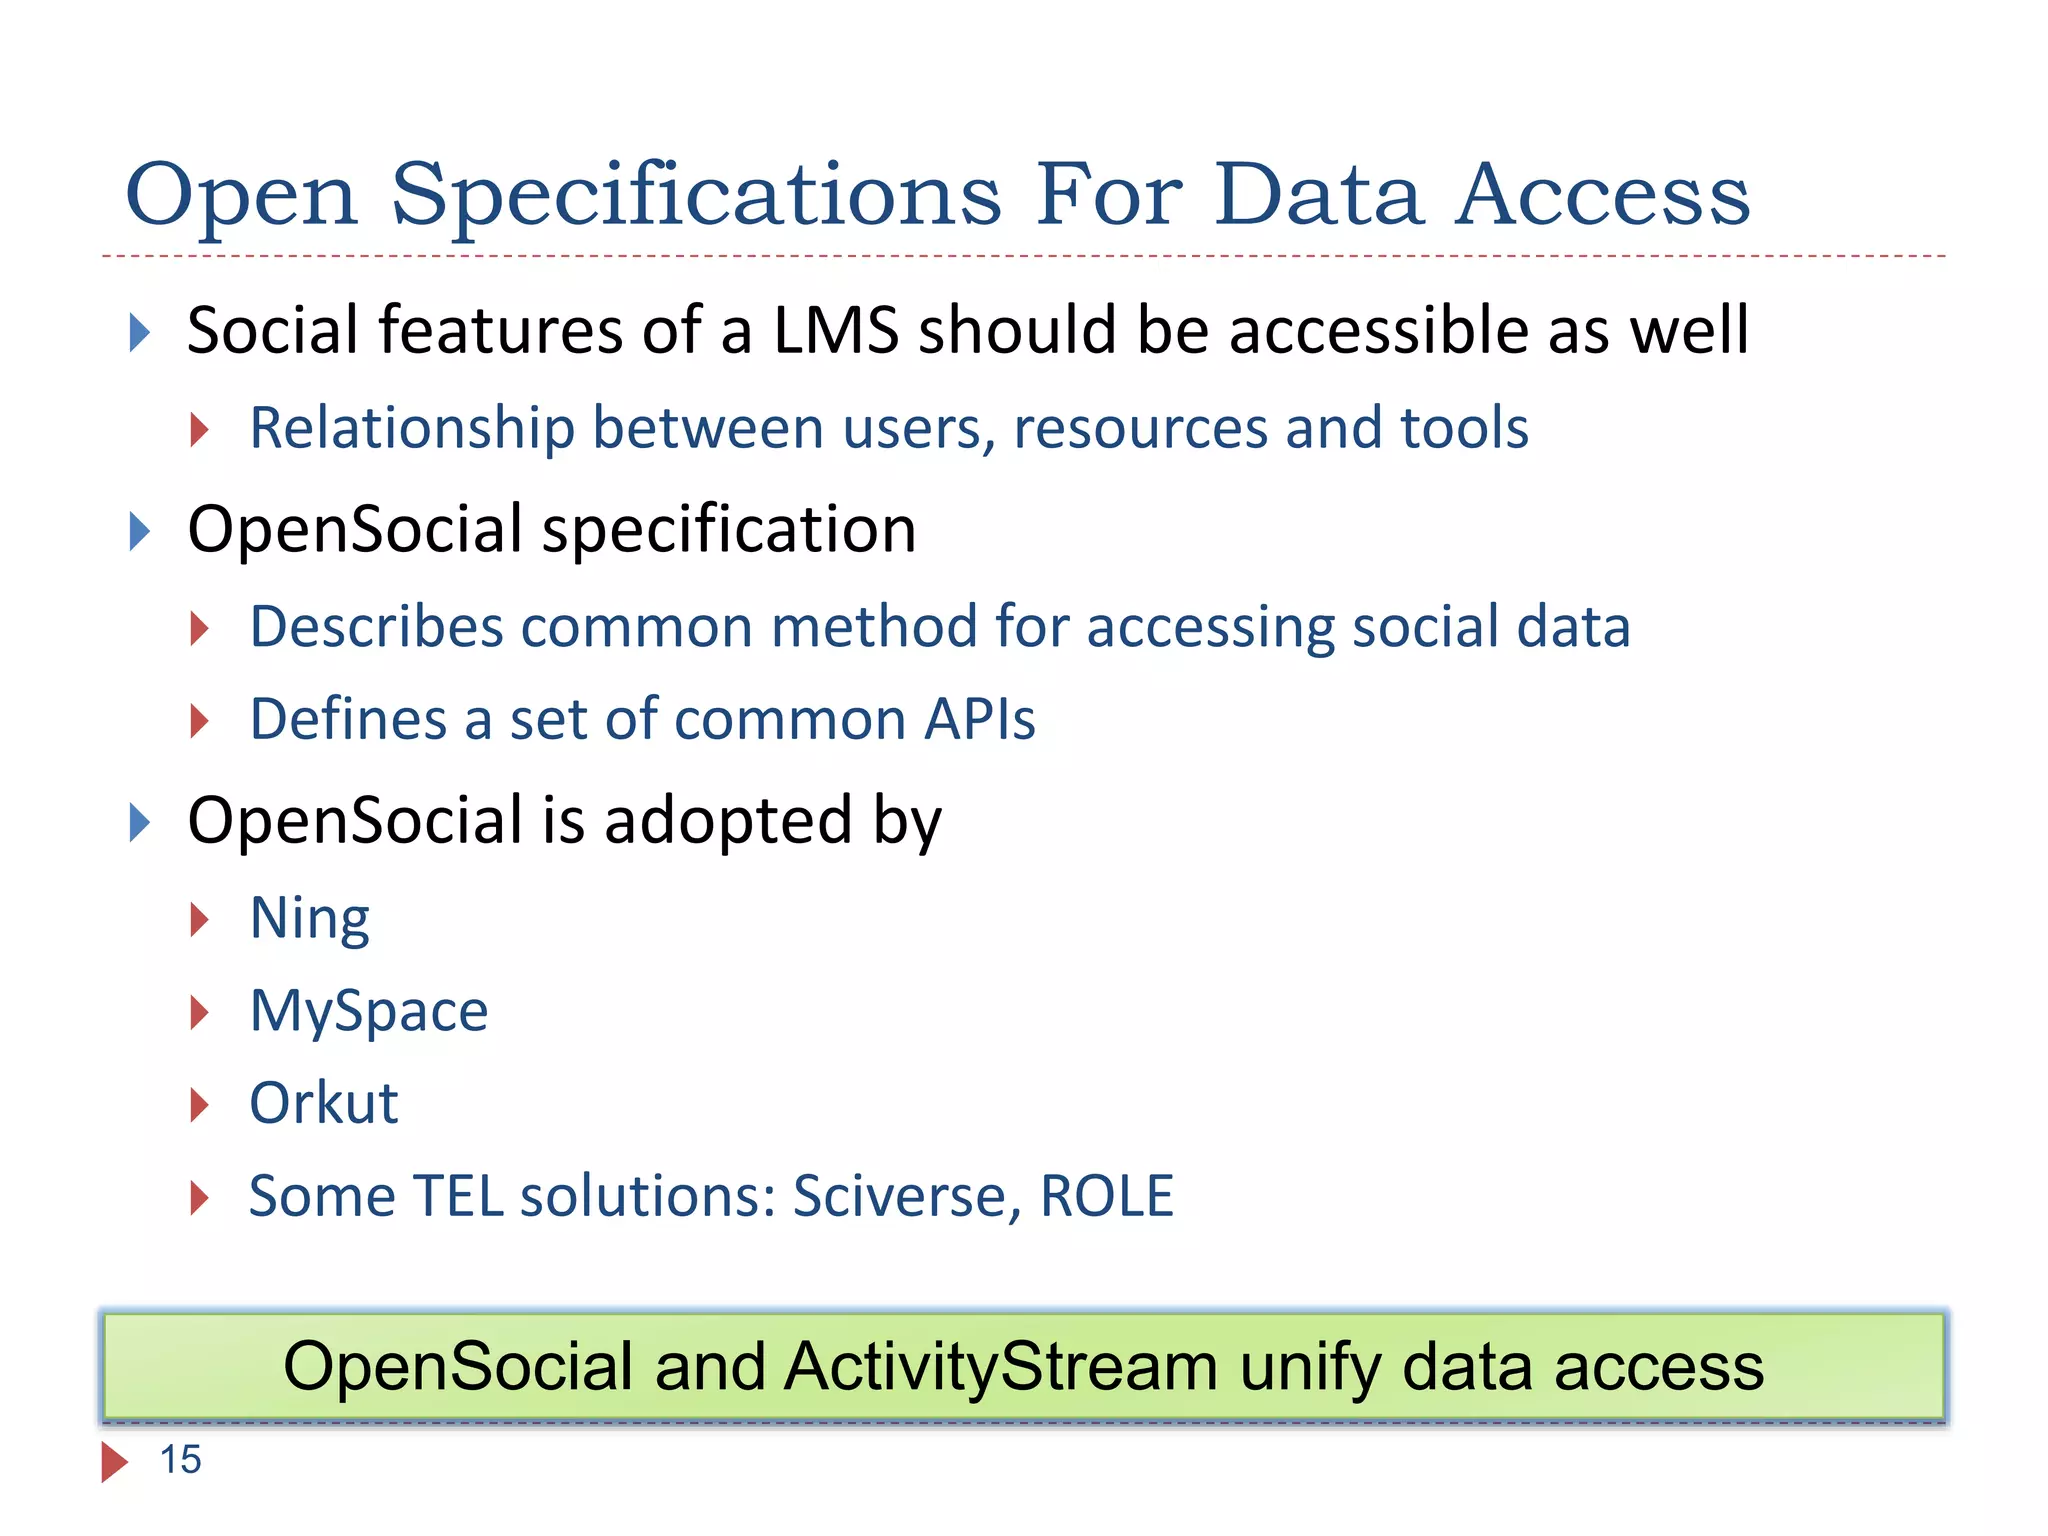
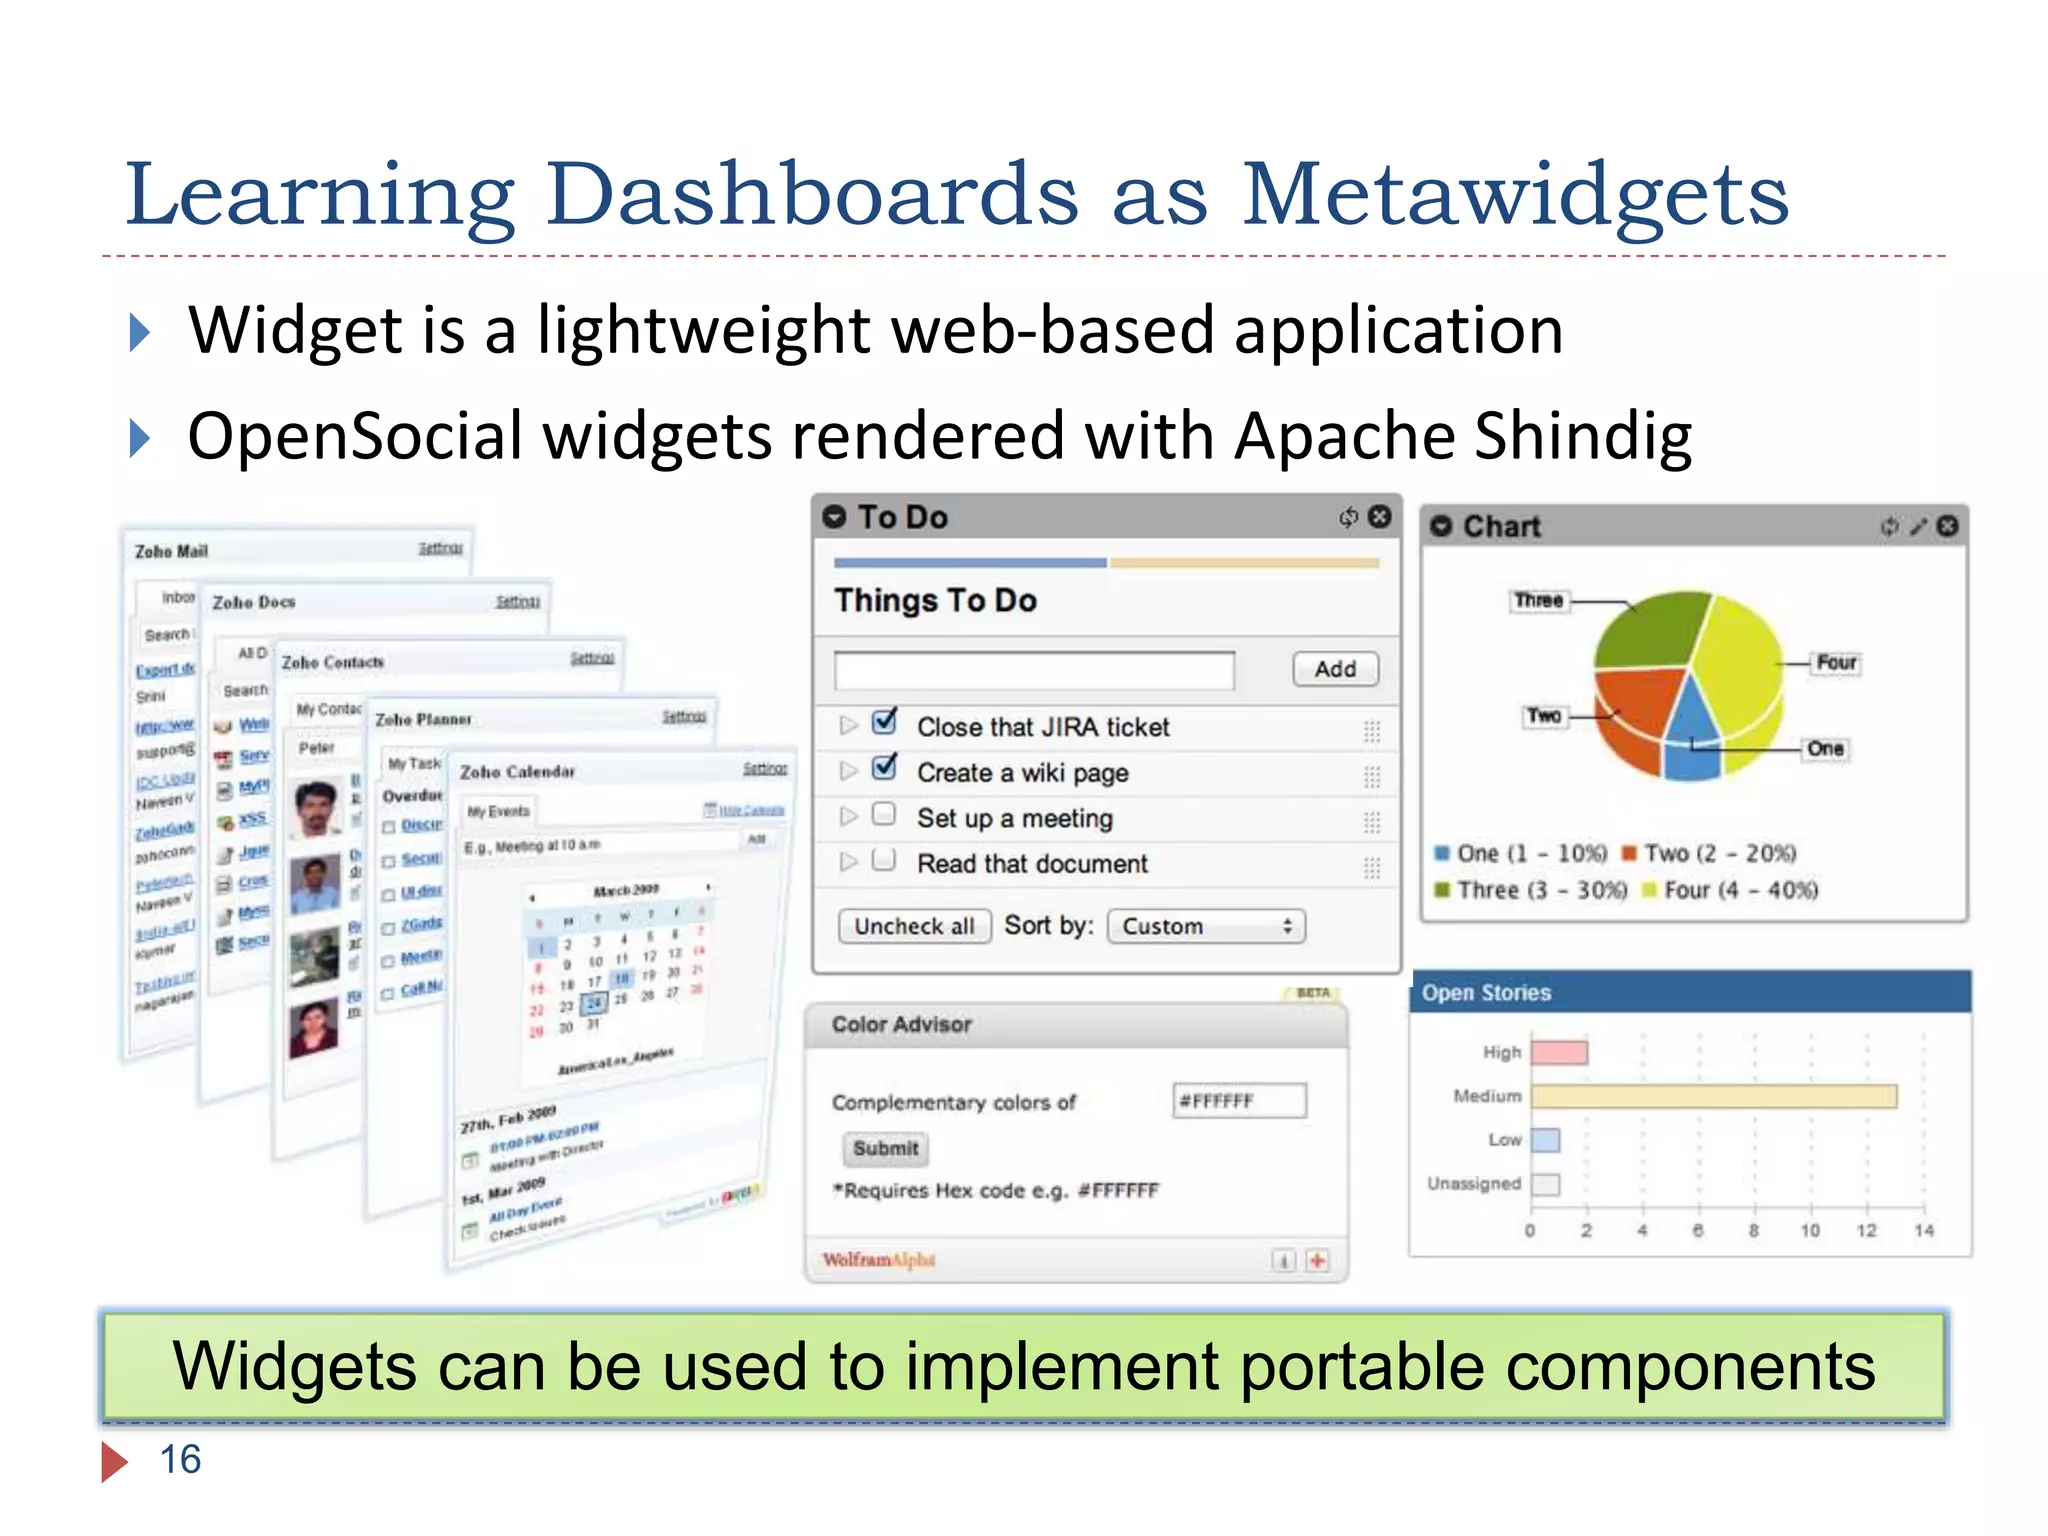
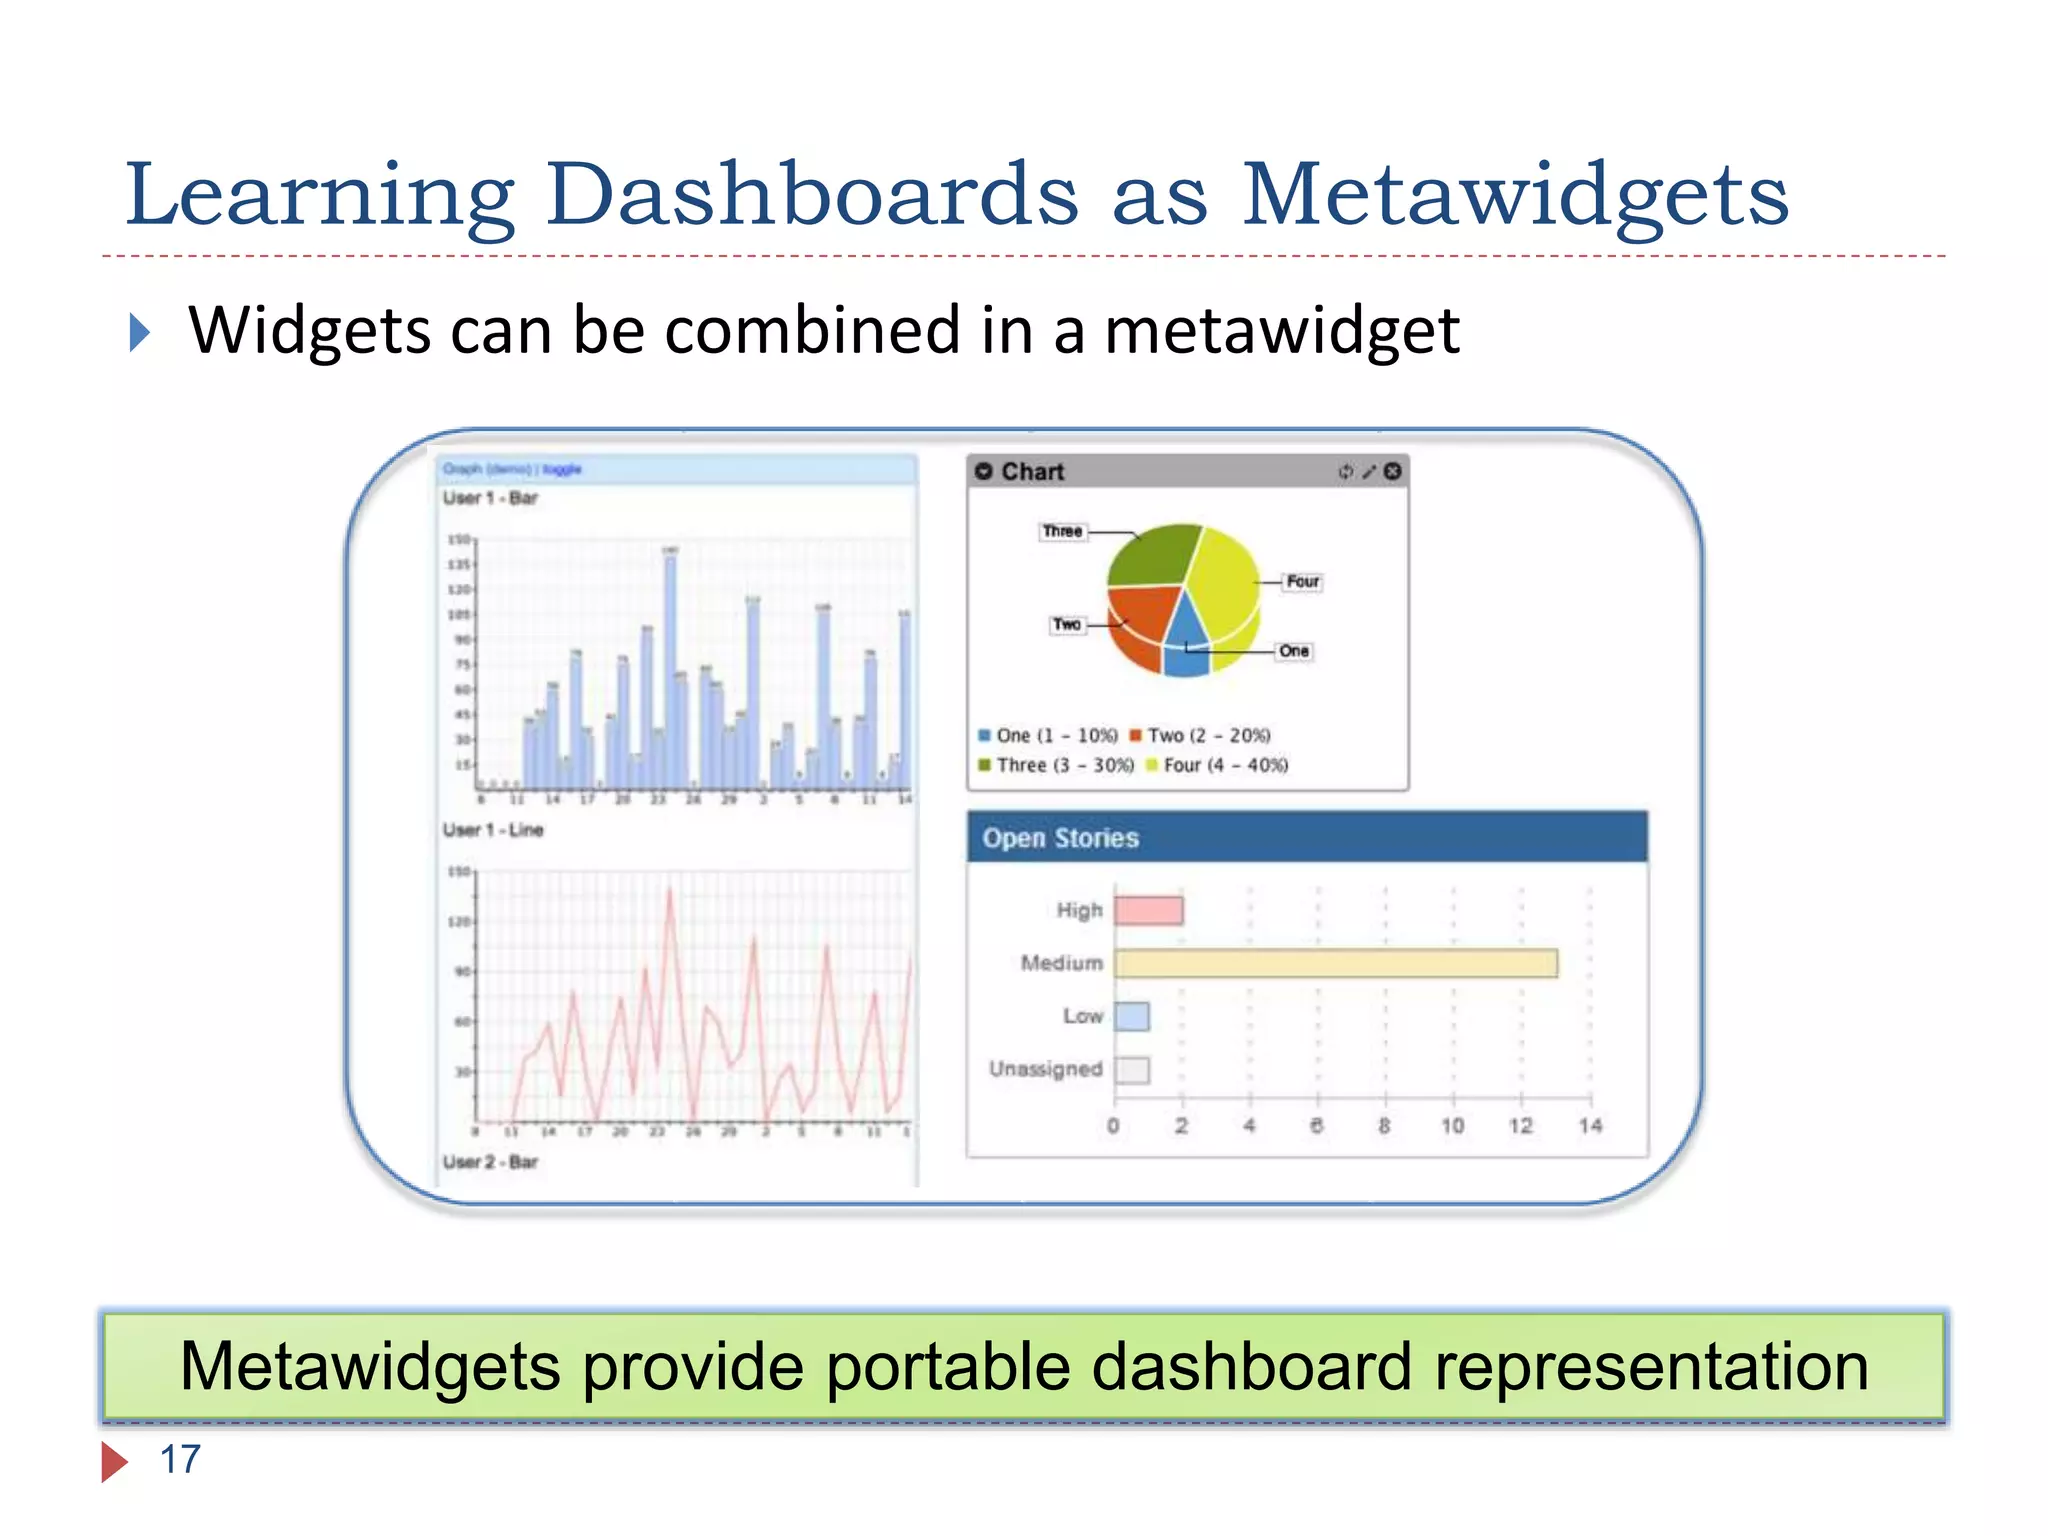
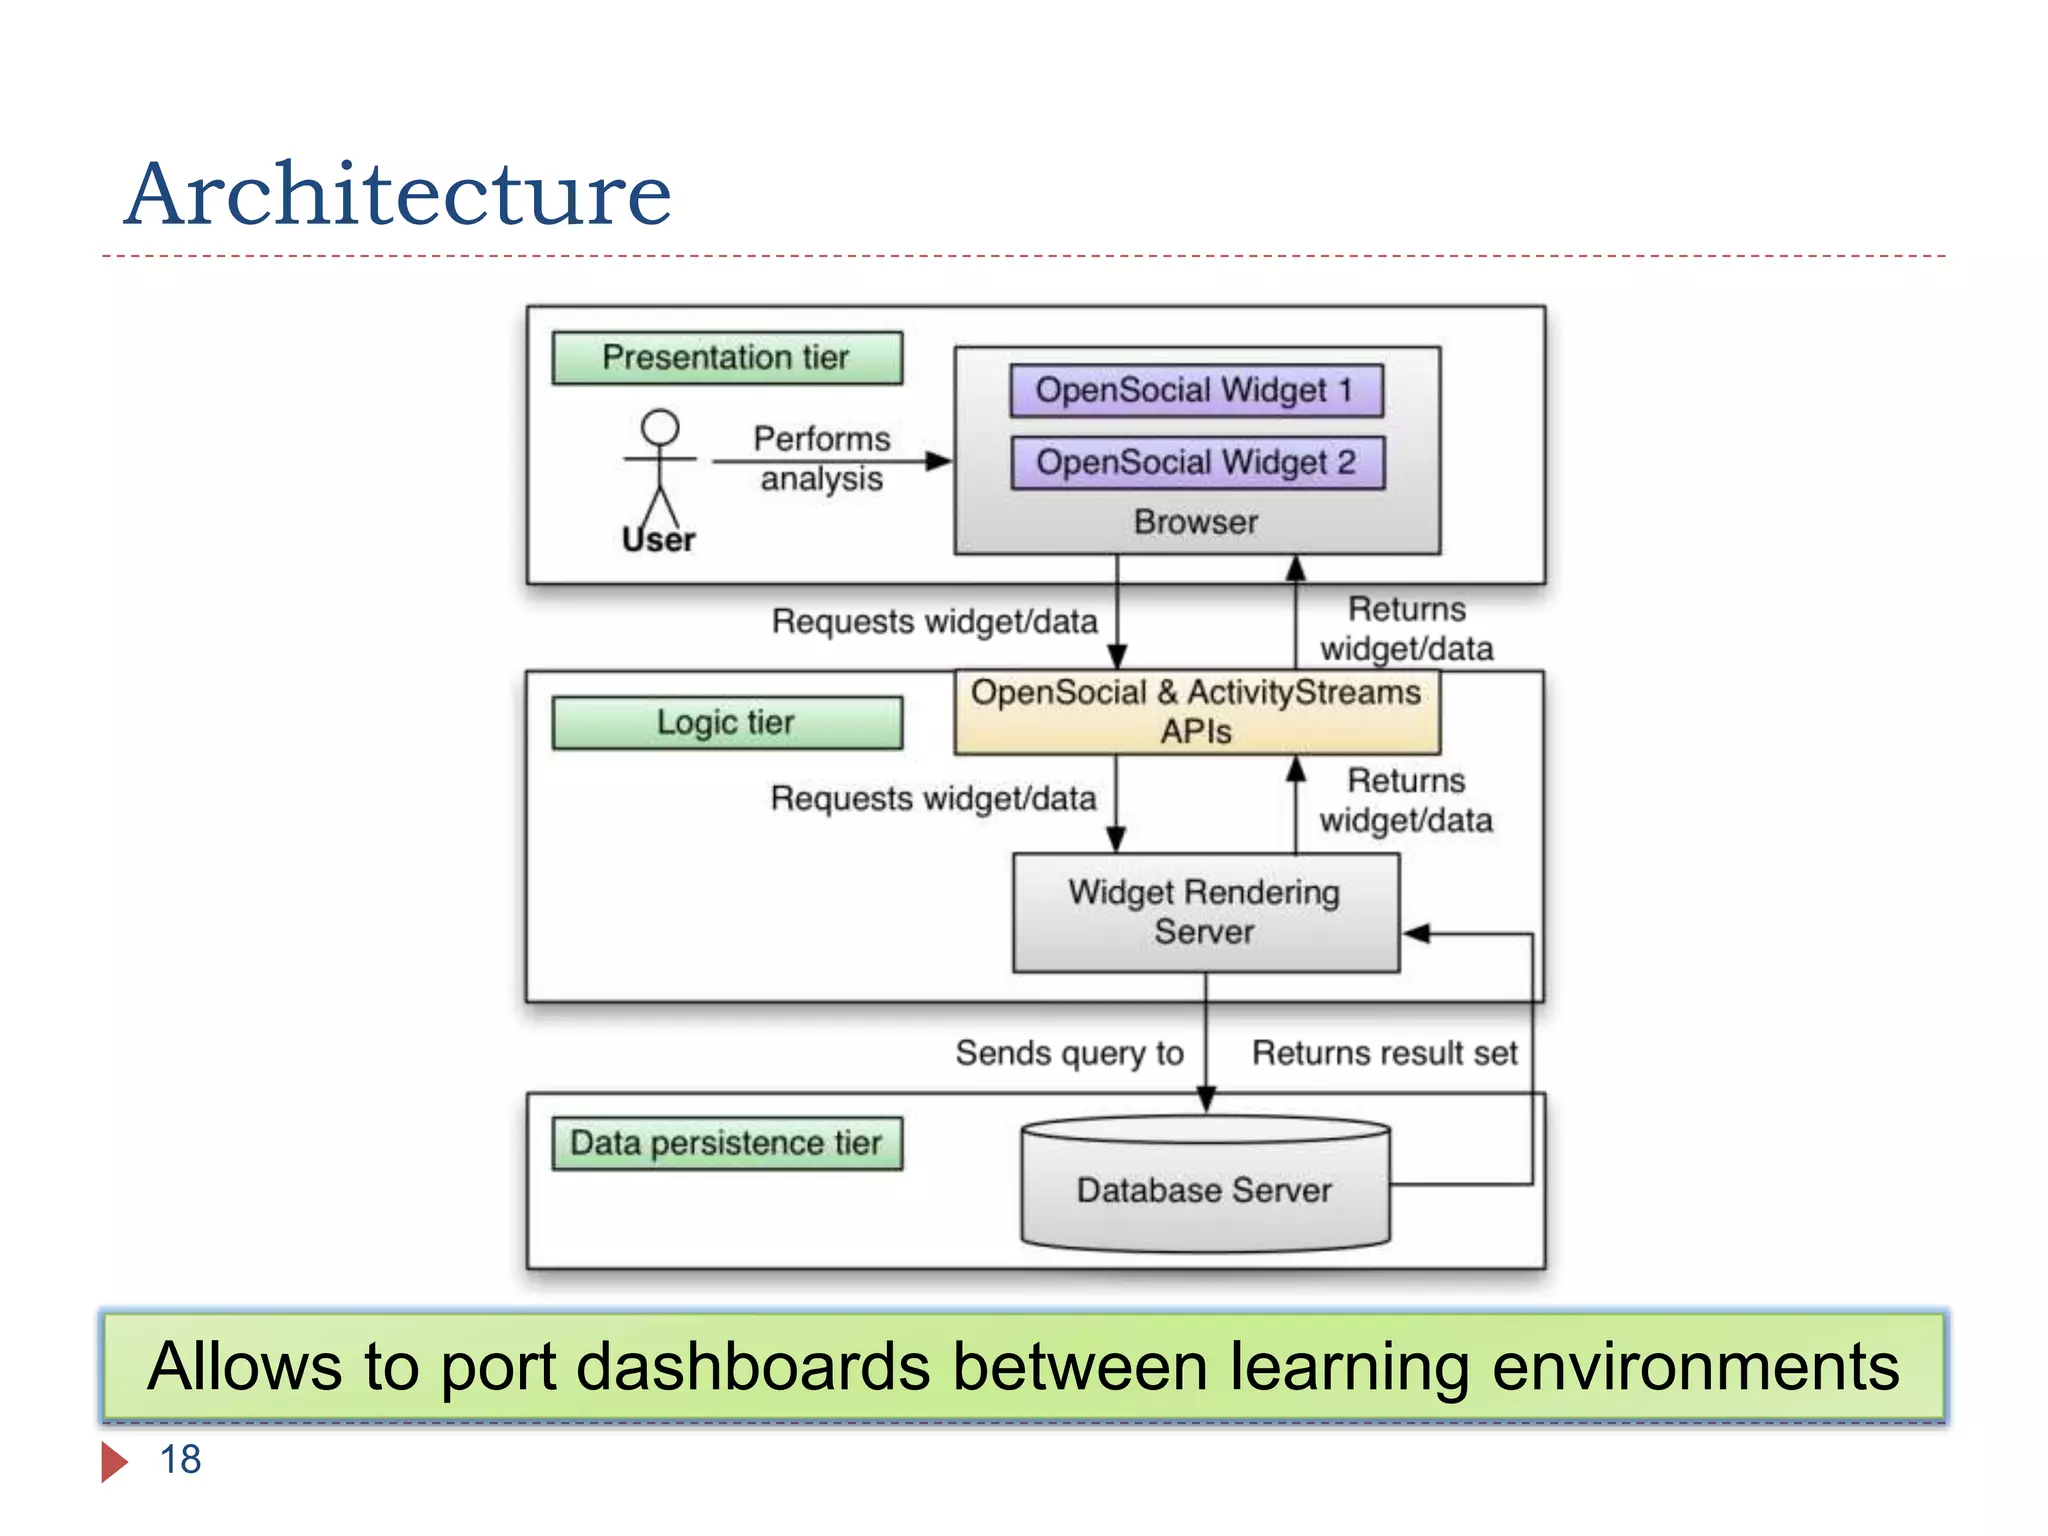
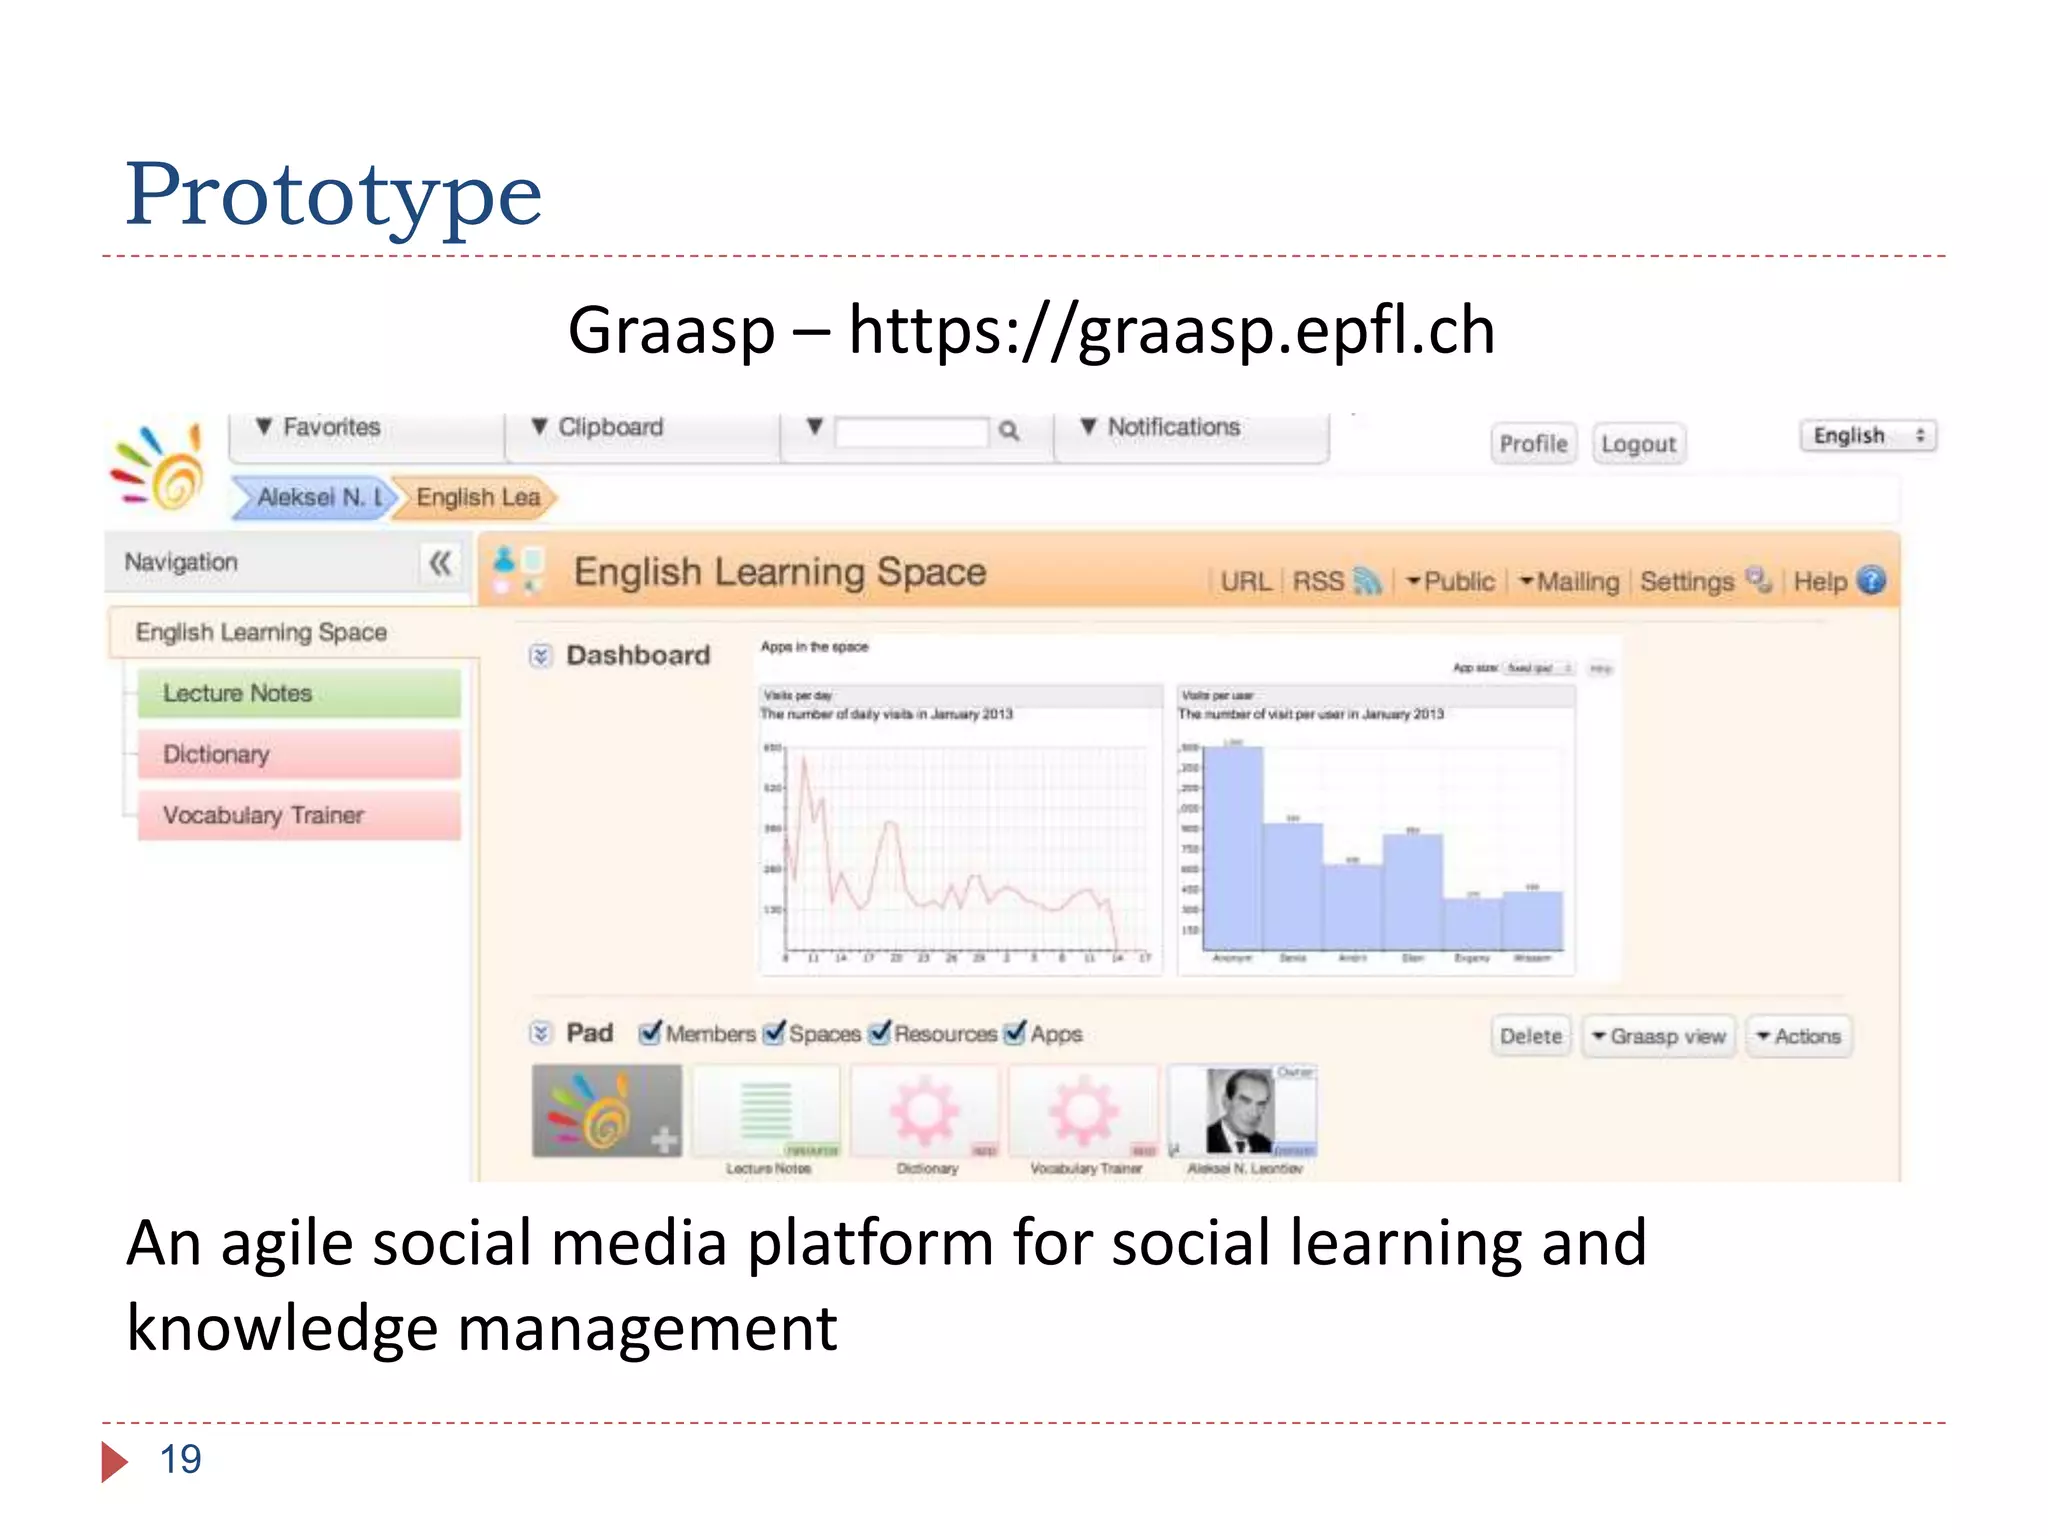
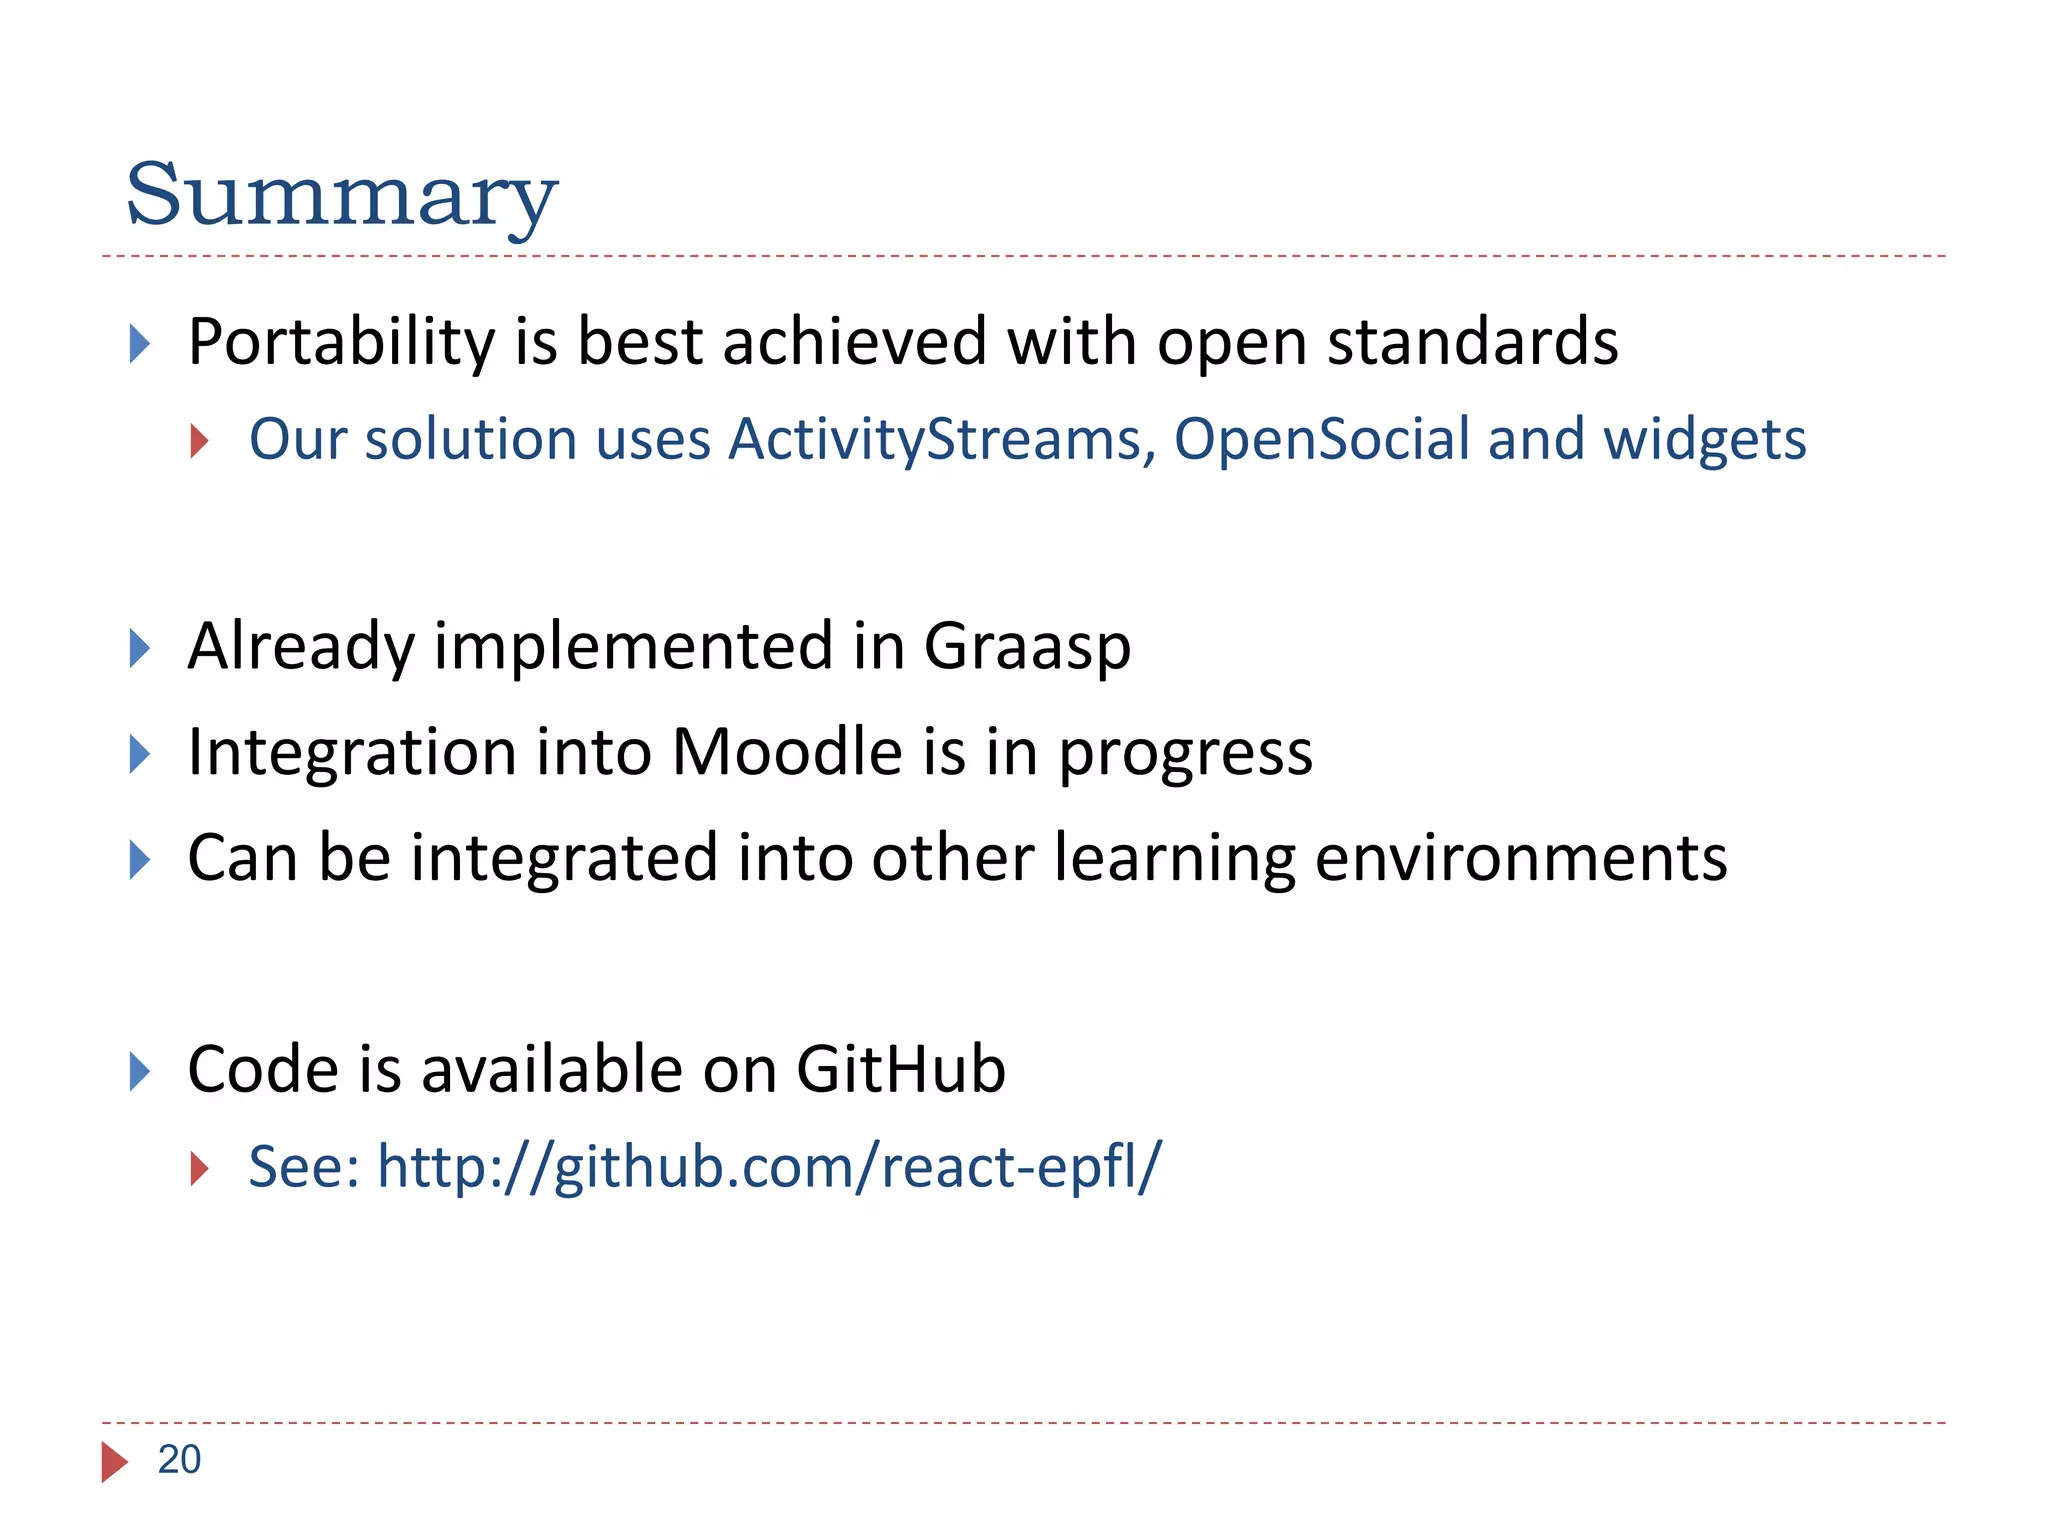
Towards Portable Learning Analytics
Dashboards
Andrii Vozniuk, Sten Govaerts, Denis Gillet
EPFL, Switzerland
July 15, 2013
ICALT Beijing
Technology Enhanced Learning
2
http://www.ypfp.org/classroom
From local to distributed
Technology Enhanced Learning
3
From well-defined to flexible
 Challenges
 Observe, control and adjust the learning process
 Consider individual capabilities and preferences
 Opportunities
 Remote education is mediated by a digital environment
 Learners leave a ‘digital footprint’
 Increasingly more traces can be recorded
 How to meet the challenges?
Technology Enhanced Learning
4
Data should be used to improve learning
 What is Learning Analytics
“LA is the measurement, collection, analysis and reporting
of data about learners in their context, for purposes of
understanding and optimizing learning and the environment
in which it occurs” – Siemens et. al.
 Examples
 Student drop out prediction systems
 Live statistics about the learners
 Individual progress vs group progress
Learning Analytics Dashboards
5
LA is becoming an essential component of a learning
system
Learning Analytics Dashboards
6
Blackboard
Learning Analytics Dashboards
7
Signals by Purdue
Learning Analytics Dashboards
8
Student Activity Meter by Leuven
Learning Analytics Dashboards
9
Google Analytics Dashboard
Dashboard is a popular way to represent LA
 What is portability?
“Software portability is the ability to run the same software on
different platforms with no or little effort”
 Why is analytics portability important?
 Switching the platform or using a few simultaneously
 Persisting the same learning analytics environment
 Portability prerequisites
 Access the data in the same way on different platforms
 Visually represent the UI components in the same way
Learning Analytics Portability
10
Unified data access and portable dashboard representation
 Tightly coupled LA solutions
 Developed for a specific platform, e.g. Blackboard
 Platform-specific, usually proprietary APIs
 Do not work on other platform
 Pluggable LA solutions
 Integrated into a platform via a plugin interface, e.g. Moodle
 Not compatible across platforms
 Standalone LA solutions
 General web analytics services, e.g. Google Analytics, Woopra
 Services developed specific for LA, e.g. CAM web service
Learning Analytics Architectures
11
Existing LA dashboards are barely portable
ActivityStreams
Open Specifications For Data Access
12
Open Specifications For Data Access
13
Activity Theory
ActivityStreams
Open Specifications For Data Access
14
ActivityStreams unifies access to learners’ activity data
JSON
Specification
Open Specifications For Data Access
15
OpenSocial and ActivityStream unify data access
 Social features of a LMS should be accessible as well
 Relationship between users, resources and tools
 OpenSocial specification
 Describes common method for accessing social data
 Defines a set of common APIs
 OpenSocial is adopted by
 Ning
 MySpace
 Orkut
 Some TEL solutions: Sciverse, ROLE
 Widget is a lightweight web-based application
 OpenSocial widgets rendered with Apache Shindig
Learning Dashboards as Metawidgets
16
Widgets can be used to implement portable components
 Widgets can be combined in a metawidget
Learning Dashboards as Metawidgets
17
Metawidgets provide portable dashboard representation
Architecture
18
Allows to port dashboards between learning environments
Prototype
19
Graasp – https://graasp.epfl.ch
An agile social media platform for social learning and
knowledge management
 Portability is best achieved with open standards
 Our solution uses ActivityStreams, OpenSocial and widgets
 Already implemented in Graasp
 Integration into Moodle is in progress
 Can be integrated into other learning environments
 Code is available on GitHub
 See: http://github.com/react-epfl/
Summary
20
21
Thank you for your attention!
Feedback & Question?
Andrii.Vozniuk@epfl.ch

Towards portable learning analytics dashboards - Andrii Vozniuk, Sten Govaerts, Denis Gillet

  • 1.
    Towards Portable LearningAnalytics Dashboards Andrii Vozniuk, Sten Govaerts, Denis Gillet EPFL, Switzerland July 15, 2013 ICALT Beijing
  • 2.
  • 3.
    Technology Enhanced Learning 3 Fromwell-defined to flexible
  • 4.
     Challenges  Observe,control and adjust the learning process  Consider individual capabilities and preferences  Opportunities  Remote education is mediated by a digital environment  Learners leave a ‘digital footprint’  Increasingly more traces can be recorded  How to meet the challenges? Technology Enhanced Learning 4 Data should be used to improve learning
  • 5.
     What isLearning Analytics “LA is the measurement, collection, analysis and reporting of data about learners in their context, for purposes of understanding and optimizing learning and the environment in which it occurs” – Siemens et. al.  Examples  Student drop out prediction systems  Live statistics about the learners  Individual progress vs group progress Learning Analytics Dashboards 5 LA is becoming an essential component of a learning system
  • 6.
  • 7.
  • 8.
  • 9.
    Learning Analytics Dashboards 9 GoogleAnalytics Dashboard Dashboard is a popular way to represent LA
  • 10.
     What isportability? “Software portability is the ability to run the same software on different platforms with no or little effort”  Why is analytics portability important?  Switching the platform or using a few simultaneously  Persisting the same learning analytics environment  Portability prerequisites  Access the data in the same way on different platforms  Visually represent the UI components in the same way Learning Analytics Portability 10 Unified data access and portable dashboard representation
  • 11.
     Tightly coupledLA solutions  Developed for a specific platform, e.g. Blackboard  Platform-specific, usually proprietary APIs  Do not work on other platform  Pluggable LA solutions  Integrated into a platform via a plugin interface, e.g. Moodle  Not compatible across platforms  Standalone LA solutions  General web analytics services, e.g. Google Analytics, Woopra  Services developed specific for LA, e.g. CAM web service Learning Analytics Architectures 11 Existing LA dashboards are barely portable
  • 12.
  • 13.
    Open Specifications ForData Access 13 Activity Theory ActivityStreams
  • 14.
    Open Specifications ForData Access 14 ActivityStreams unifies access to learners’ activity data JSON Specification
  • 15.
    Open Specifications ForData Access 15 OpenSocial and ActivityStream unify data access  Social features of a LMS should be accessible as well  Relationship between users, resources and tools  OpenSocial specification  Describes common method for accessing social data  Defines a set of common APIs  OpenSocial is adopted by  Ning  MySpace  Orkut  Some TEL solutions: Sciverse, ROLE
  • 16.
     Widget isa lightweight web-based application  OpenSocial widgets rendered with Apache Shindig Learning Dashboards as Metawidgets 16 Widgets can be used to implement portable components
  • 17.
     Widgets canbe combined in a metawidget Learning Dashboards as Metawidgets 17 Metawidgets provide portable dashboard representation
  • 18.
    Architecture 18 Allows to portdashboards between learning environments
  • 19.
    Prototype 19 Graasp – https://graasp.epfl.ch Anagile social media platform for social learning and knowledge management
  • 20.
     Portability isbest achieved with open standards  Our solution uses ActivityStreams, OpenSocial and widgets  Already implemented in Graasp  Integration into Moodle is in progress  Can be integrated into other learning environments  Code is available on GitHub  See: http://github.com/react-epfl/ Summary 20
  • 21.
    21 Thank you foryour attention! Feedback & Question? Andrii.Vozniuk@epfl.ch

Editor's Notes

  • #2 Good morning, I’m happy to see you all here, thanks for coming. My name is Andrii Vozniuk, I’m from REACT lab of Federal Polytechnic school in Lausanne, Switzerland.
  • #3 Nowadays we observe a change (a shift) happening in the way we learn. Education transforms from having a well-defined and constrained path to more individual and flexible. Education is also becoming increasingly distributed (global) in nature. With the recent raise of MOOCs and other distance learning technologies, taking courses outside of the associated institution is becoming a common practice.
  • #4 Nowadays we observe a change (a shift) happening in the way we learn. Education transforms from having a well-defined and constrained path to more individual and flexible. Education is also becoming increasingly distributed (global) in nature. With the recent raise of MOOCs and other distance learning technologies, taking courses outside of the associated institution is becoming a common practice. This shift creates new challenges that need to be addressed. It becomes much harder for teachers to observe, control and adjust the learning process. For instance, in the MOOCs it is simply impossible for a teacher to consider individual capabilities and preferences of each learner. But together with challenges there come opportunities. These days remote learning is usually mediated by a digital media which makes it possible to observe learning process in details. This observation is usually done by tracking actions of students in a learning platform and generates their digital traces. A natural intentions is to collect this data and use it to improve learning. [Now there is a common understanding that data should be used to improve learning] Increasingly more digital tools are being used in a classroom, which allow to collect traces of students Leveraging educational data
  • #5 This shift creates new challenges that need to be addressed. It becomes much harder for teachers to observe, control and adjust the learning process. For instance, in the MOOCs it is simply impossible for a teacher to consider individual capabilities and preferences of each learner. But together with challenges there come opportunities. These days remote learning is usually mediated by a digital media which makes it possible to observe learning process in details. This observation is usually done by tracking actions of students in a learning platform and recording their digital traces. A natural intentions is to collect this data and use it to improve the learning. [Now there is a common understanding that data should be used to improve learning] Increasingly more digital tools are being used in a classroom, which allow to collect traces of students Leveraging educational data
  • #6 That’s exactly the goal of recently emerging field of learning analytics. So what is learning analytics? According to Siements et. al. LA is “the measurement, collection, analysis and reporting of data about learners in their context, for purposes of understanding and optimizing learning and the environment in which it occurs”. There is a strict definition of the LA on the slide but what it says is that the goal is to make use of the data to improve learning. Such an improvement could possibly be an early prediction of a drop out, or just informing the teacher regarding progress of a class, or just showing to student their performance compared to the distribution of a class to make them more aware of their results. Numerous studies show that integrating learning analytics into the learning process could improve the outcome. But existing popular online learning management systems (LMSs) and personalized learning environments (PLEs) lack or provide limited LA dashboards. Let’s have a look how LA component is integrated into existing learning systems. TODO: LA component often comes in a form of a learning dashboard – show few examples Self-monitoring for learners Awareness for teachers and administration It works
  • #7 And indeed it is being integrated in one way or another into existing learning systems. For example, here we see Blackboard, a popular system. It has a learning component. Here we show an example of a component to increase student’s awareness and motivate them by showing their progress relatively to the progress of classmates.
  • #8 Another example is a Moodog plugin for Moodle which presents visualization of student activities based on Moodle logs. TODO: Replace with Purdue signals
  • #9 That’s exactly the goal of recently emerging field of learning analytics. So what is learning analytics? According to Siements et. al. LA is “the measurement, collection, analysis and reporting of data about learners in their context, for purposes of understanding and optimizing learning and the environment in which it occurs”. There is a strict definition of the LA on the slide but what it says is that the goal is to make use of the data to improve learning. Such an improvement could possibly be an early prediction of a drop out, or just informing the teacher regarding progress of a class, or just showing to student their performance compared to the distribution of a class to make them more aware of their results. Numerous studies show that integrating learning analytics into the learning process could improve the outcome. But existing popular online learning management systems (LMSs) and personalized learning environments (PLEs) lack or provide limited LA dashboards. Let’s have a look how LA component is integrated into existing learning systems. TODO: LA component often comes in a form of a learning dashboard – show few examples Self-monitoring for learners Awareness for teachers and administration
  • #10 TODO: higher resolution And the third example that I would like to show is Google Analytics, which is often used for online courses to monitor student behaviour. The common between the demonstrated approaches and actually the common way to deploy analytics is to build an analytic dashboard. Summary: Existing learning dashboards are barely portable: once deployed on a learning platform, it requires considerable effort to deploy the dashboard elsewhere.
  • #11  Some configuration might still be required Cost is considerably lower than building from scratch Why portability? Portability offers freedom Openness leads to better adoption understand the concept of portable learning dashboards, we first define software portability in general. Software portability is the ability to run the same software on different platforms with no or little effort. Some configuration of LA tools on a new platform might still be required but its cost is considerably lower than developing the tools from scratch. Our goal is to achieve portability be implementing learning dashboards as external pluggable components and using well-defined interfaces with a learning platform. TODO: should better explain why portability is important. Now it’s hard to understand why we are working on this problem. Learning system perspectives: Structural View Dynamic View
  • #12 TODO: Add three images with blocks to show different types of architectures Our goal Implement LA dashboard as a pluggable component Use standardized and open interfaces with the platform Hence learning systems are extended with plugins or augment Summary: Existing learning dashboards are barely portable: once deployed on a learning platform, it requires considerable effort to deploy the dashboard elsewhere. Ecosystem lock-in Data is locked Analysis tools are locked
  • #13 In order for LA tools to function, a learning platform must provide access to its stored data. Such data represents dynamic (behavioural) and static (structural) views of the platform.
  • #14 In order for LA tools to function, a learning platform must provide access to its stored data. Such data represents dynamic (behavioural) and static (structural) views of the platform.
  • #15 In order for LA tools to function, a learning platform must provide access to its stored data. Such data represents dynamic (behavioural) and static (structural) views of the platform.
  • #17 TODO: Visualize widgets and metawidgets
  • #18 TODO: Visualize widgets and metawidgets
  • #19 Classical three tiers Built upon open standards Can work for existing systems Customizable
  • #20 TODO: Ask Evgeny regarding support of OpenSocial in Moodle
  • #21 To sum up, we are strong believers that the openness and portability of learning analytics tools will increase their adoption. We also believe that to make a solution (architecture) adopted it is required to build it upon open standards. Existing learning dashboards don’t promote are barely portable: once deployed on a learning platform, it requires considerable effort to deploy the dashboard elsewhere. Hence in this talk we proposed a novel approach to build and deploy learning analytics dashboards in multiple learning environments. Our approach allows to port dashboards with no additional cost between learning environments that implement open specifications (OpenSocial and ActivityStreams) for data access and use widget APIs. We suggest constructing dashboards from lightweight web applications, namely widgets. We propose to facilitate reuse by sharing the dashboards and widgets via a centralized analytics repository. TODO: what the systems that wants to make a use of it will need to do?