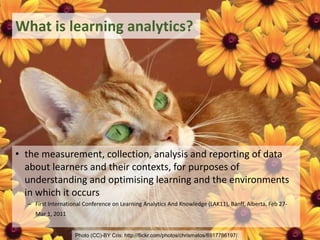
Downloaded 28 times


![Photo (CC)-BY-NC-SA tim_d https://www.flickr.com/photos/tim_d/184018928
7
“The most important single factor
influencing learning is what the learner
already knows. Ascertain this and teach
[them] accordingly.”
– David Ausubel, 1968](https://image.slidesharecdn.com/2014-10skolverket-dougclow-141010031508-conversion-gate02/85/Learning-Analytics-A-General-Introduction-and-Perspectives-from-the-UK-7-320.jpg)


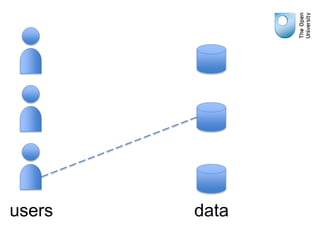
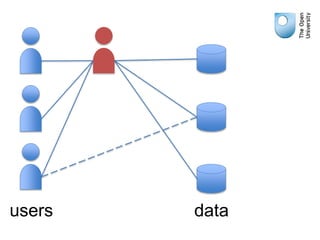
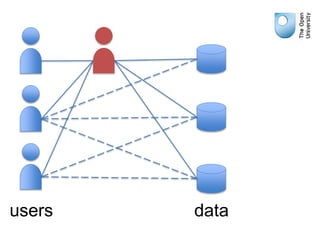


The document is a presentation by Dr. Doug Clow from the Open University discussing learning analytics, which involves the measurement and analysis of data concerning learners to optimize their learning experiences in the UK educational context. It highlights the role of predictive modeling in identifying at-risk students and the importance of ethics, privacy, and transparency in using educational data. The presentation also emphasizes the collaborative nature of learning analytics initiatives and the commitment to improving educational outcomes through data-driven insights.


