Downloaded 65 times


![INFORMATION VISUALIZATION
INFO. VIS.
“ Using visual representations and interaction techniques,
which take advantage of the human eye’s
broad bandwidth pathway into the mind,
to allow users to see, explore, and understand
large amounts of information at once.”
[Wikipedia]](https://image.slidesharecdn.com/kristwinfovisintroexport2-120918105300-phpapp02/85/Information-Visualization-for-Knowledge-Discovery-12-320.jpg)


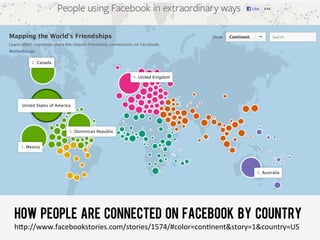


This document discusses information visualization and its uses for knowledge discovery through visual representations of data and user interactions. It provides examples of visualizations of different data types, such as maps, networks, temporal data. Visualizations can benefit data analysis by helping detect patterns and trends, and aid presentation by helping communicate information. However, they also carry drawbacks if used to mislead. The document promotes visualization tools like ManyEyes for collaborative data analysis.


