Download as PDF, PPTX


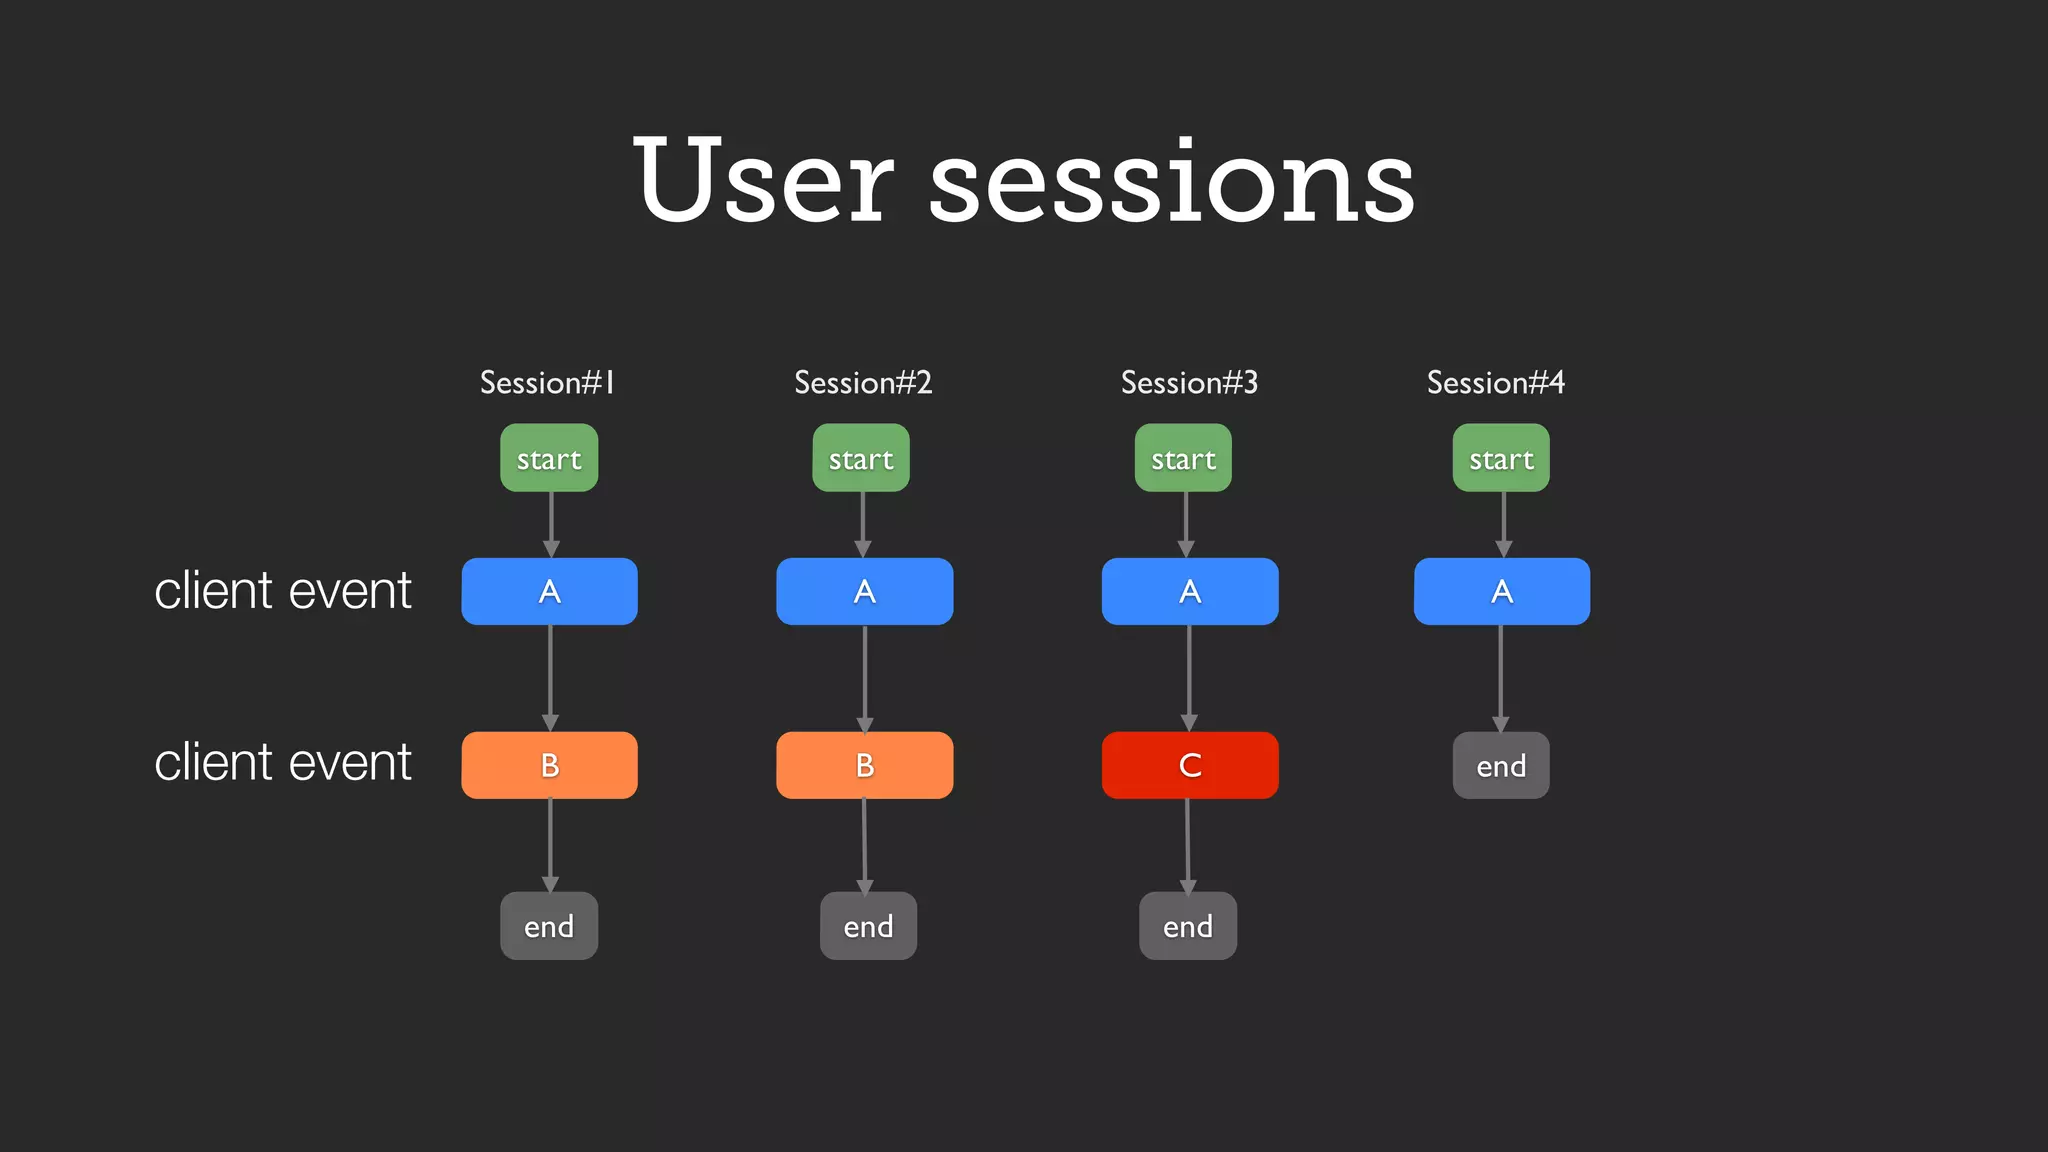
![log event a.k.a. “client event”
[Lee et al. 2012]](https://image.slidesharecdn.com/kristwds101datavisshared-150120114806-conversion-gate02/75/Data-Visualization-A-Quick-Tour-for-Data-Science-Enthusiasts-72-2048.jpg)
![log event a.k.a. “client event”
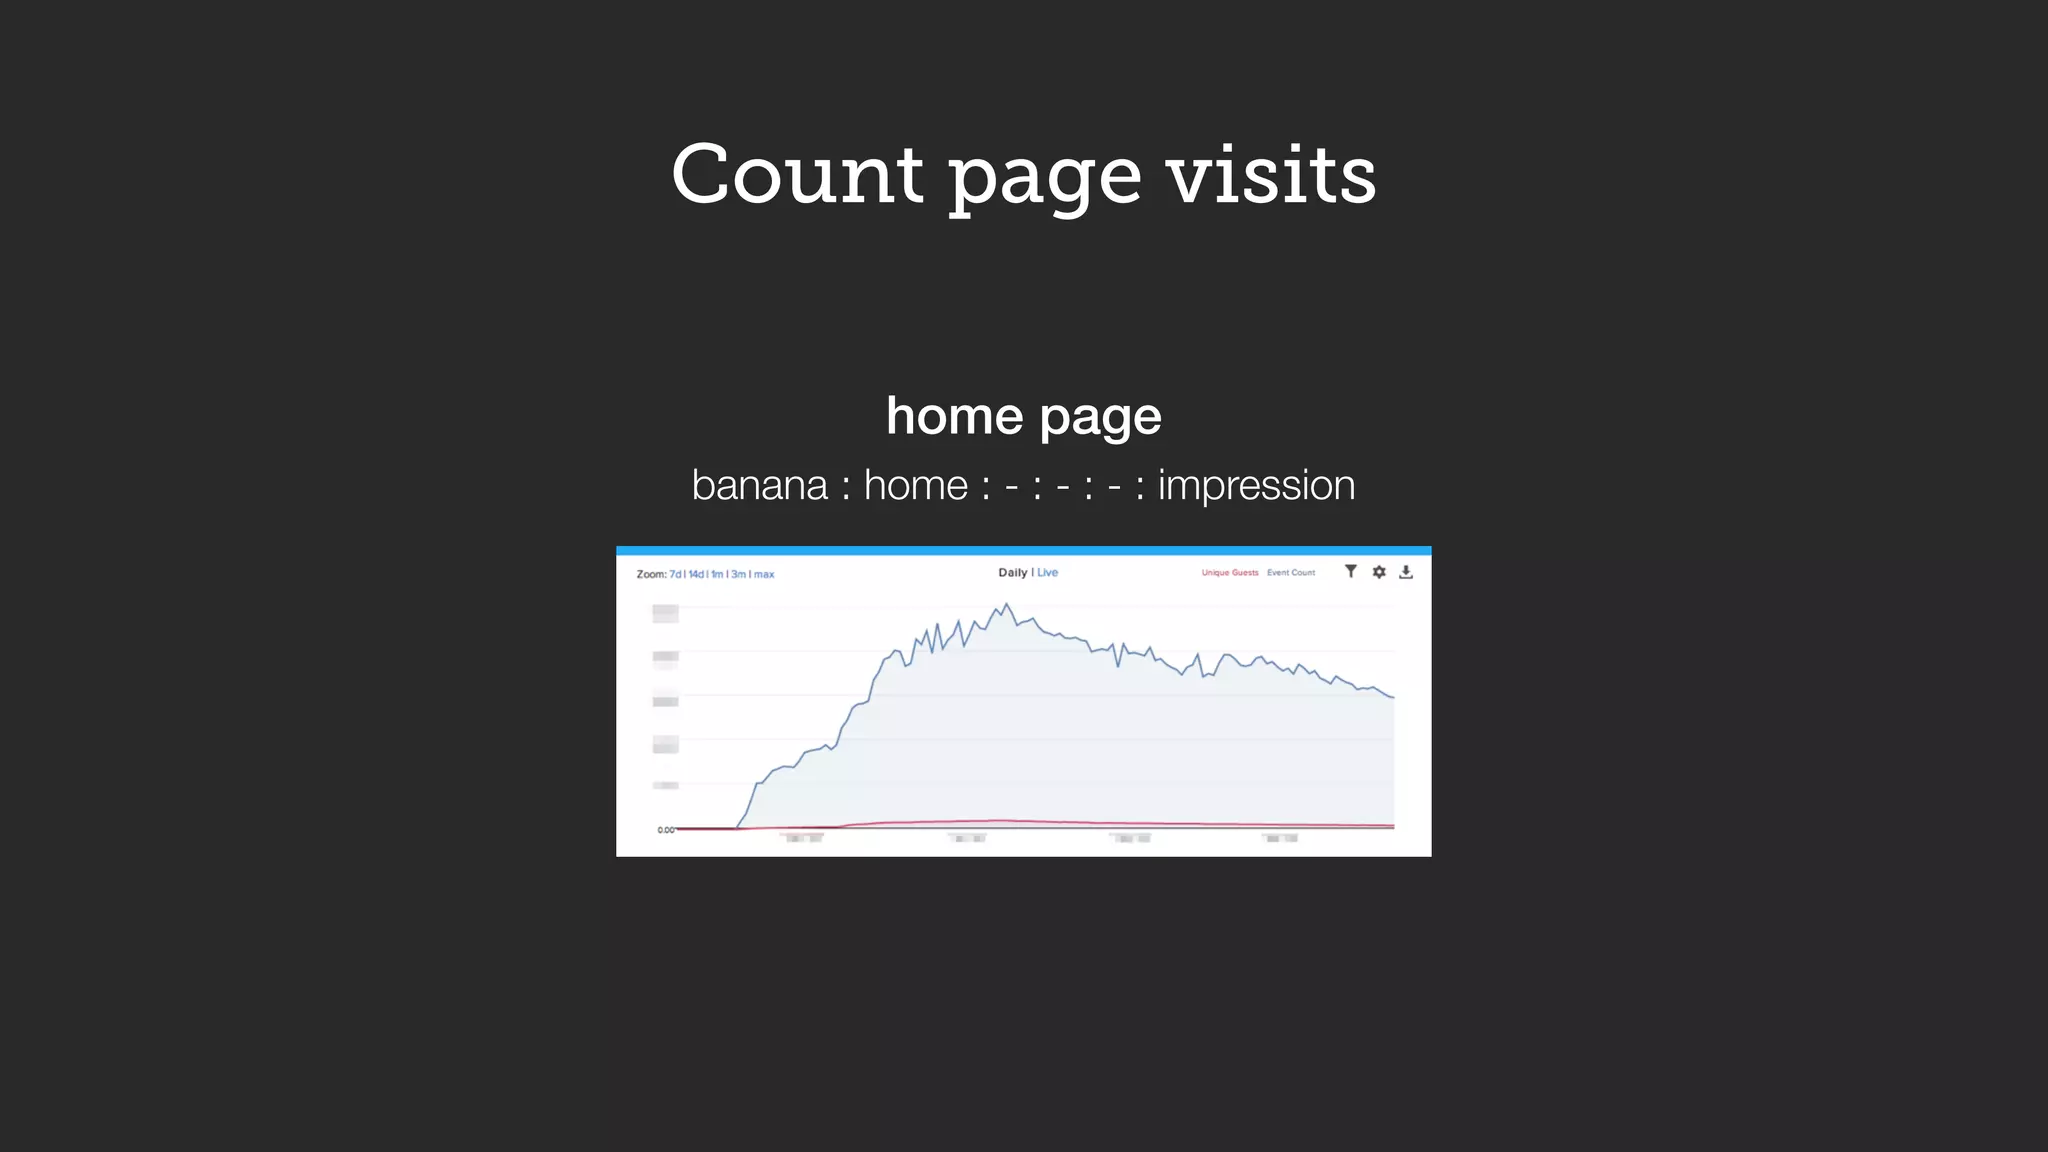
client : page : section : component : element : action
web : home : timeline : tweet_box : button : tweet
1) User ID
2) Timestamp
3) Event name
4) Event detail
[Lee et al. 2012]](https://image.slidesharecdn.com/kristwds101datavisshared-150120114806-conversion-gate02/75/Data-Visualization-A-Quick-Tour-for-Data-Science-Enthusiasts-73-2048.jpg)


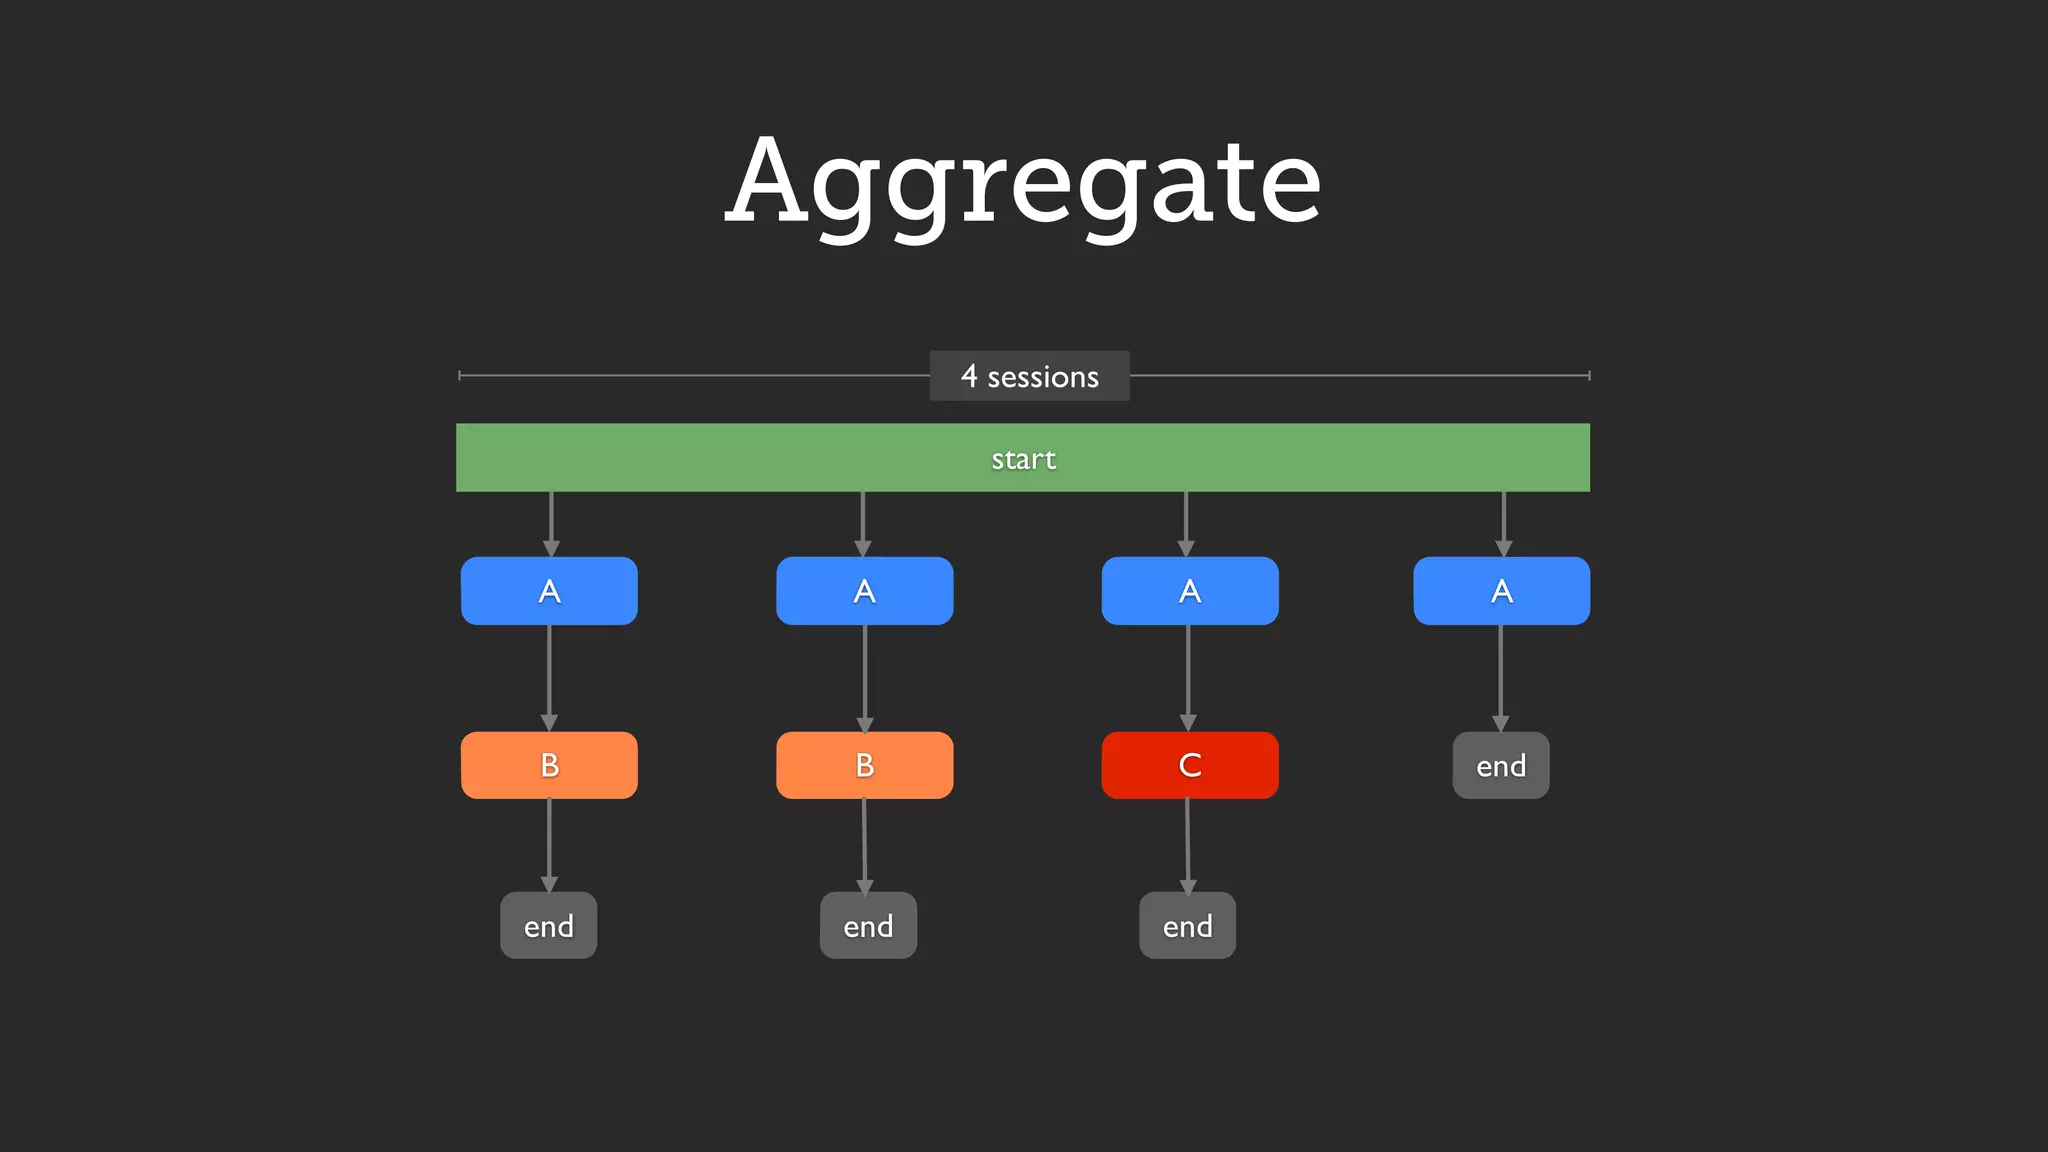


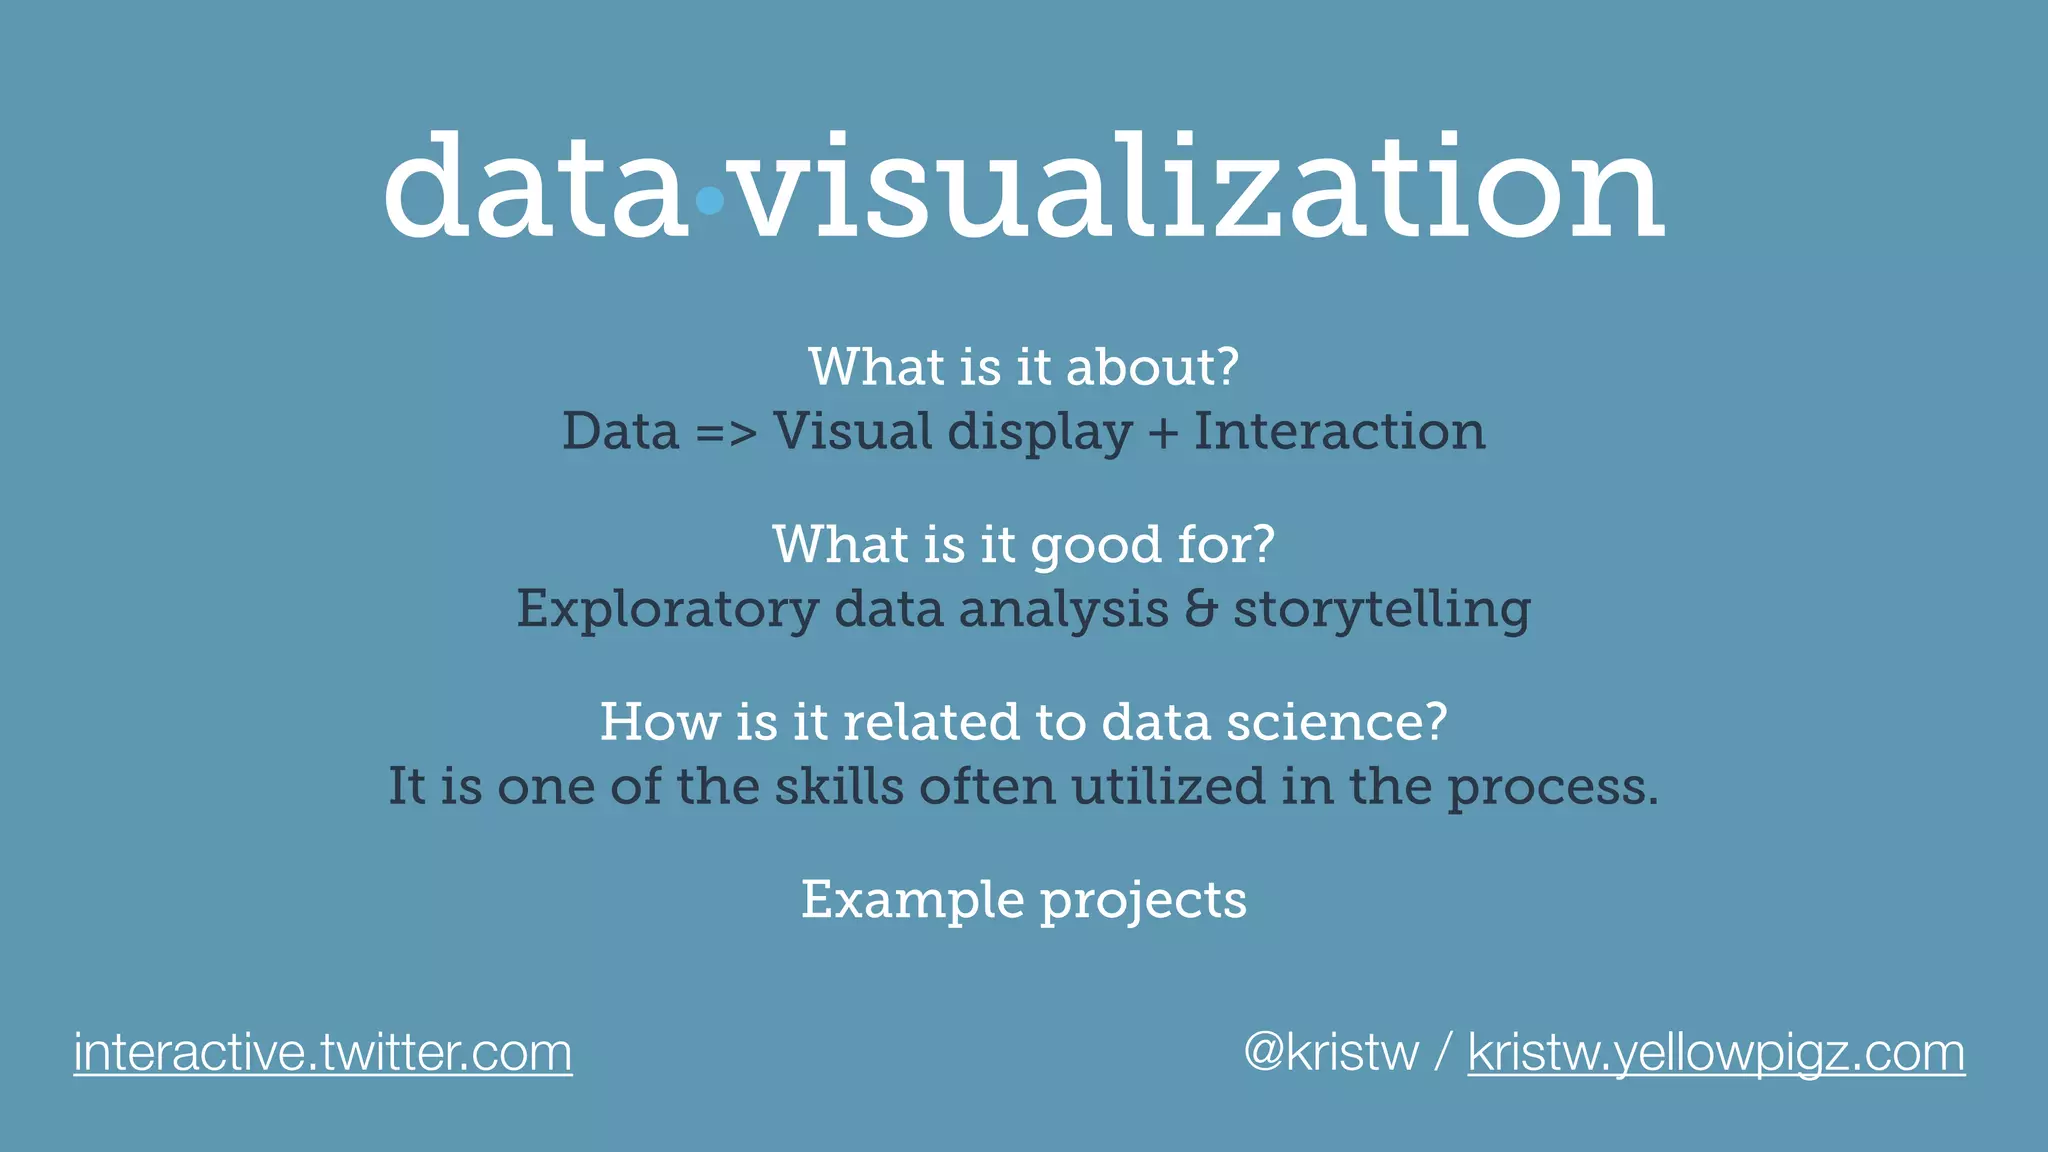


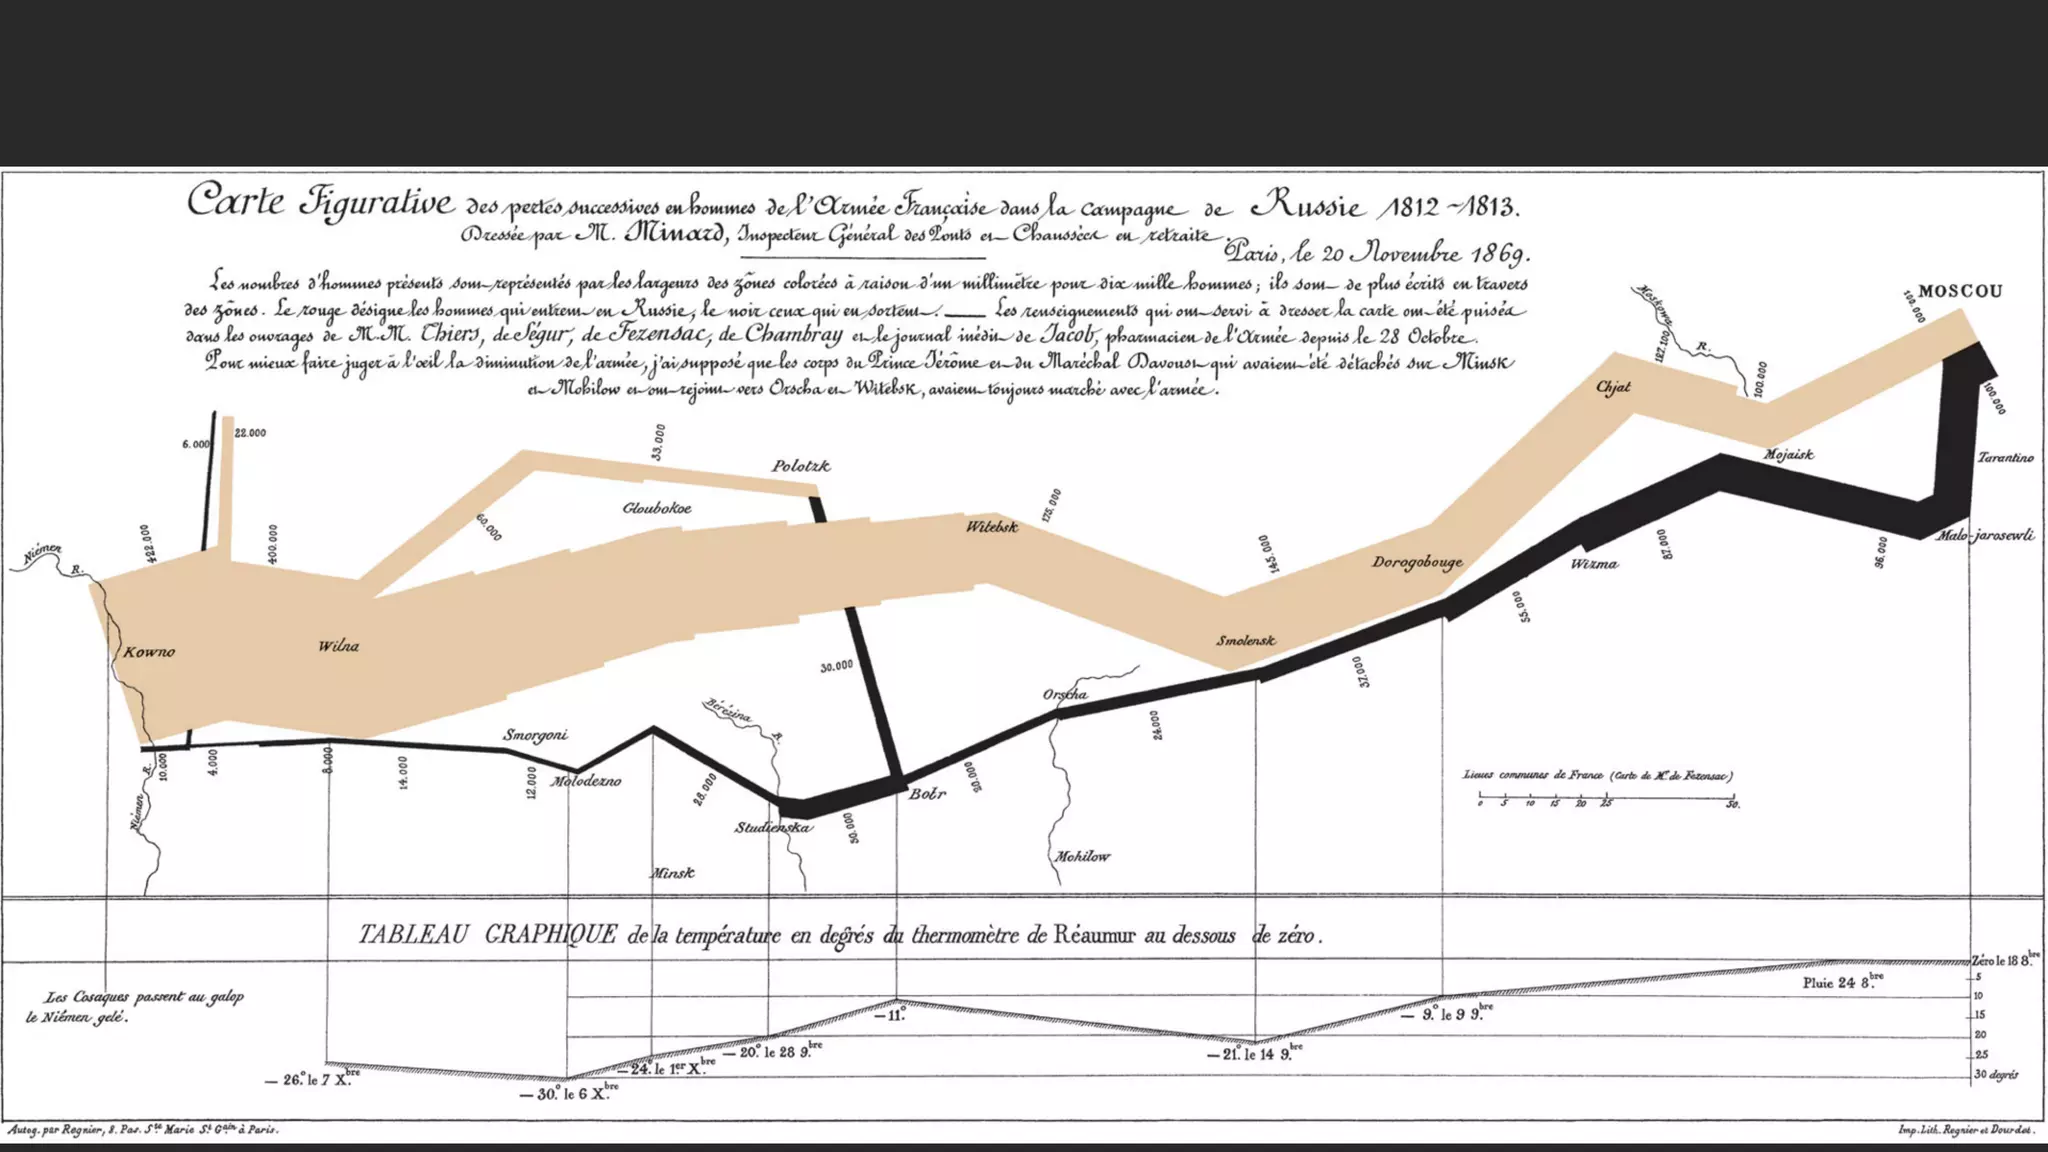
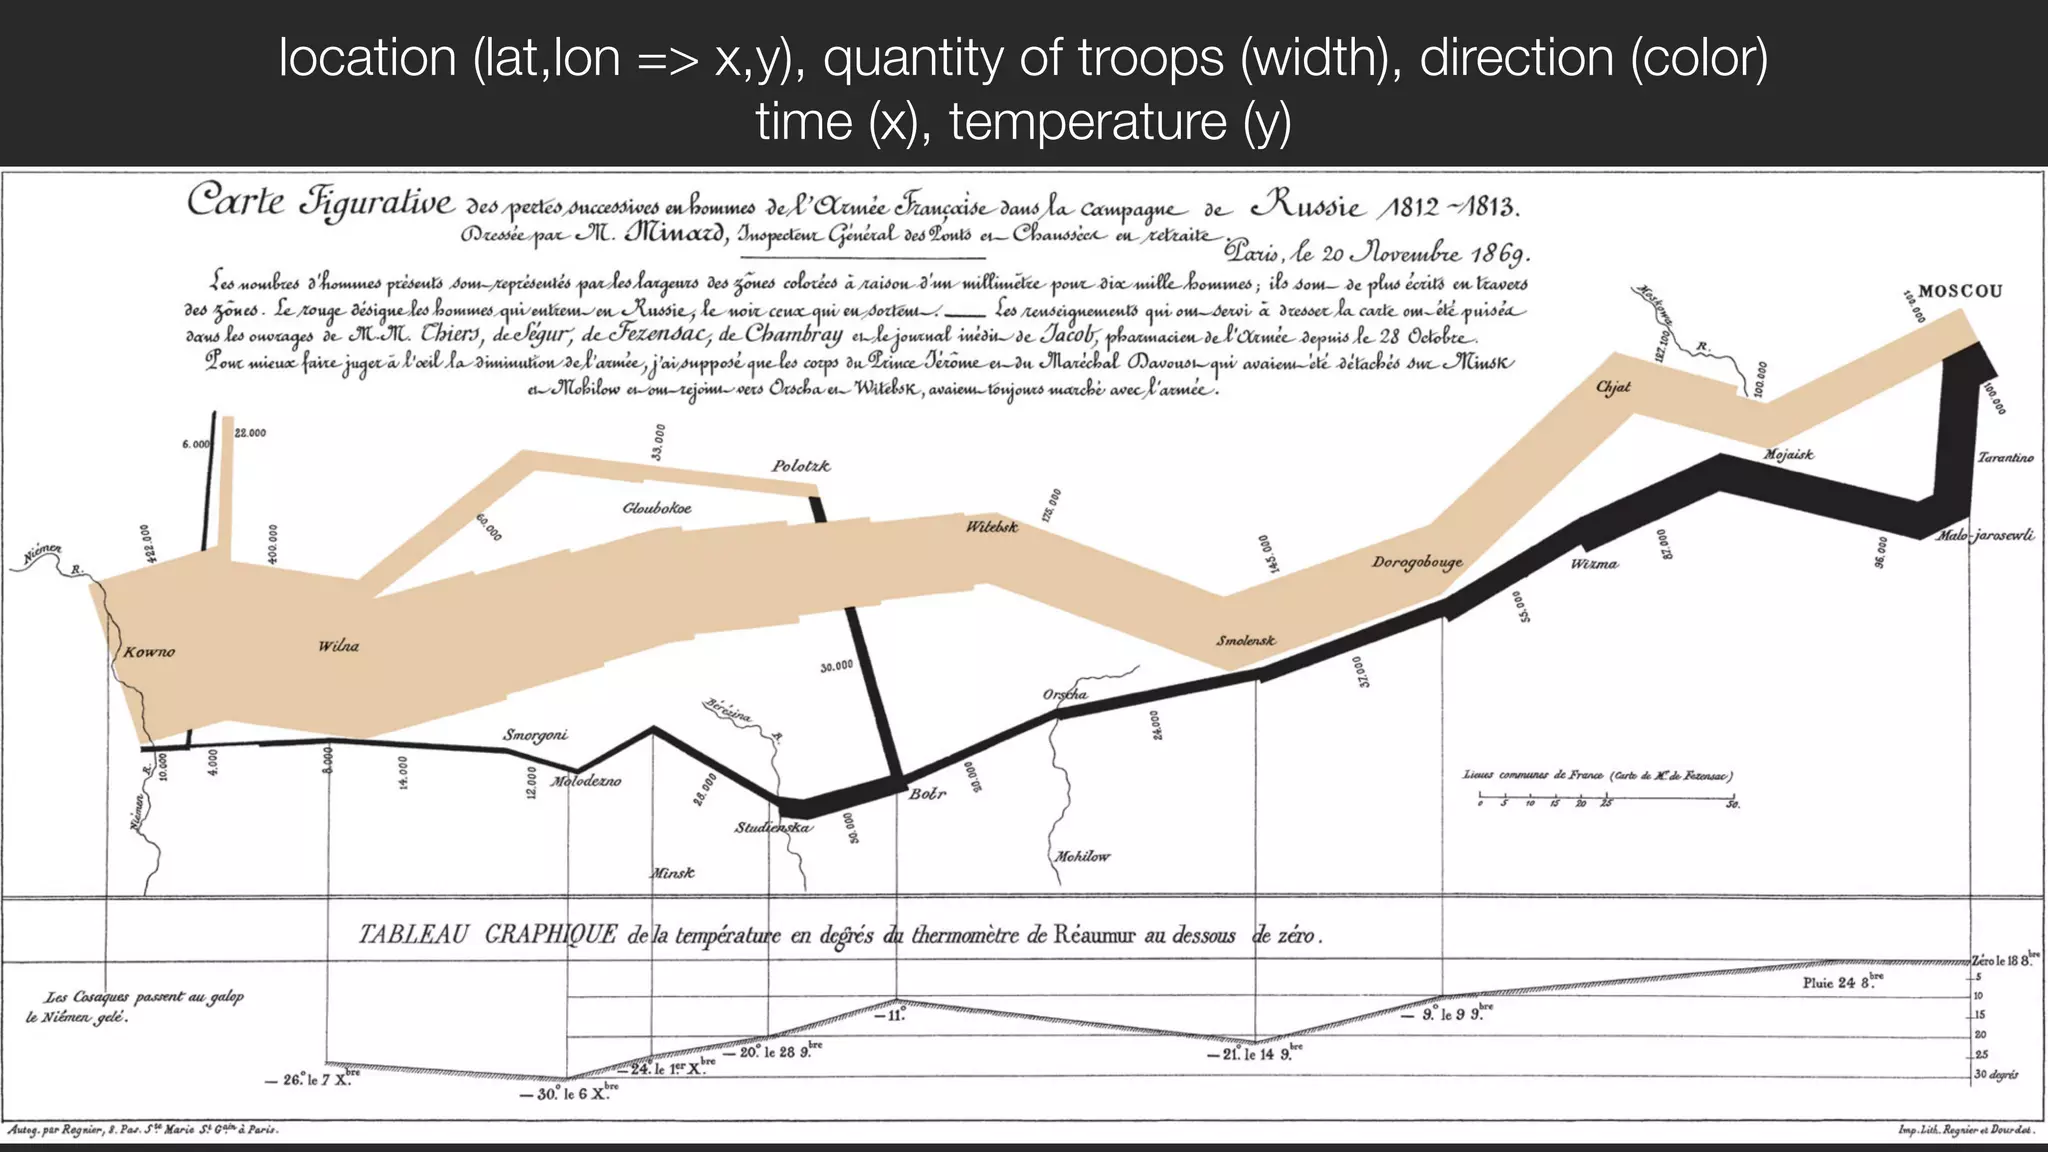
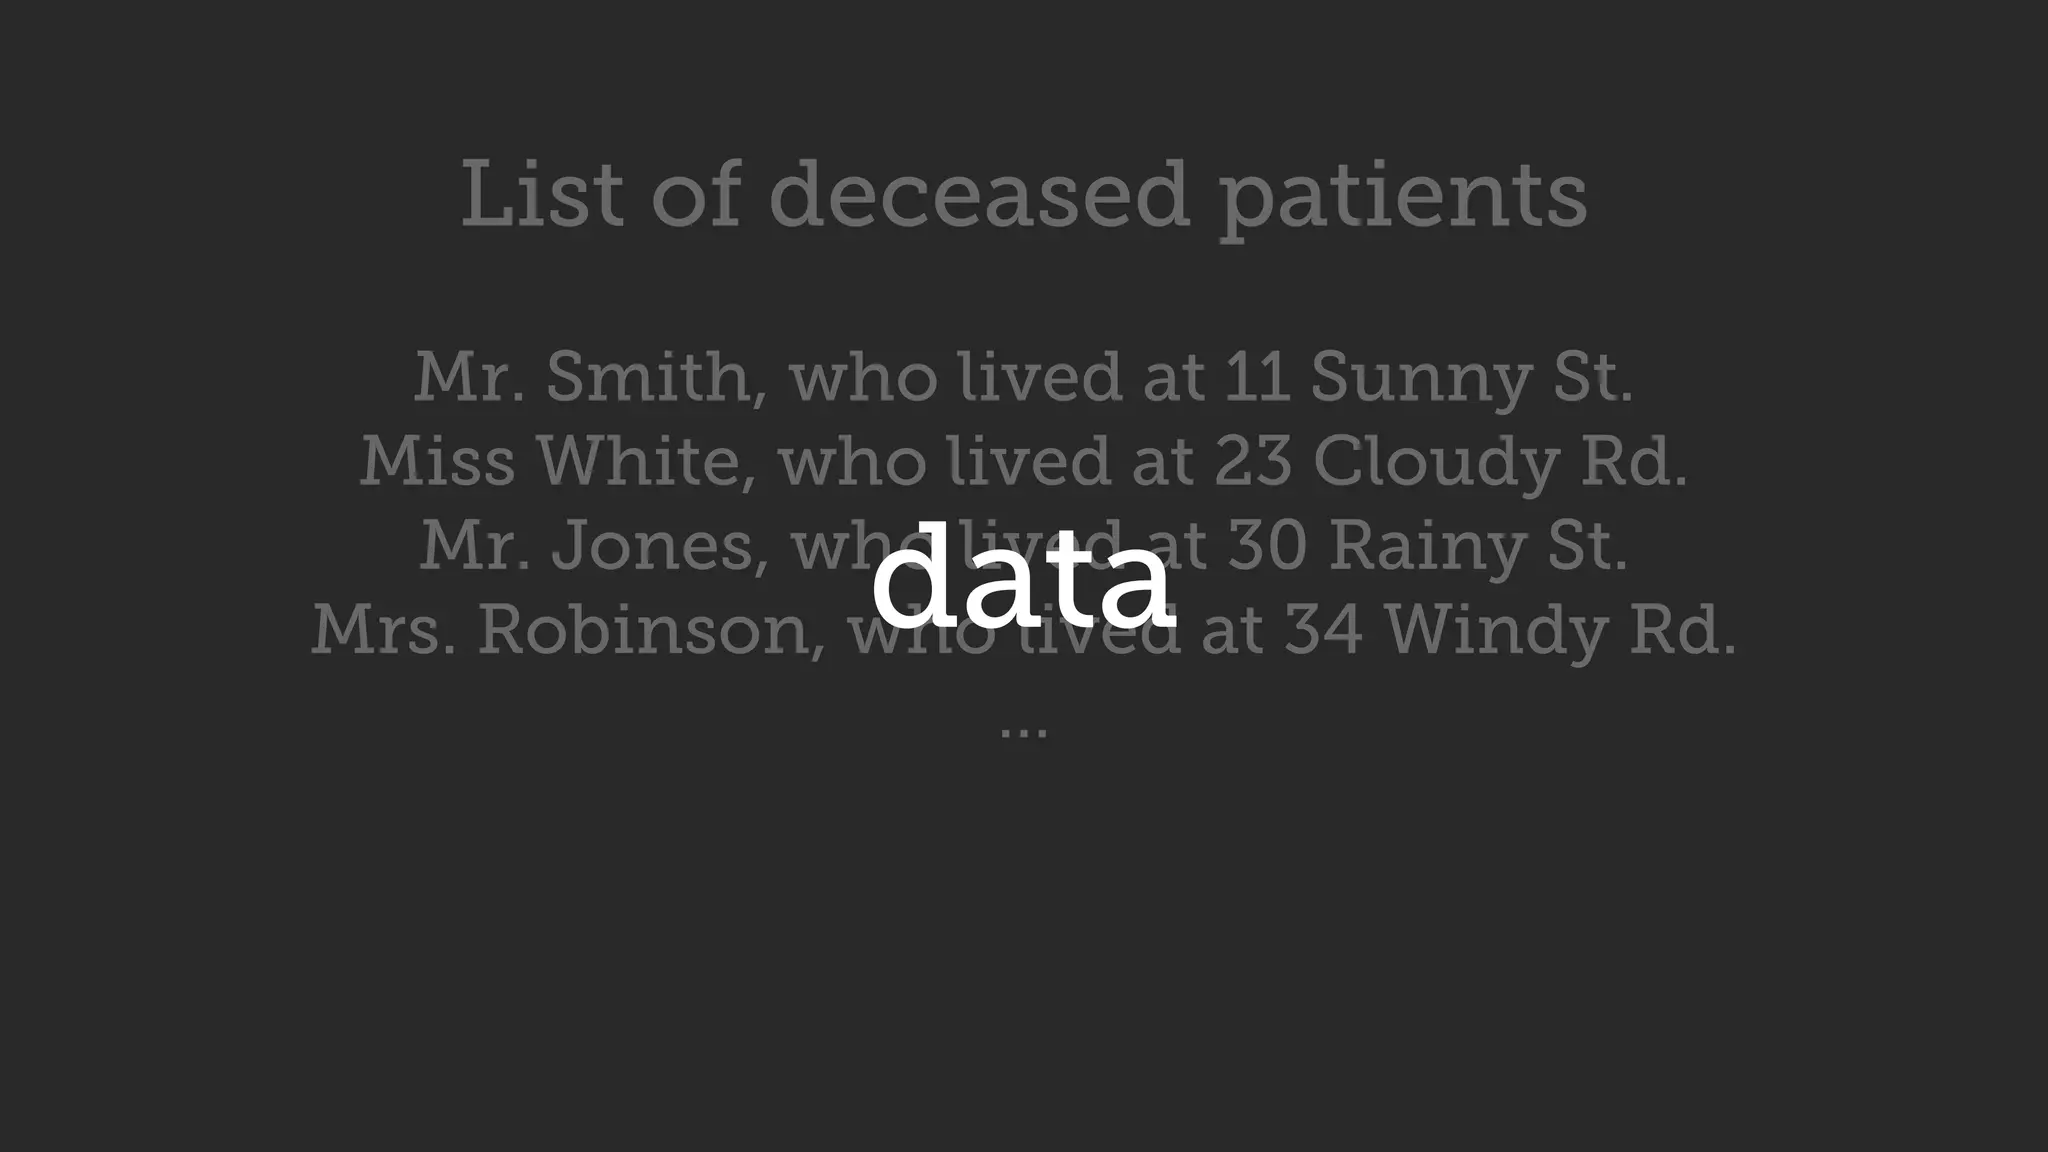
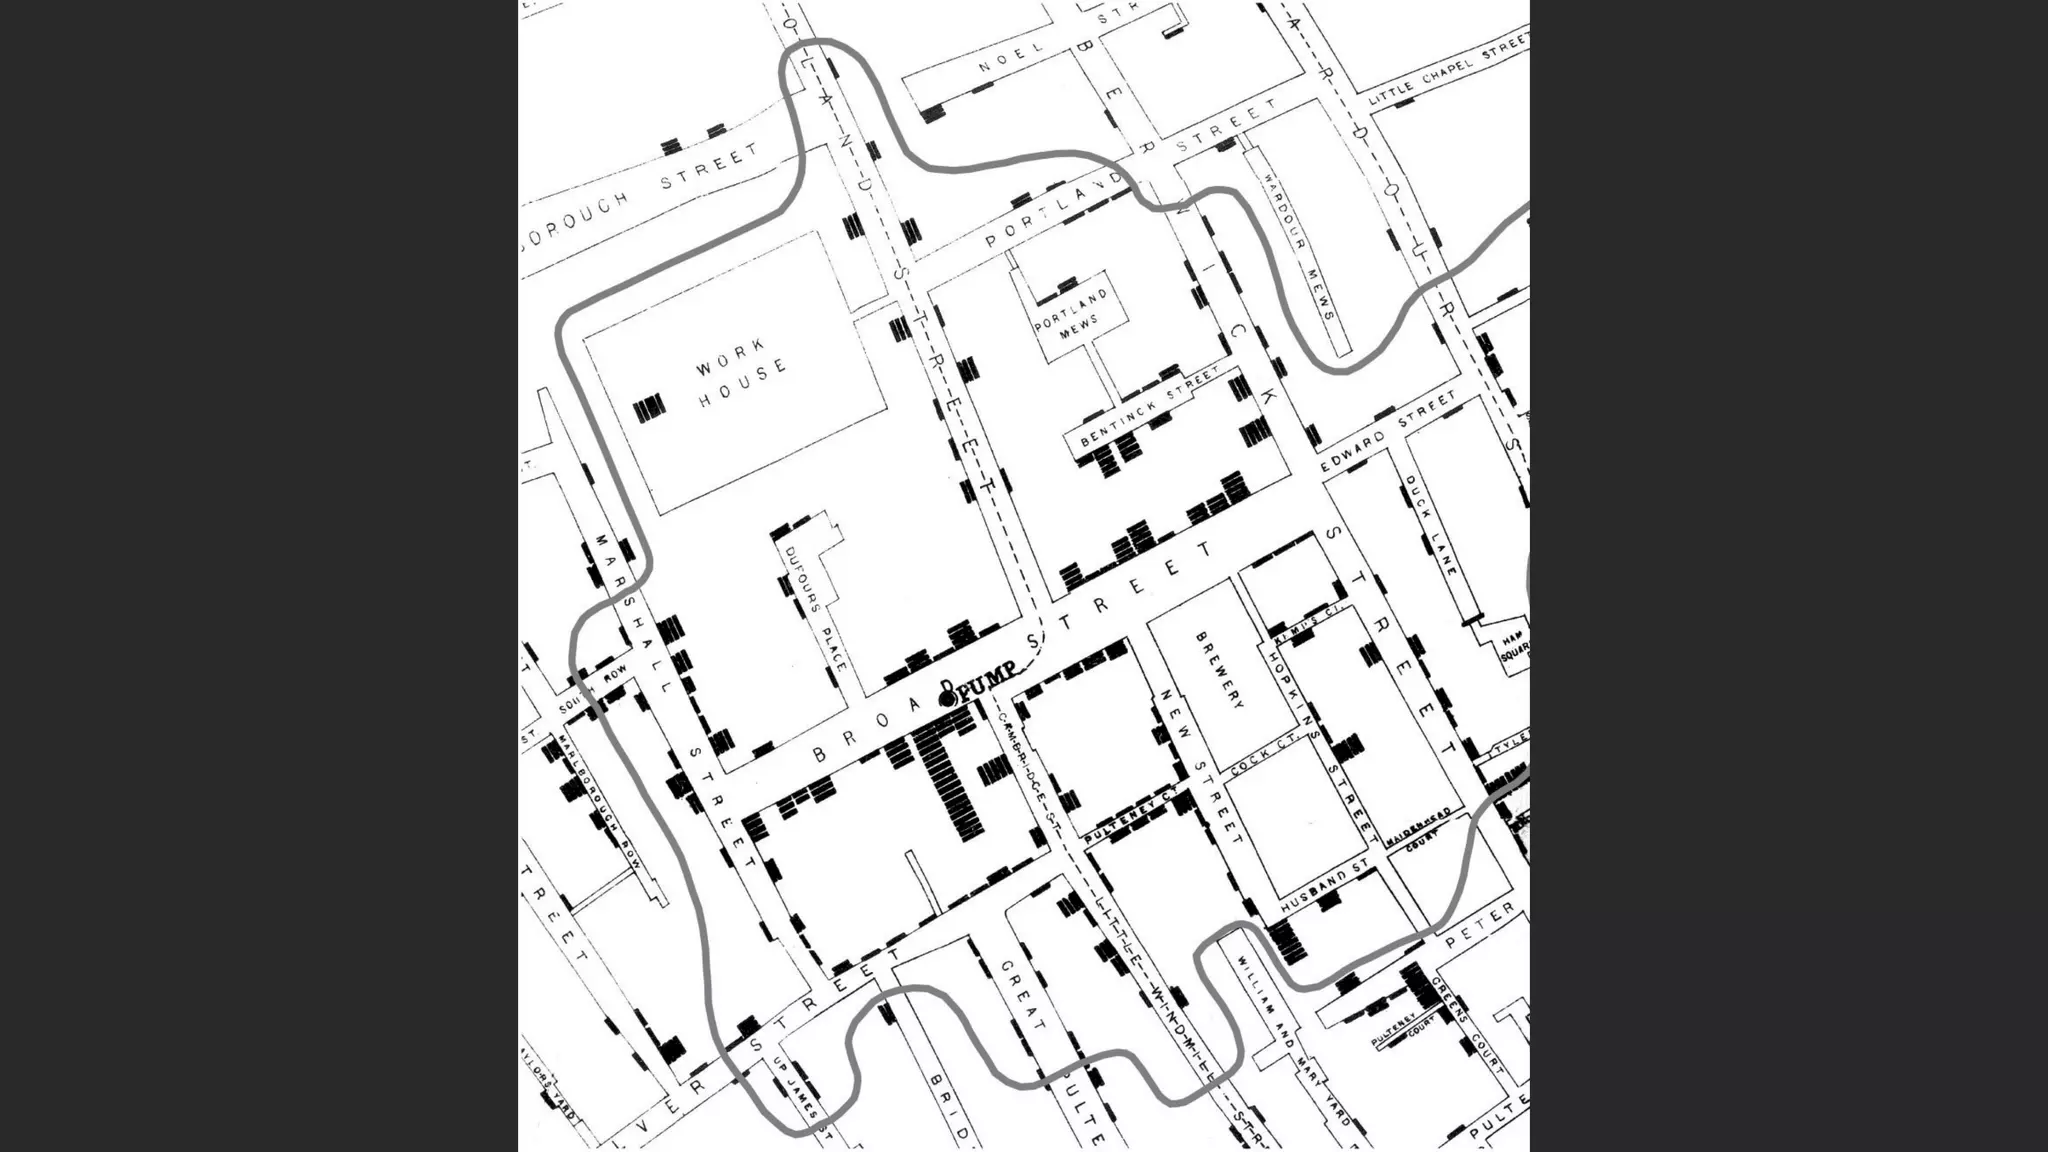
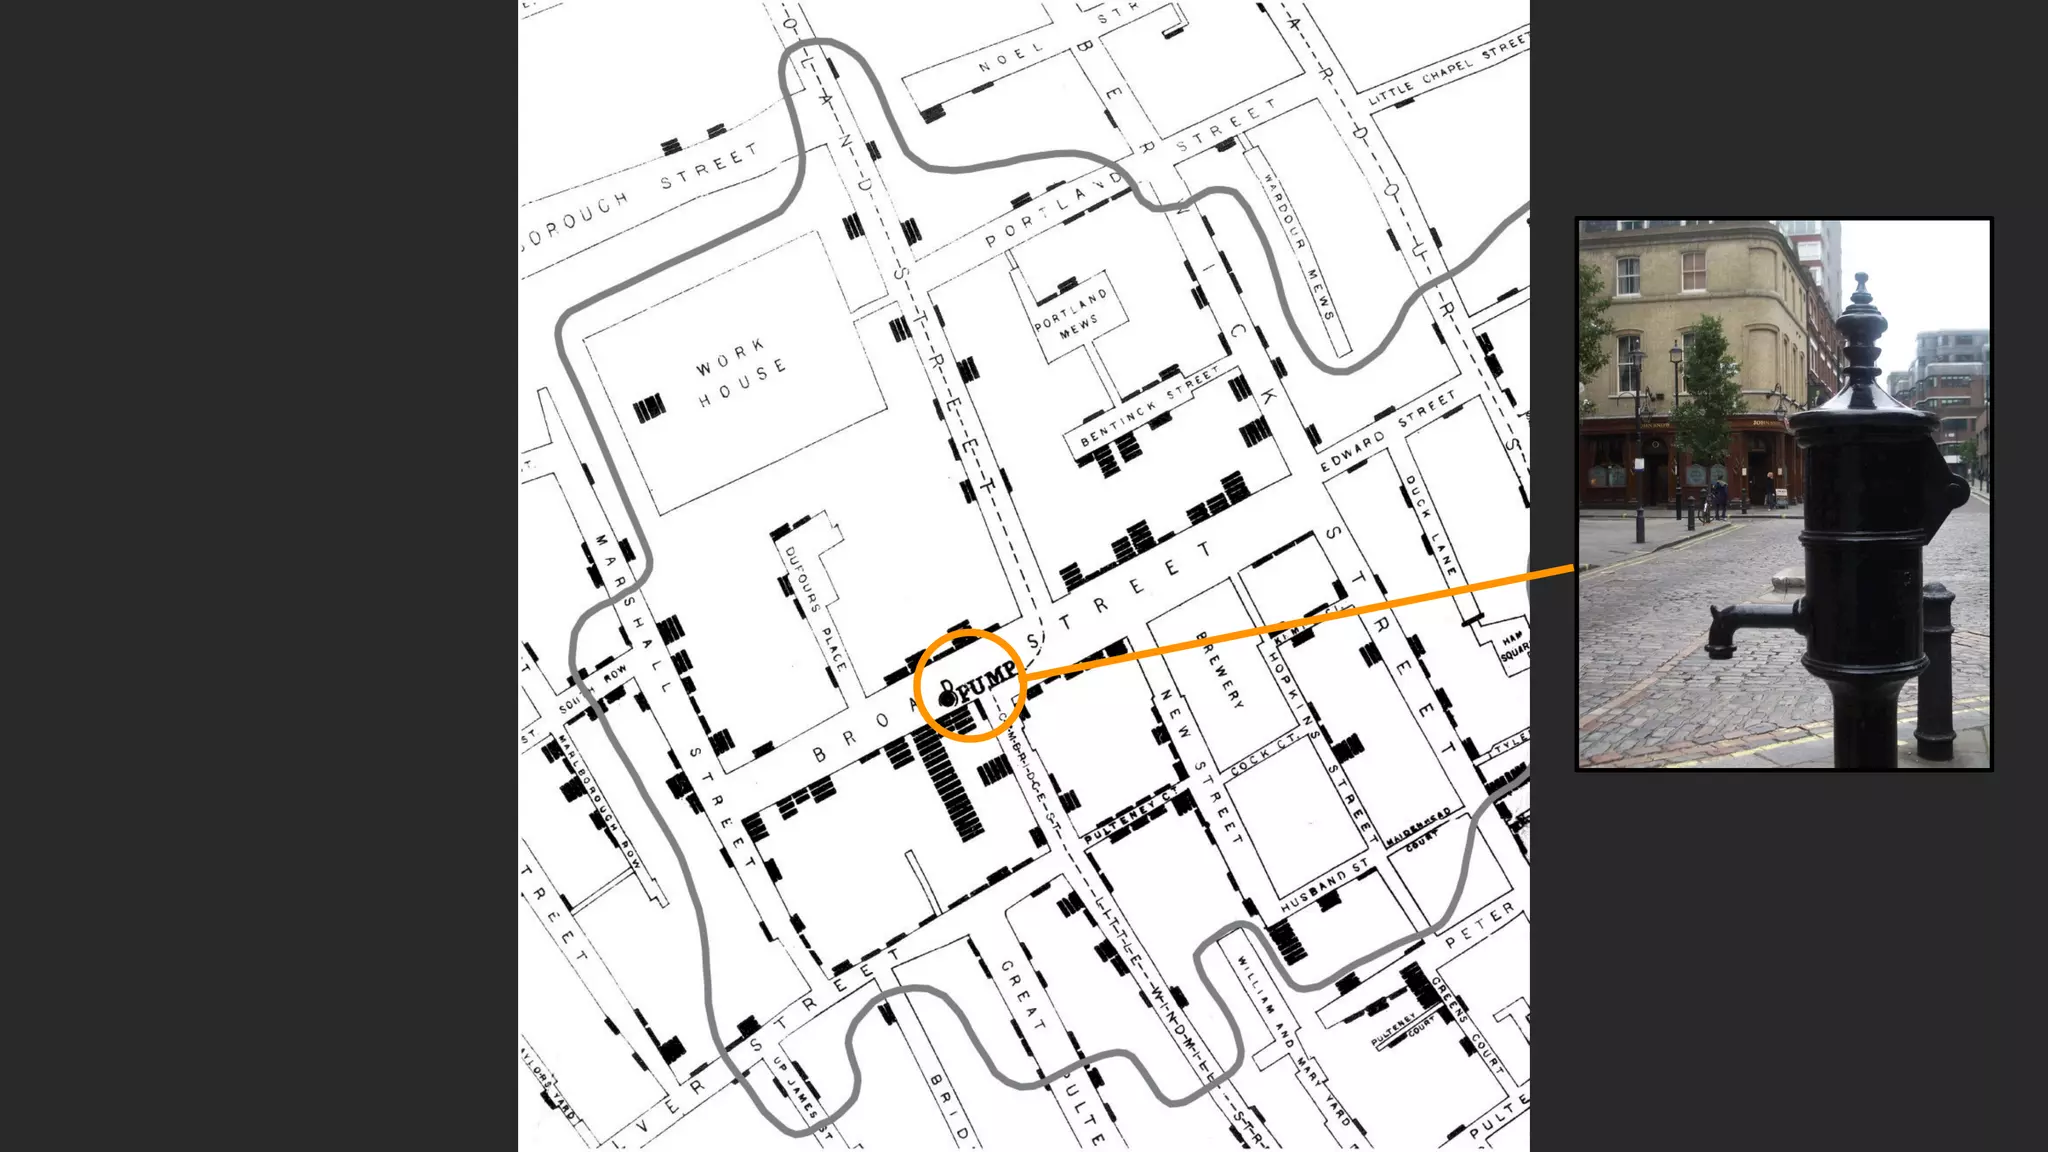
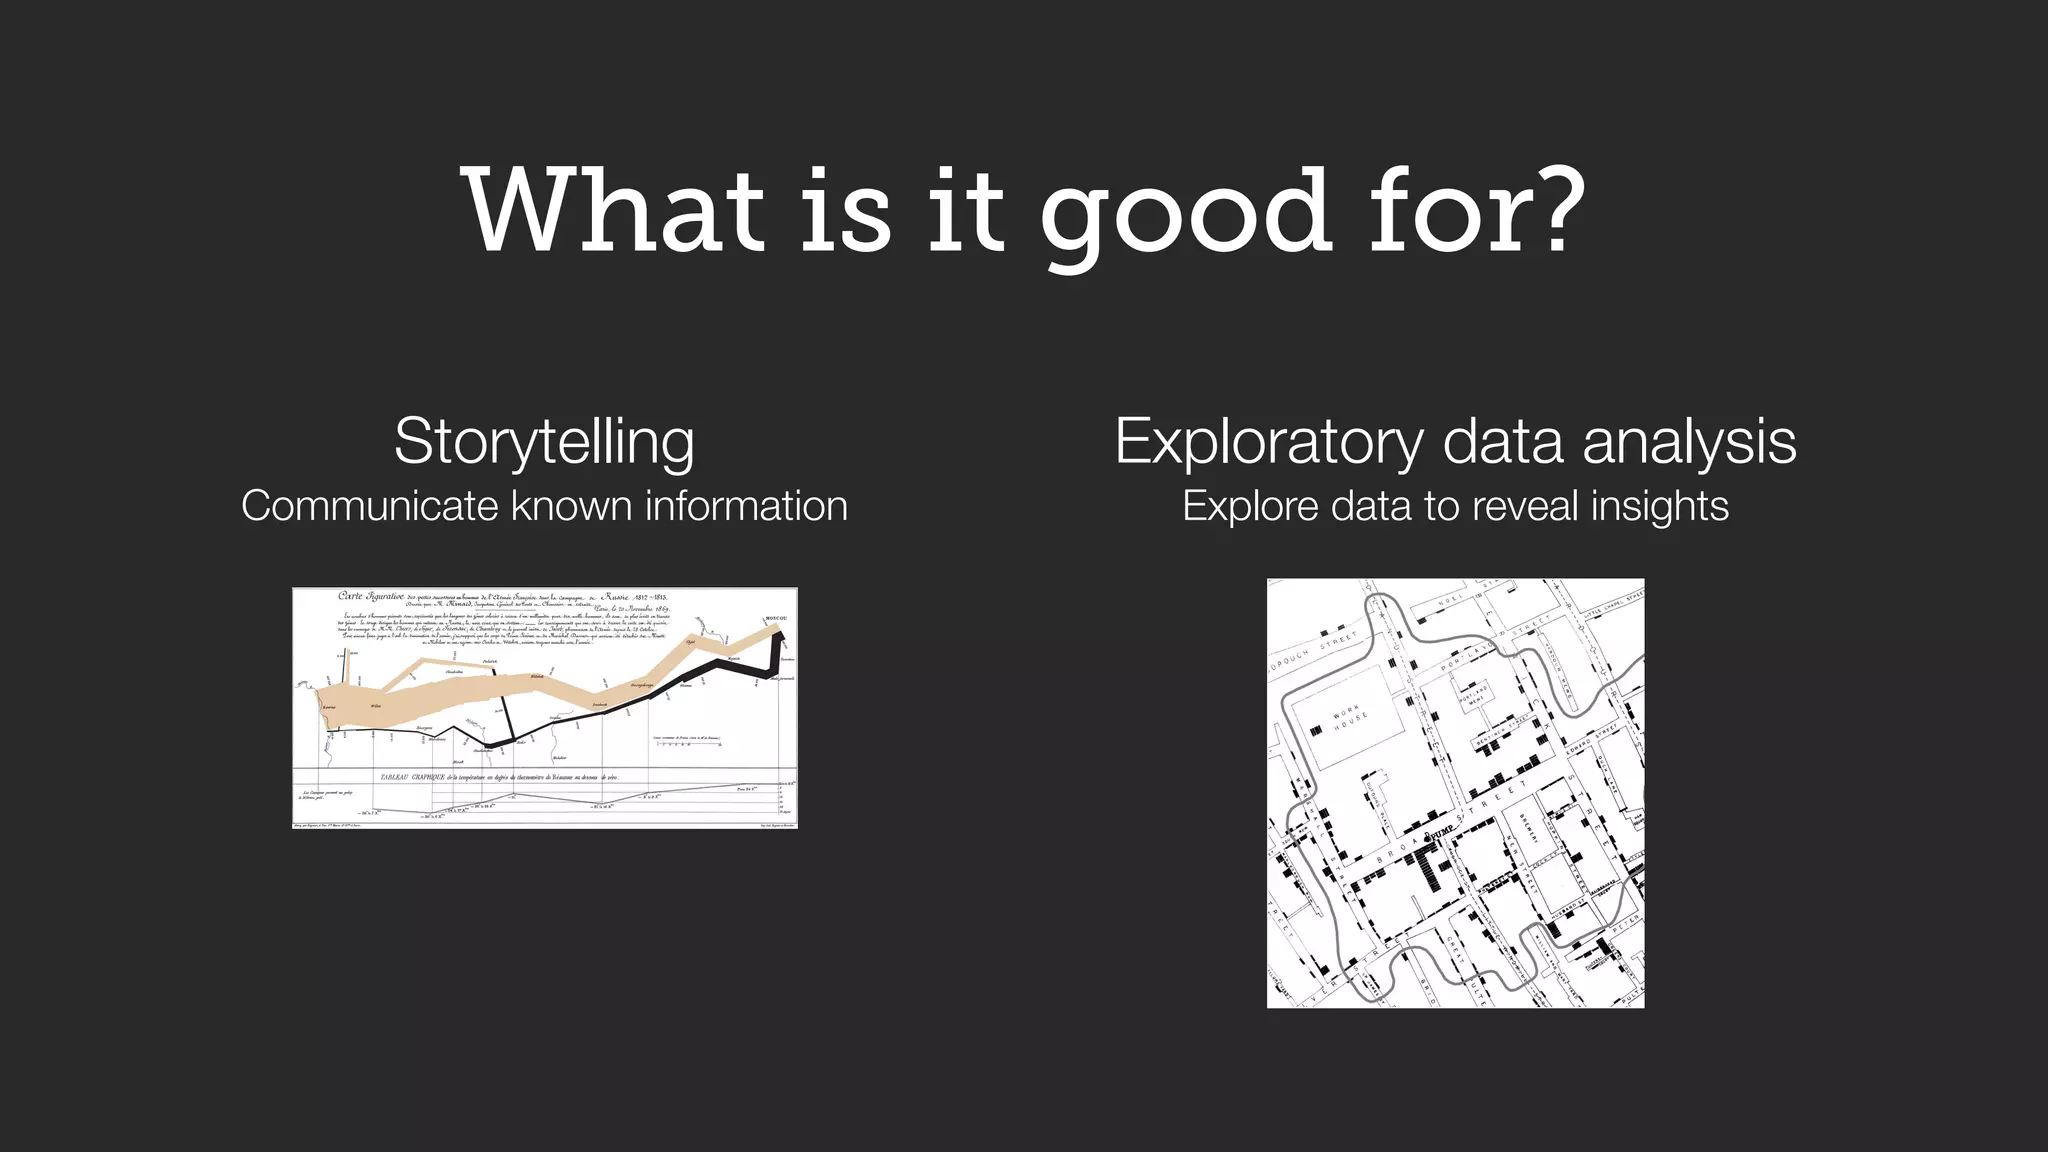
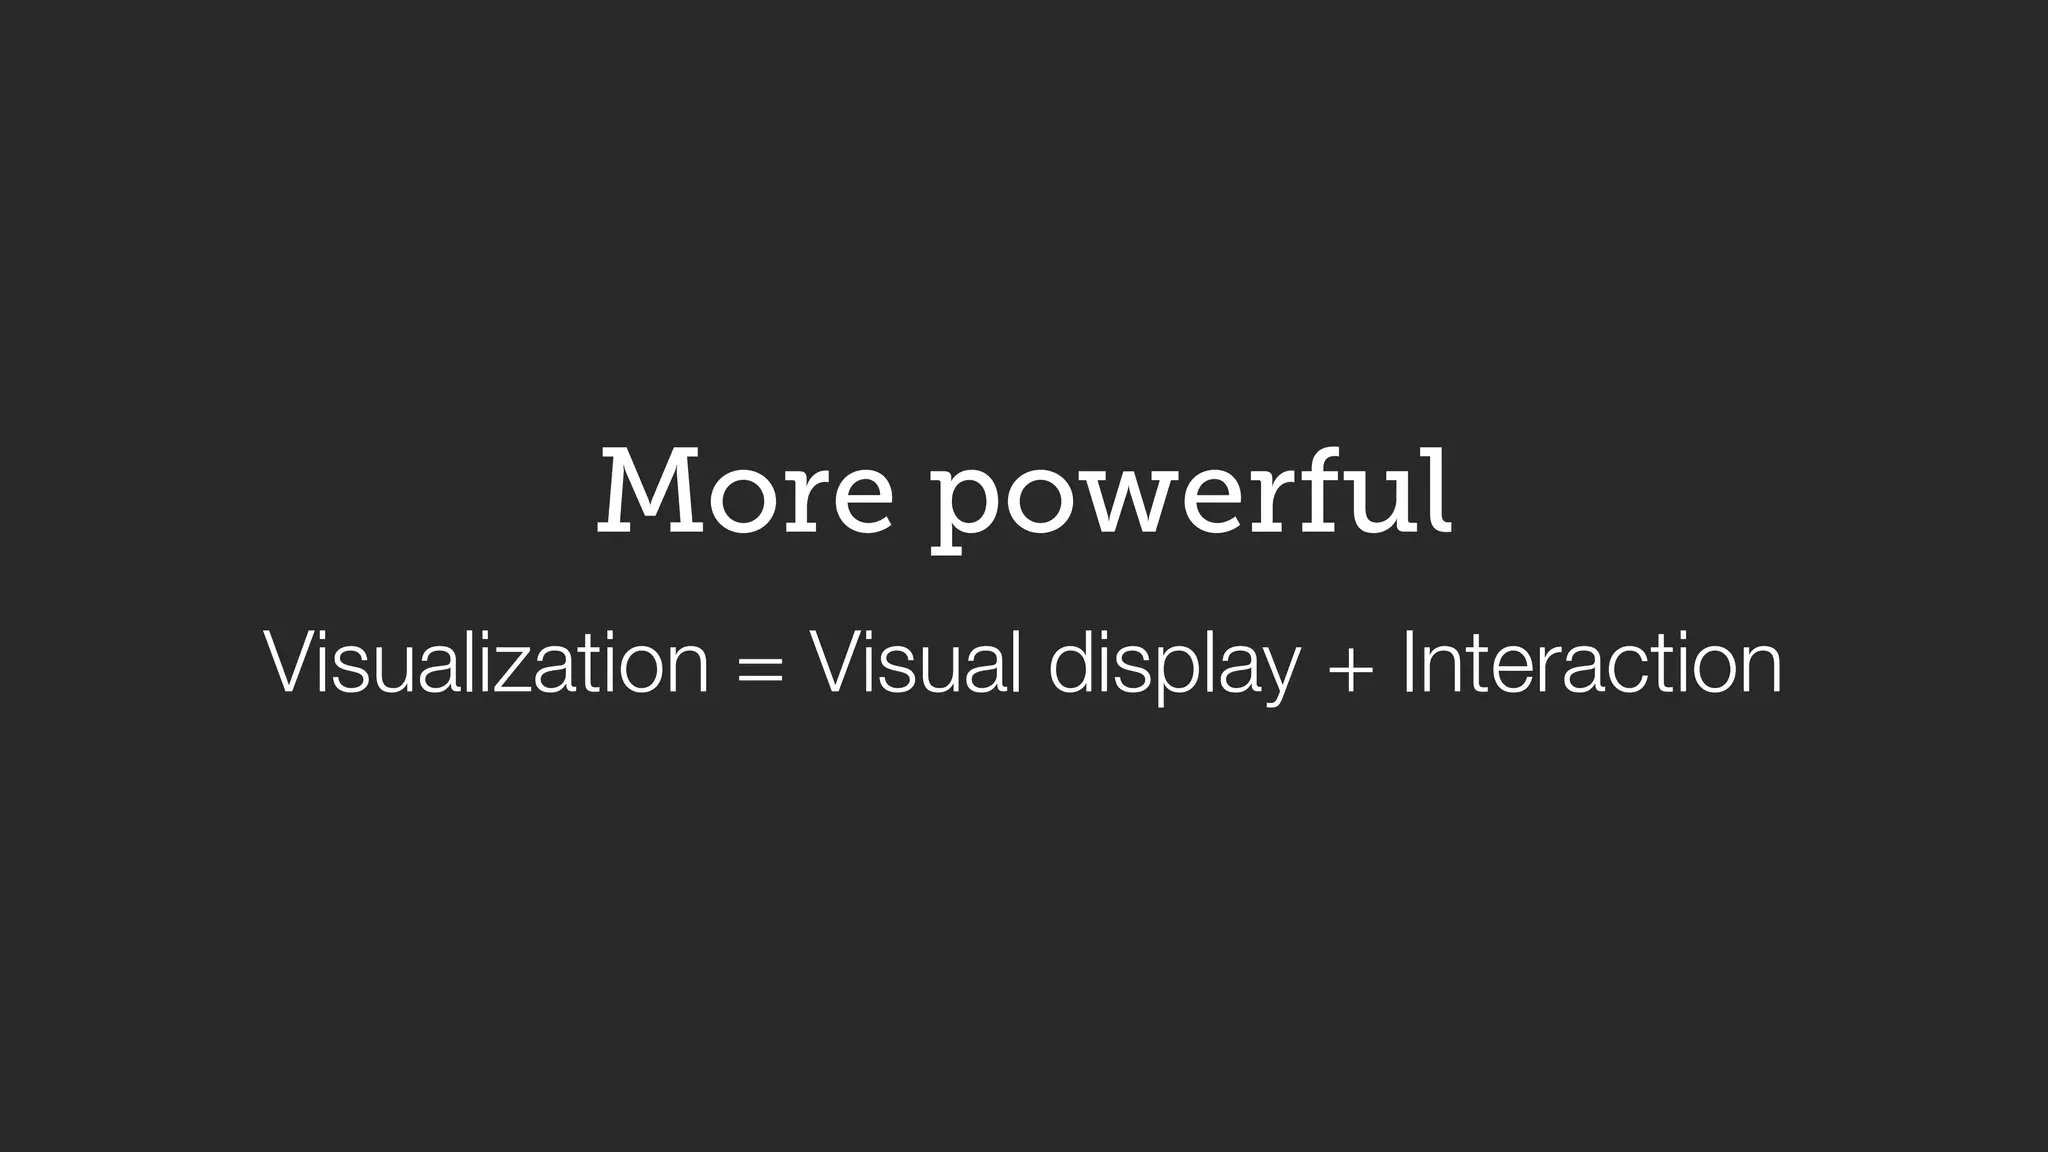
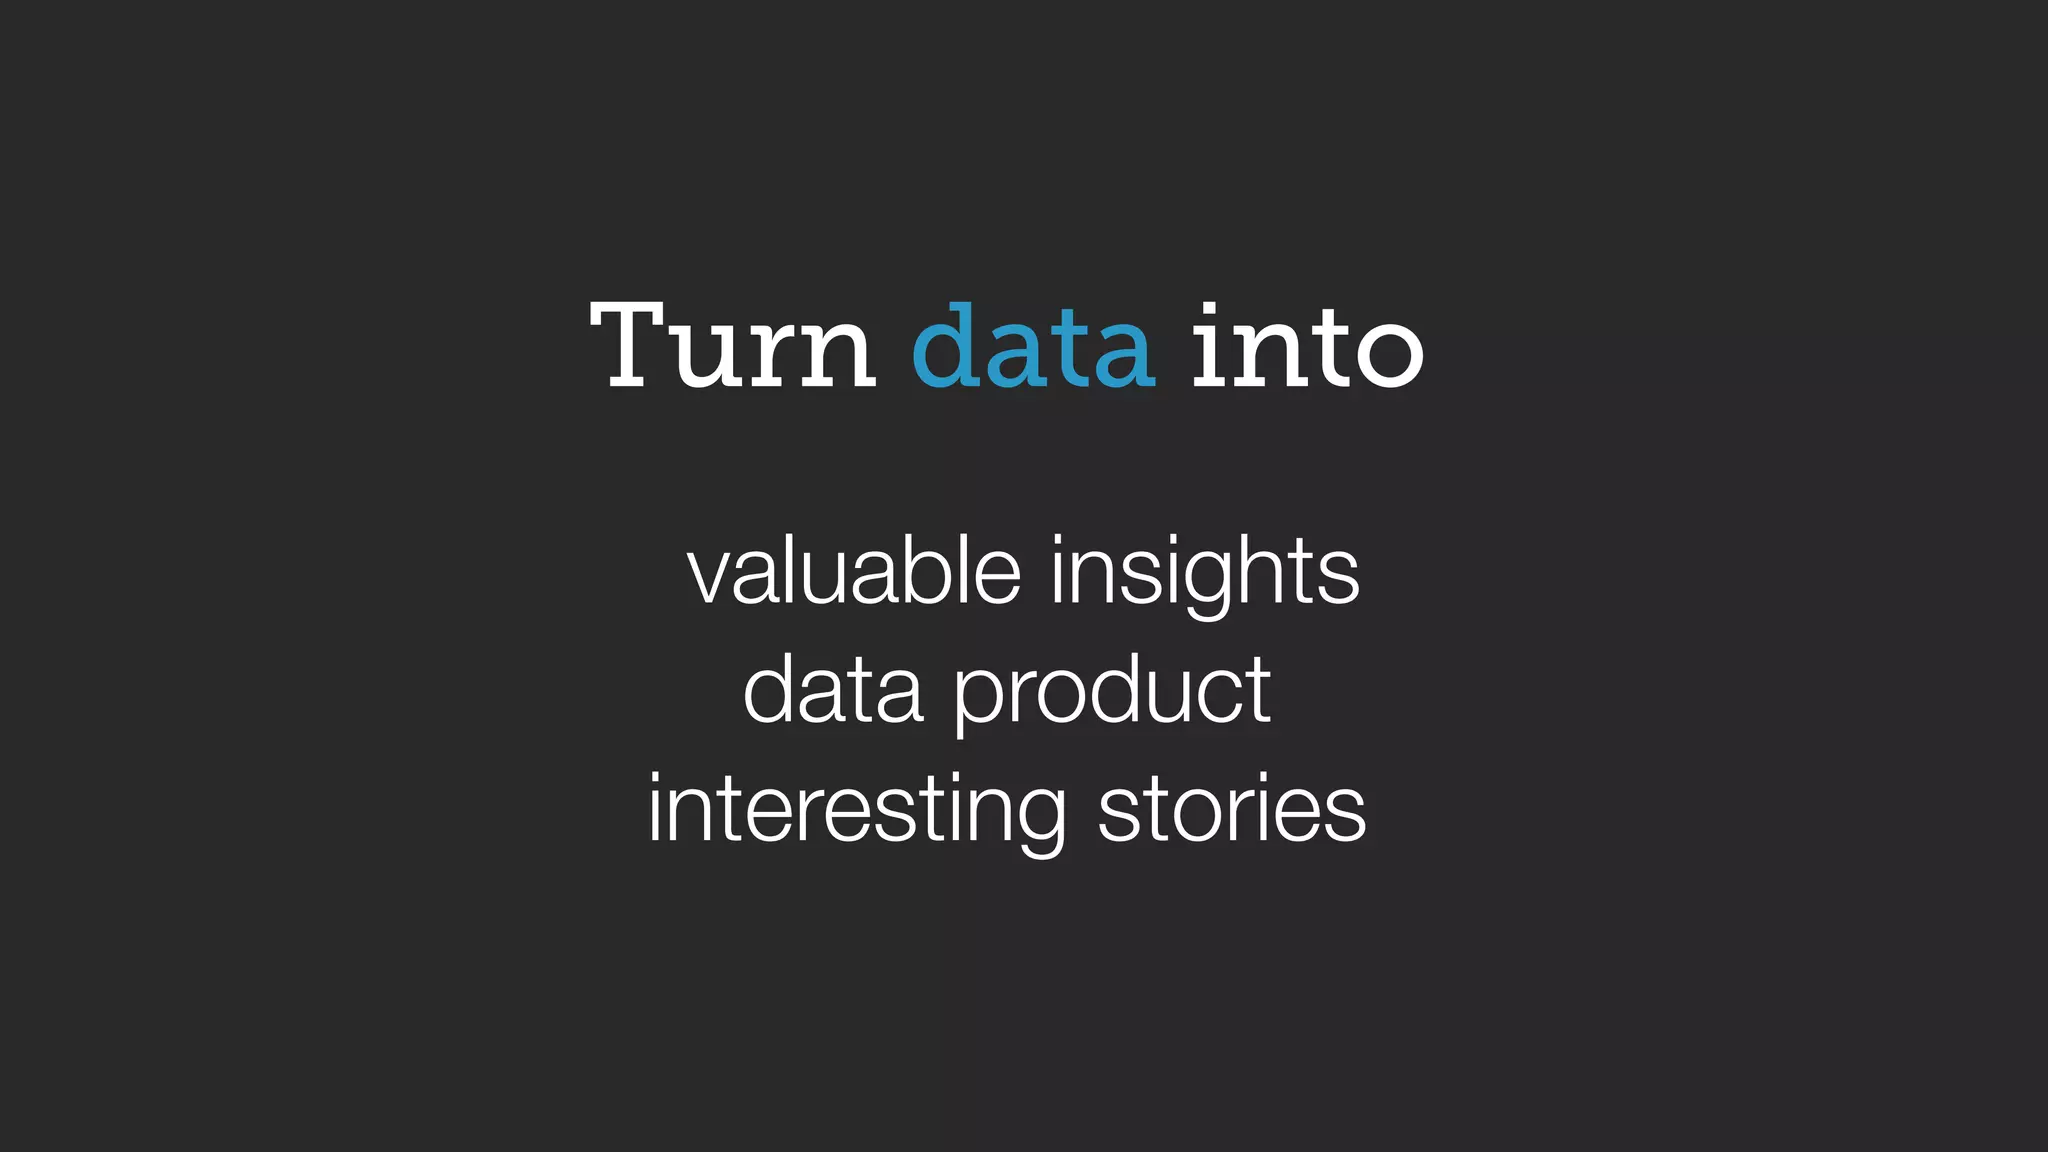
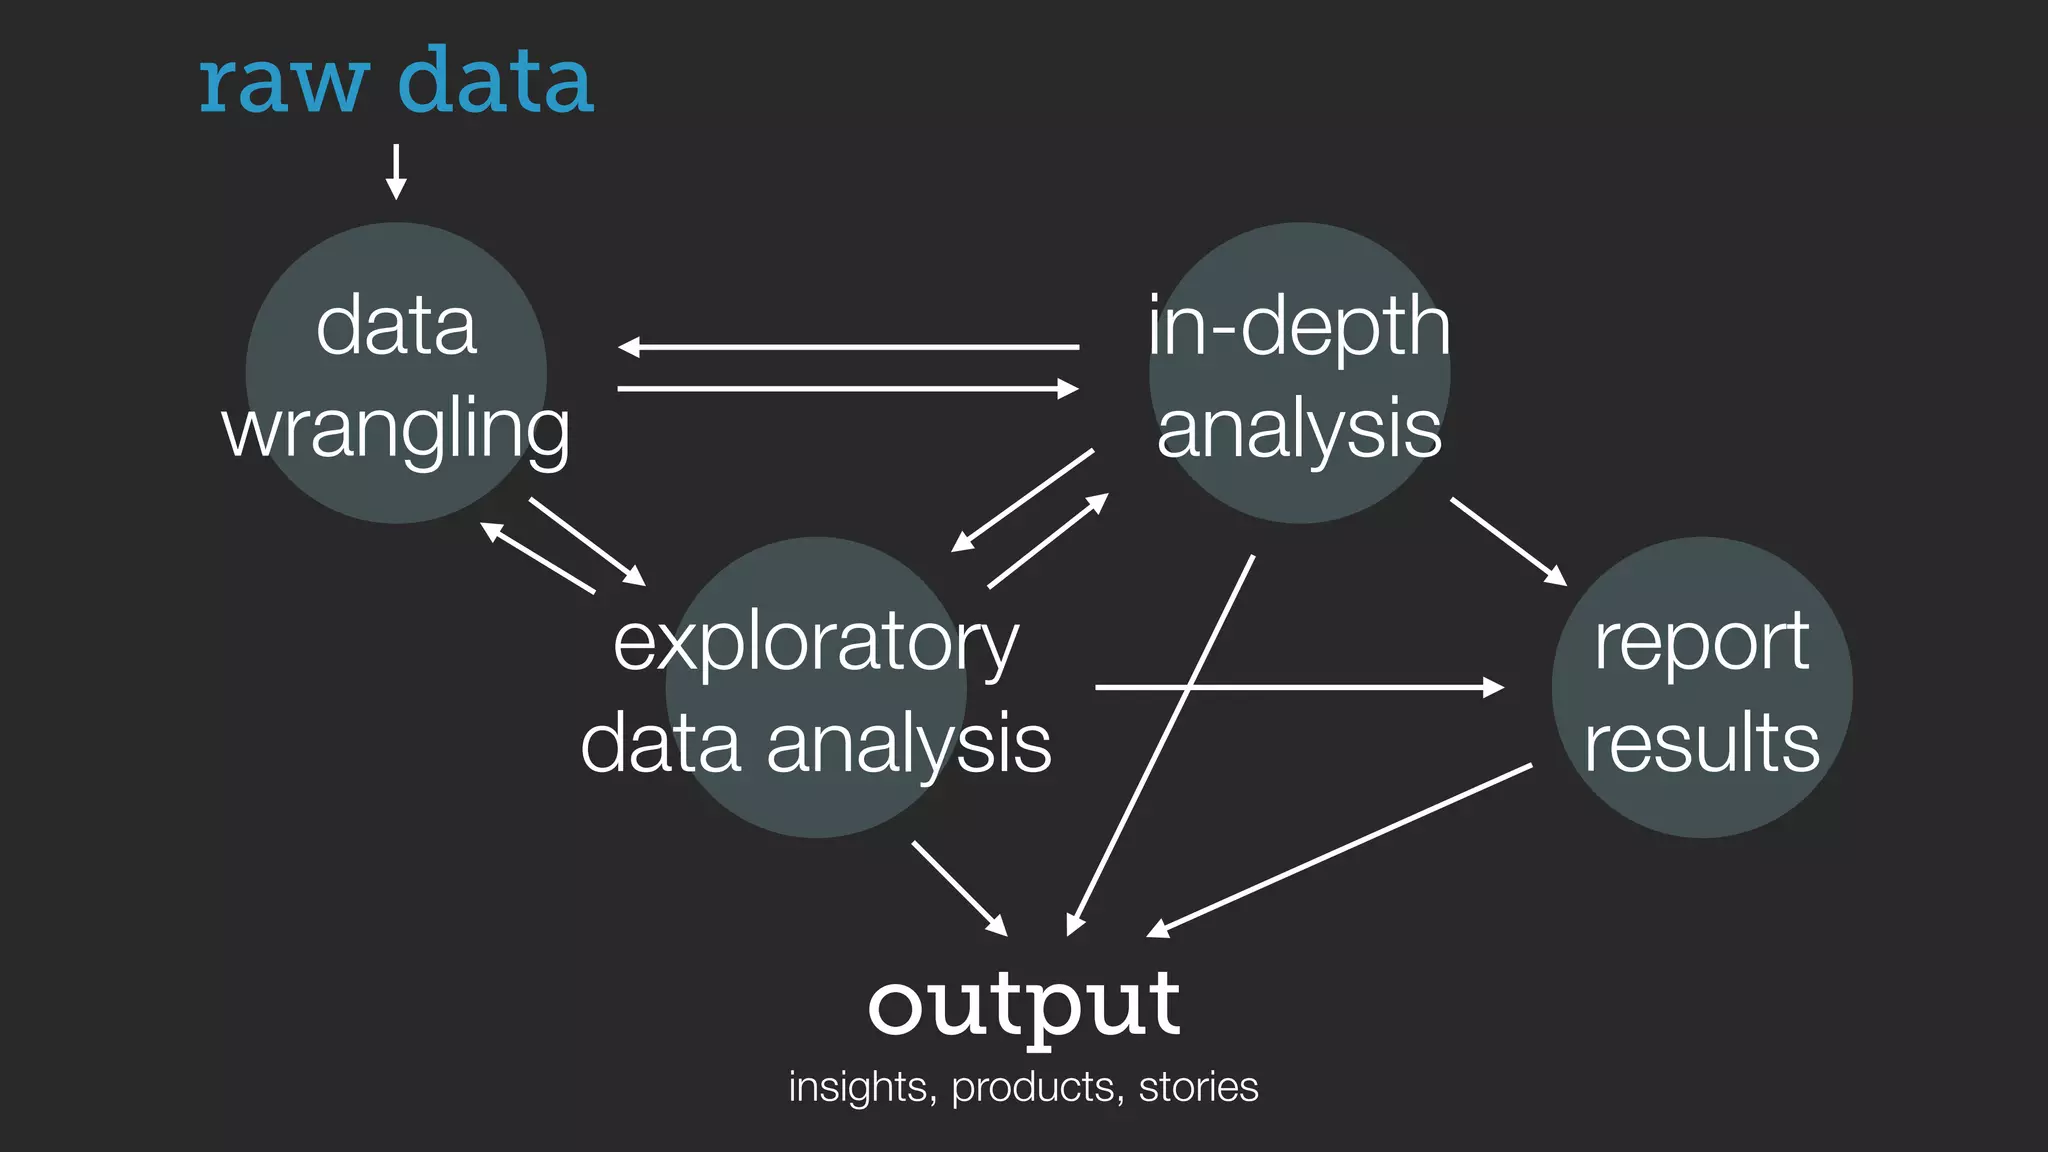
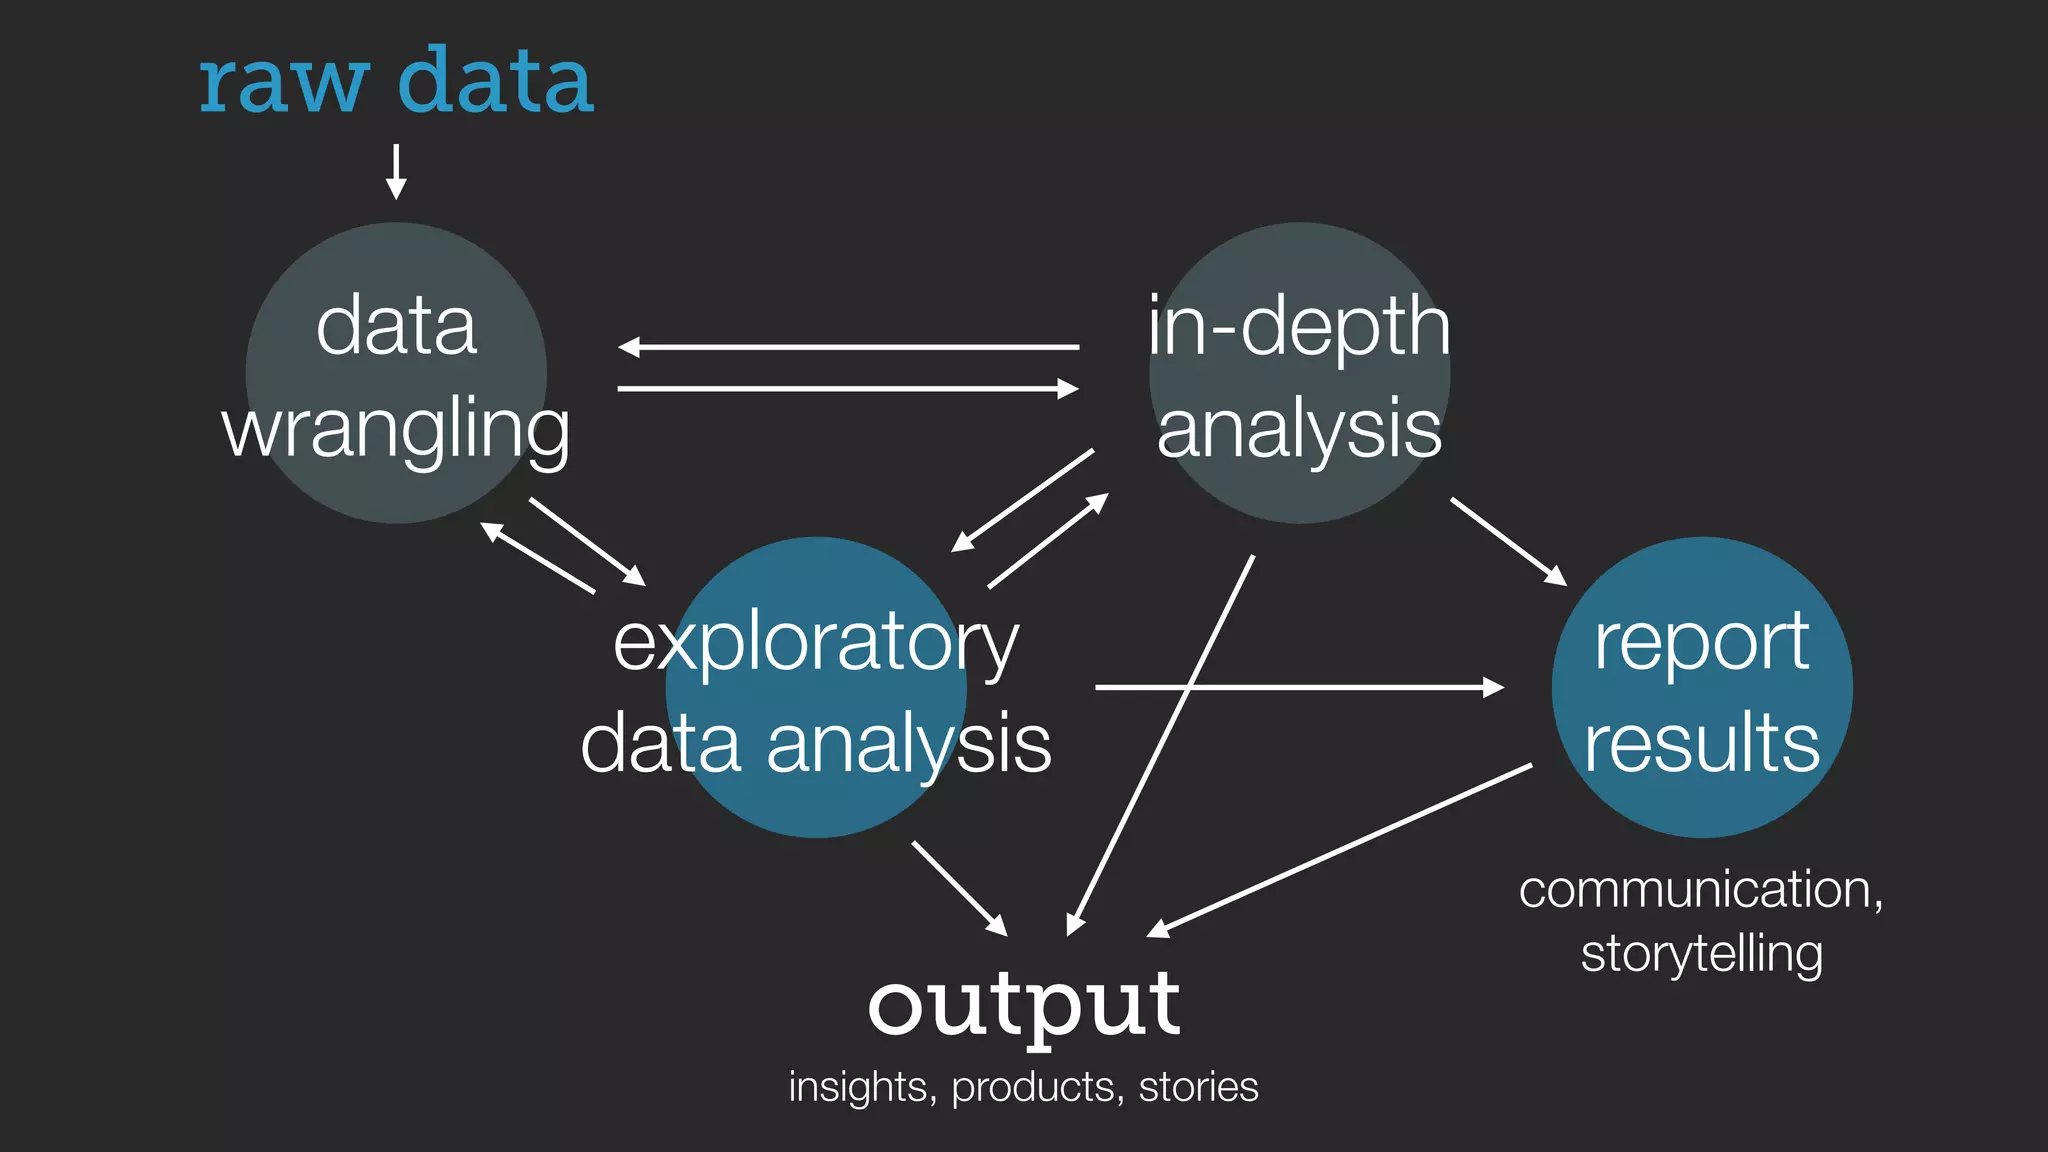
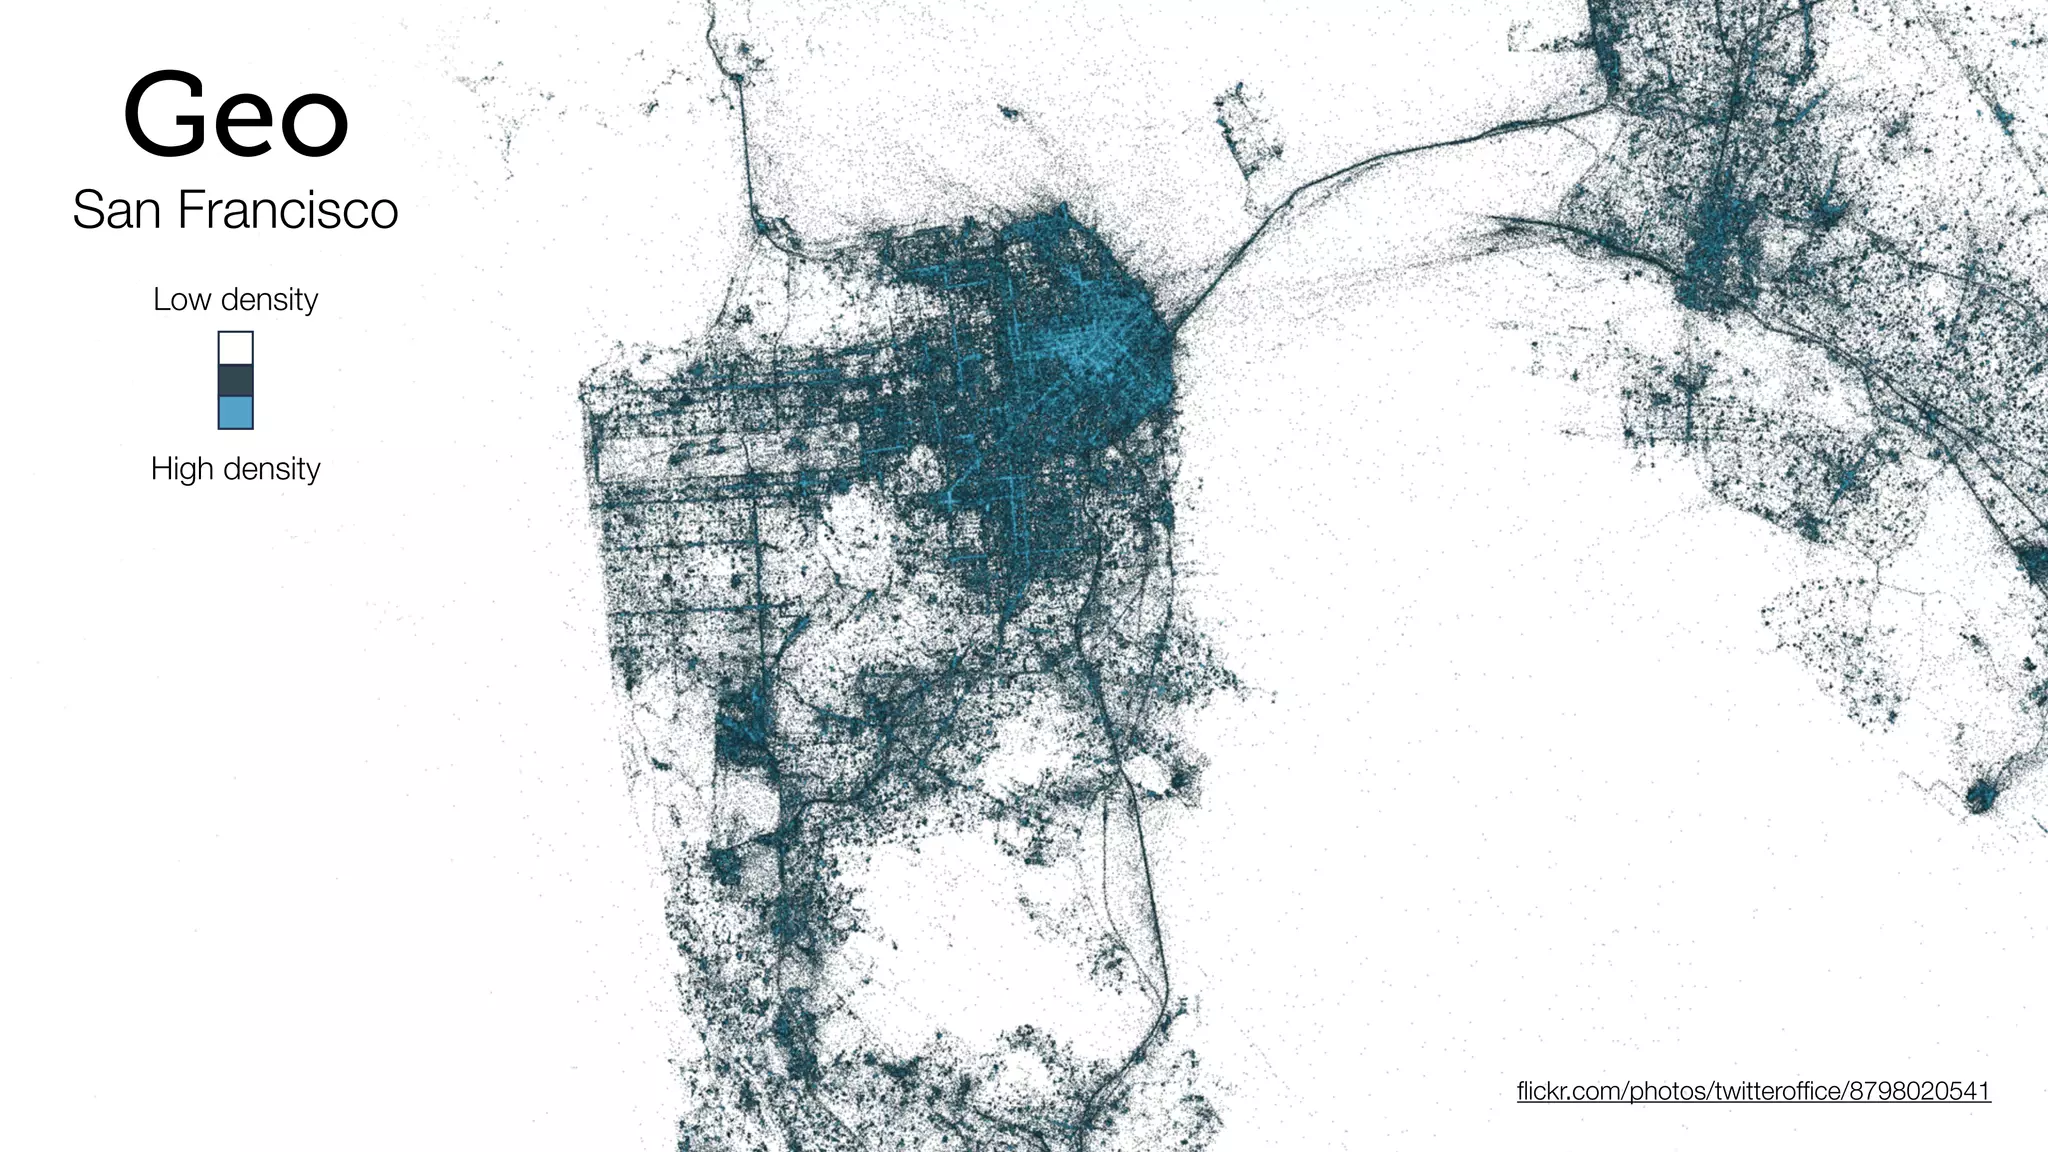
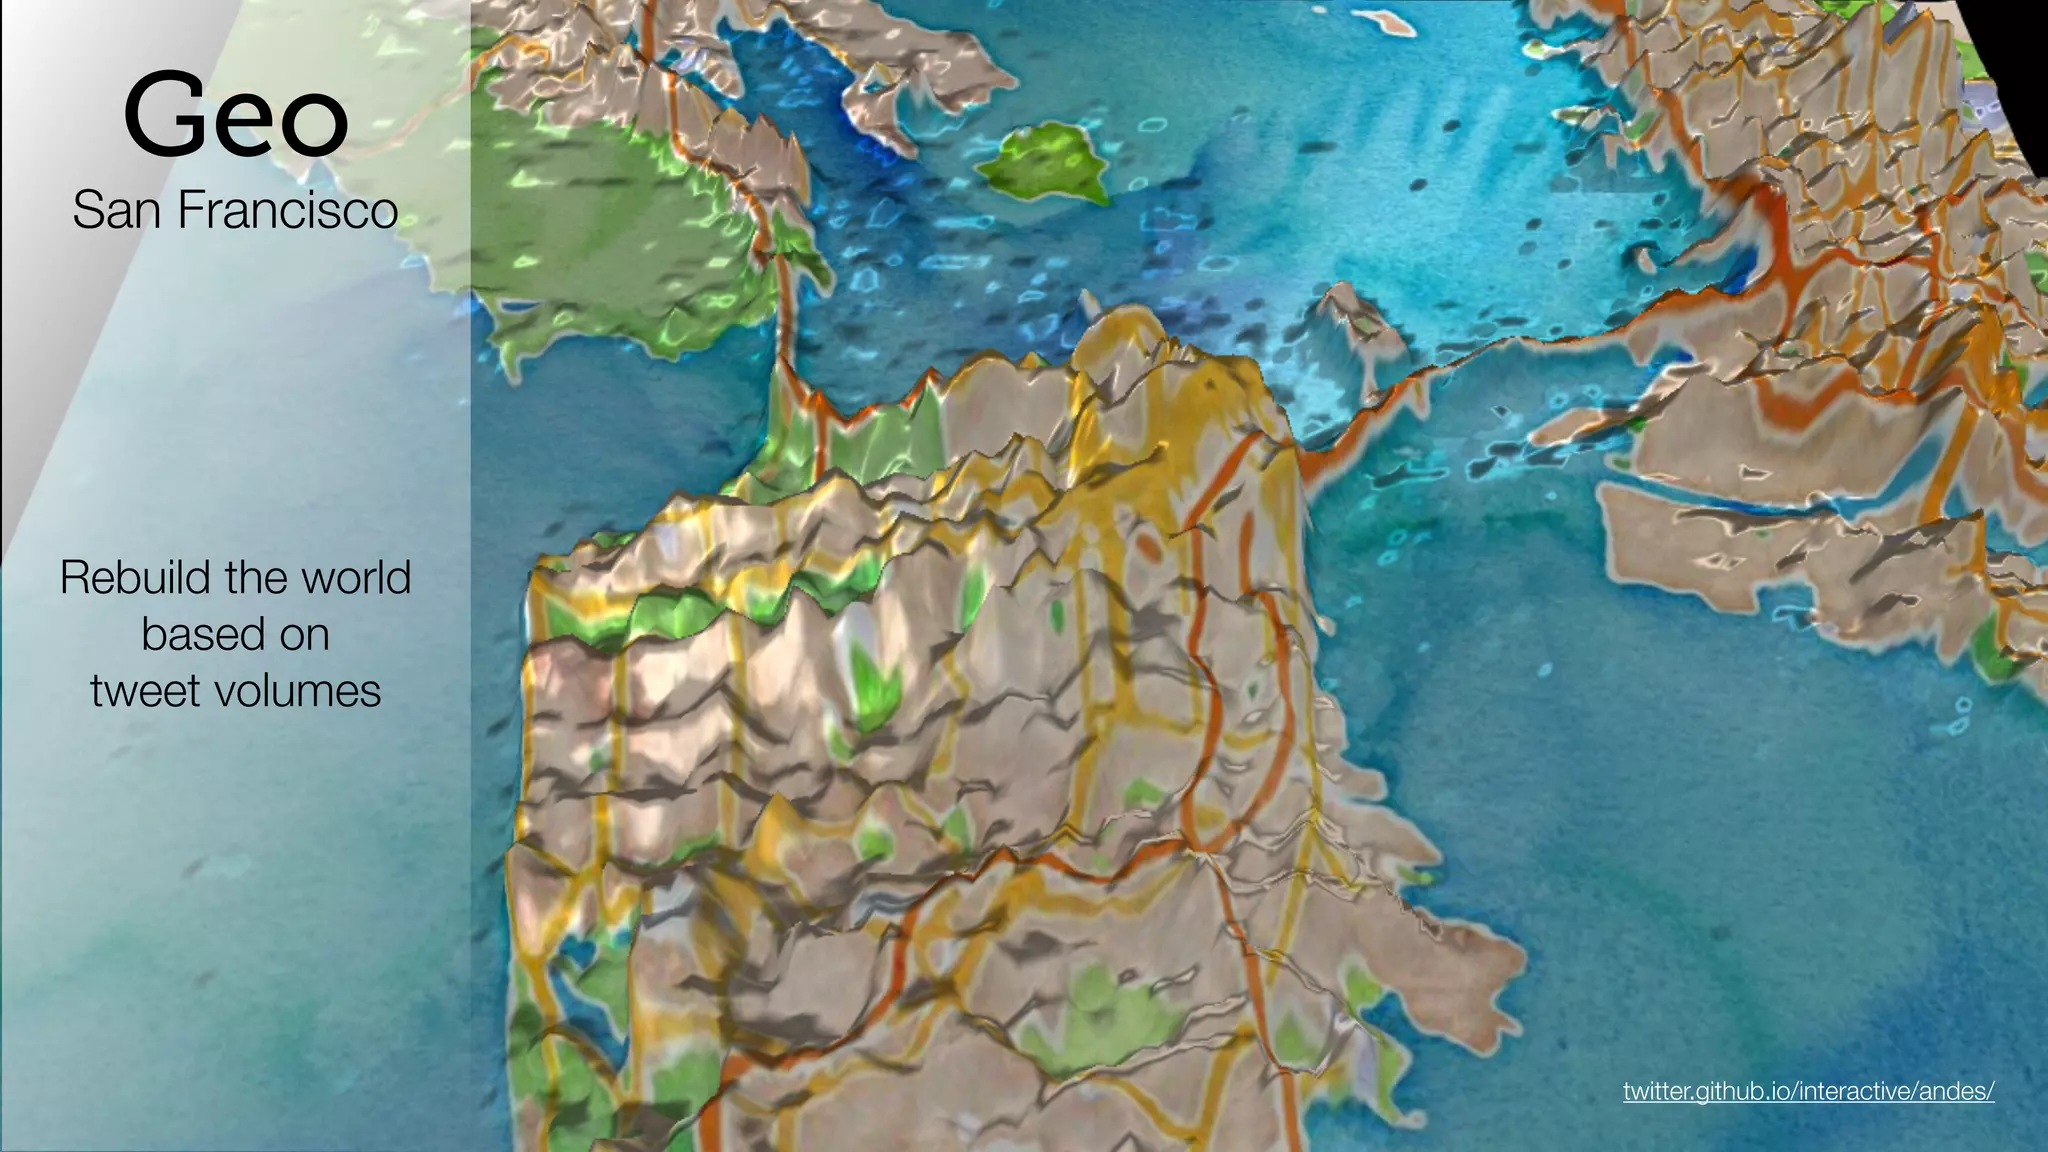
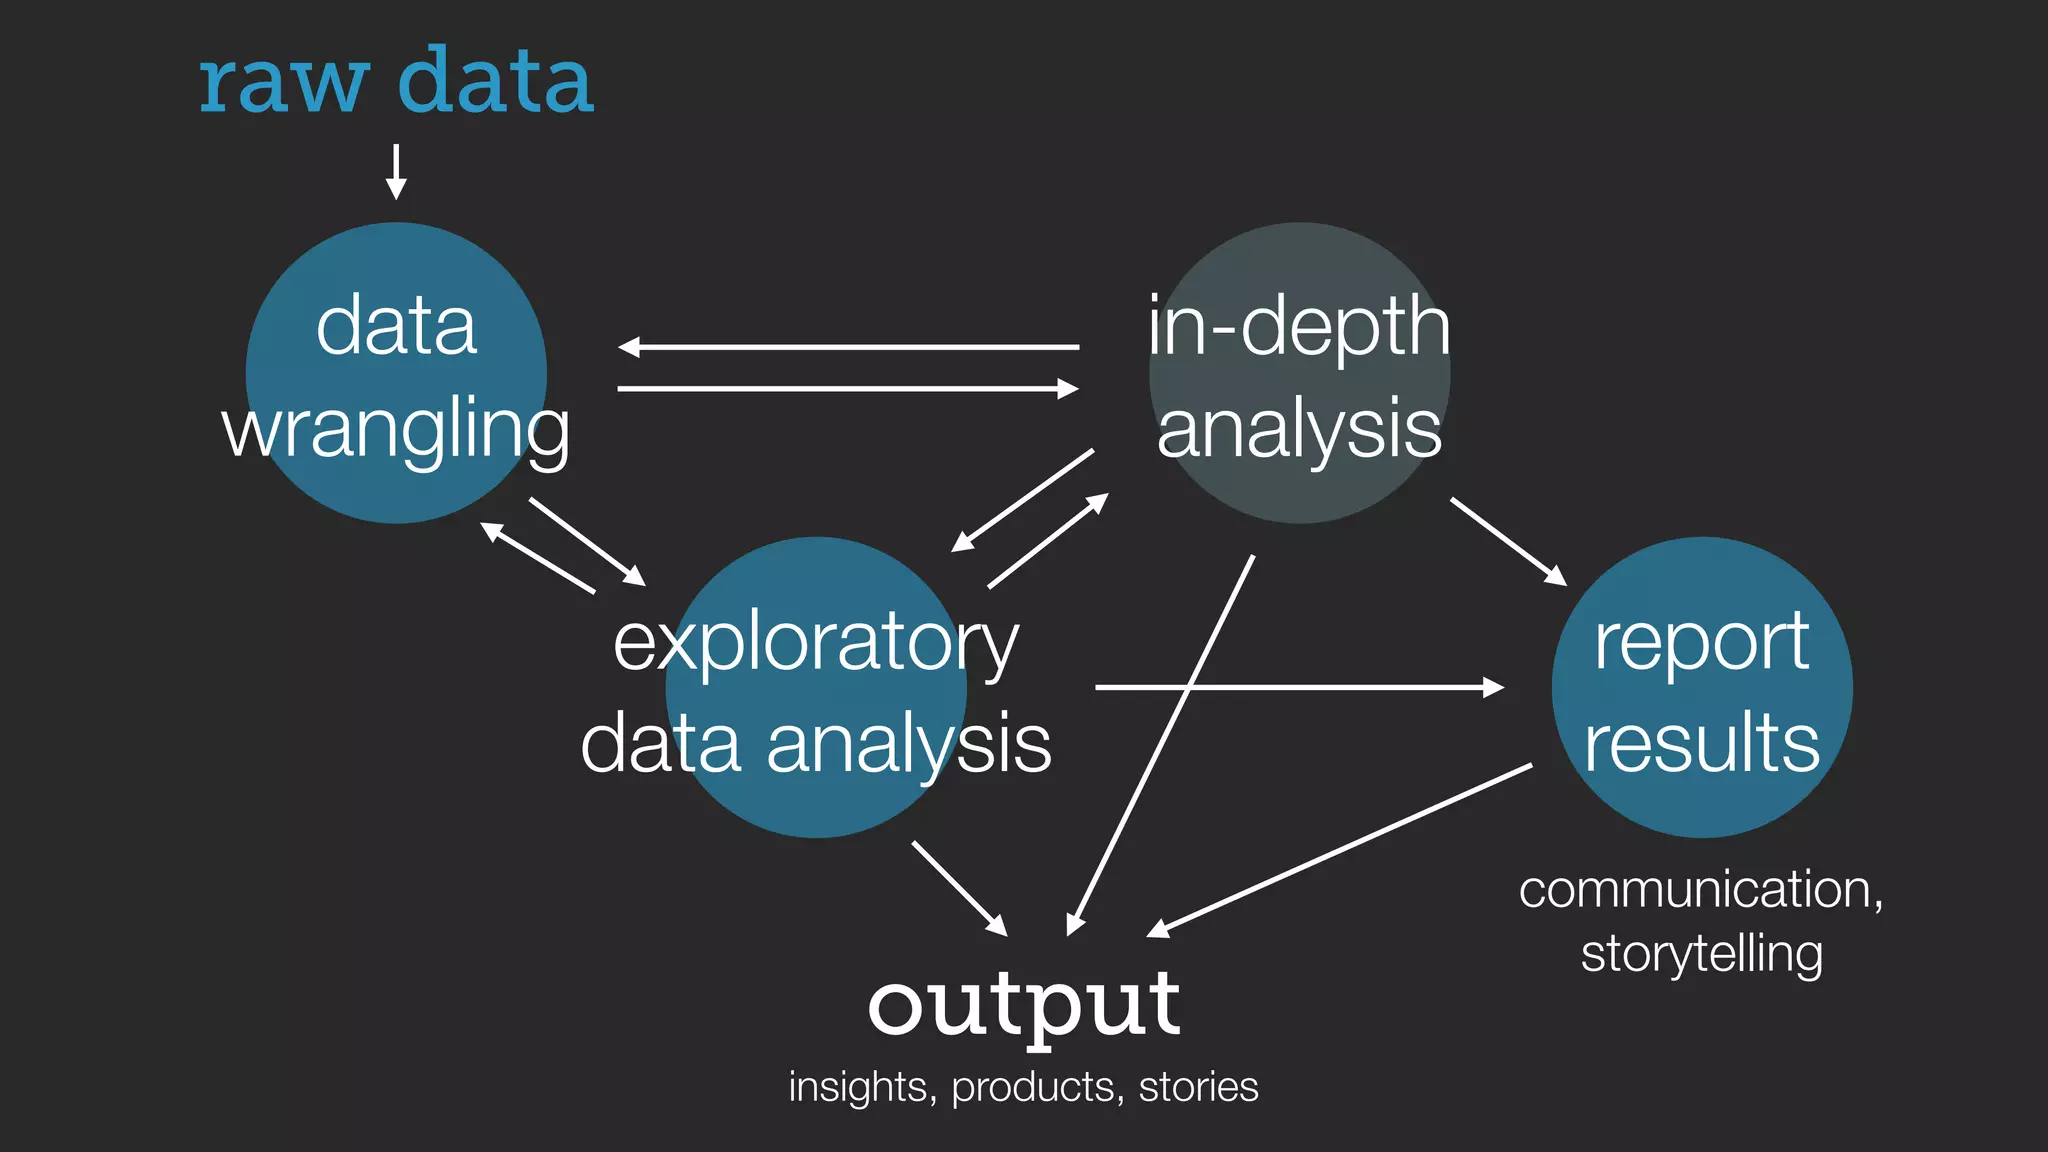
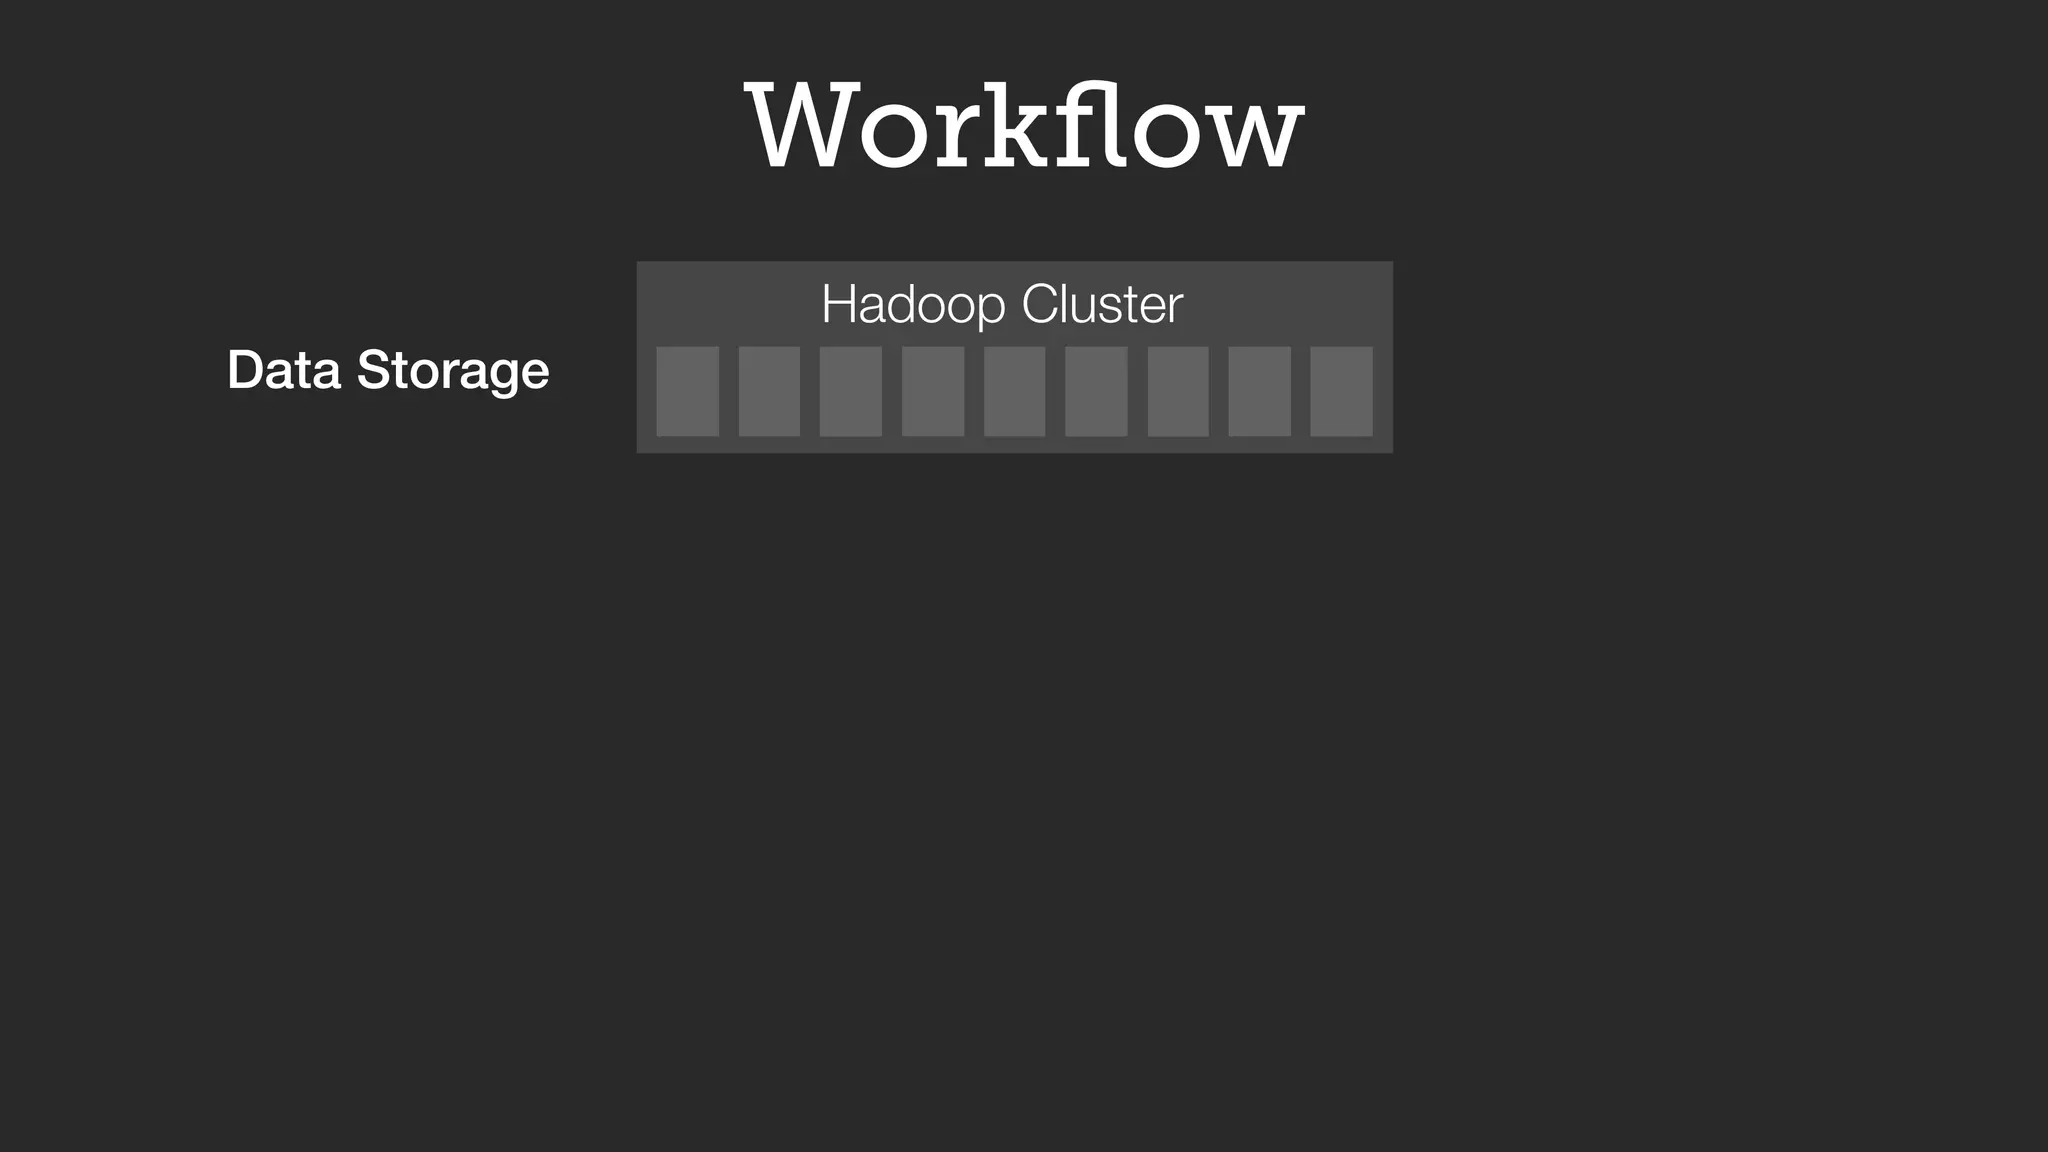
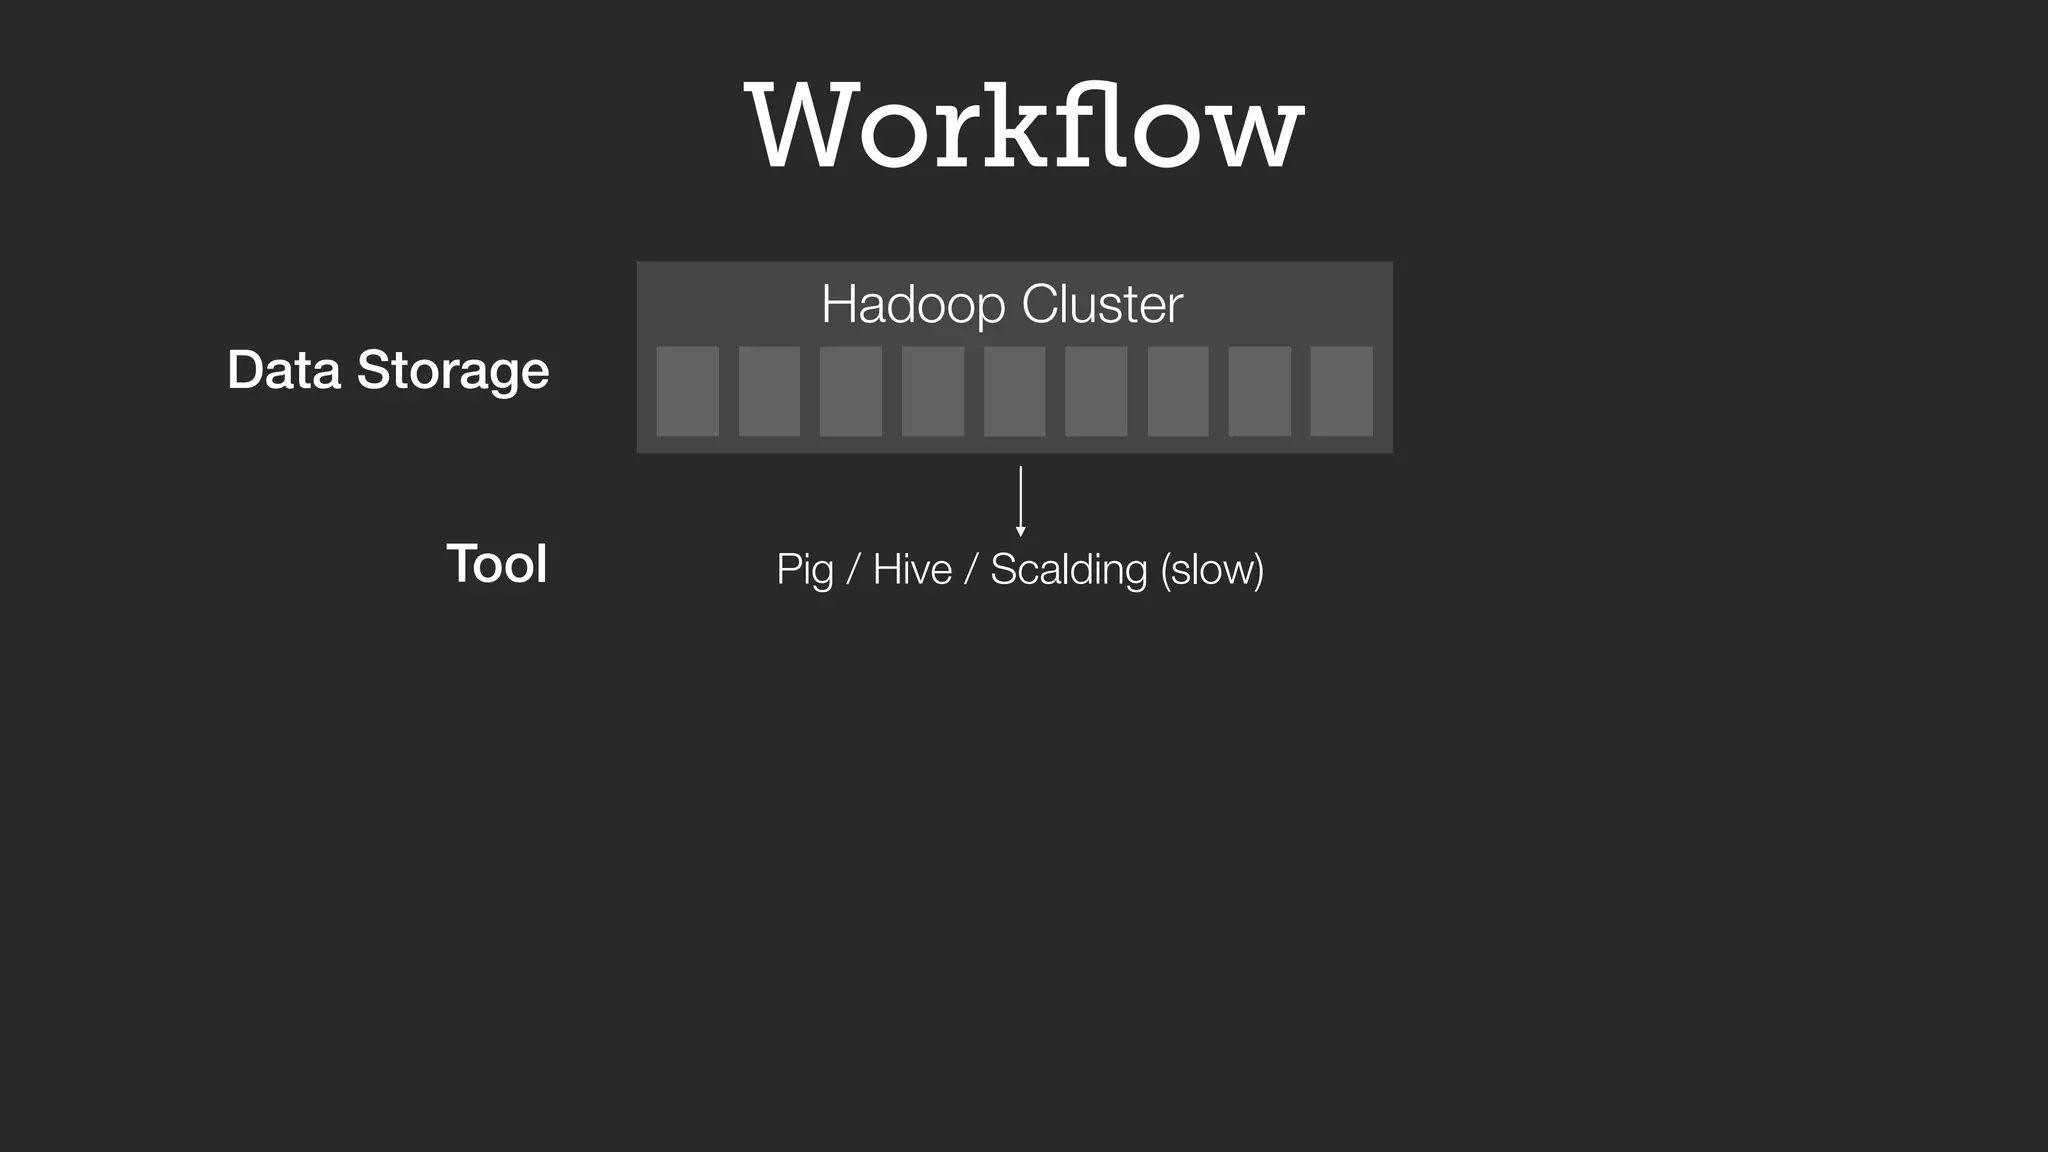
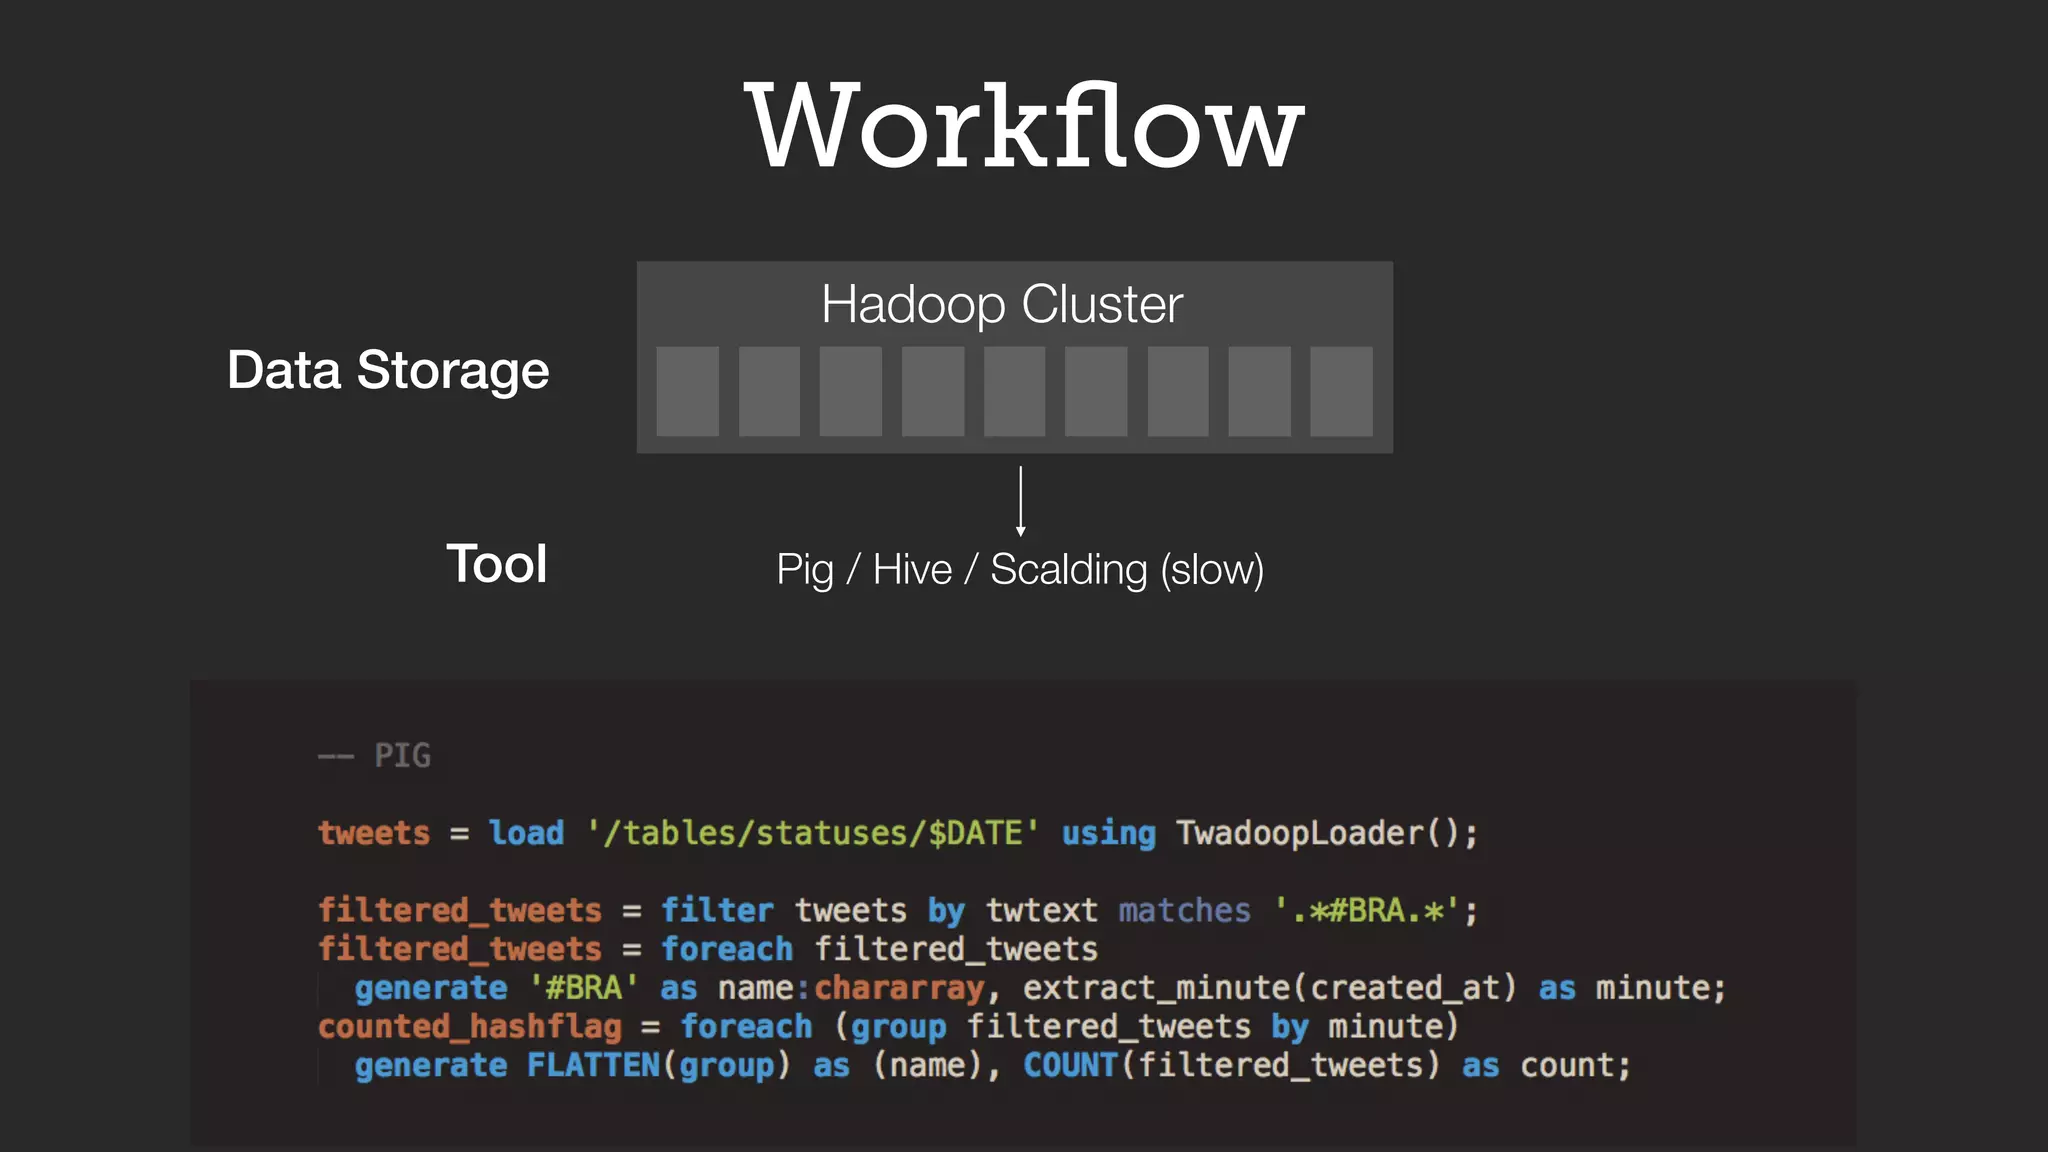
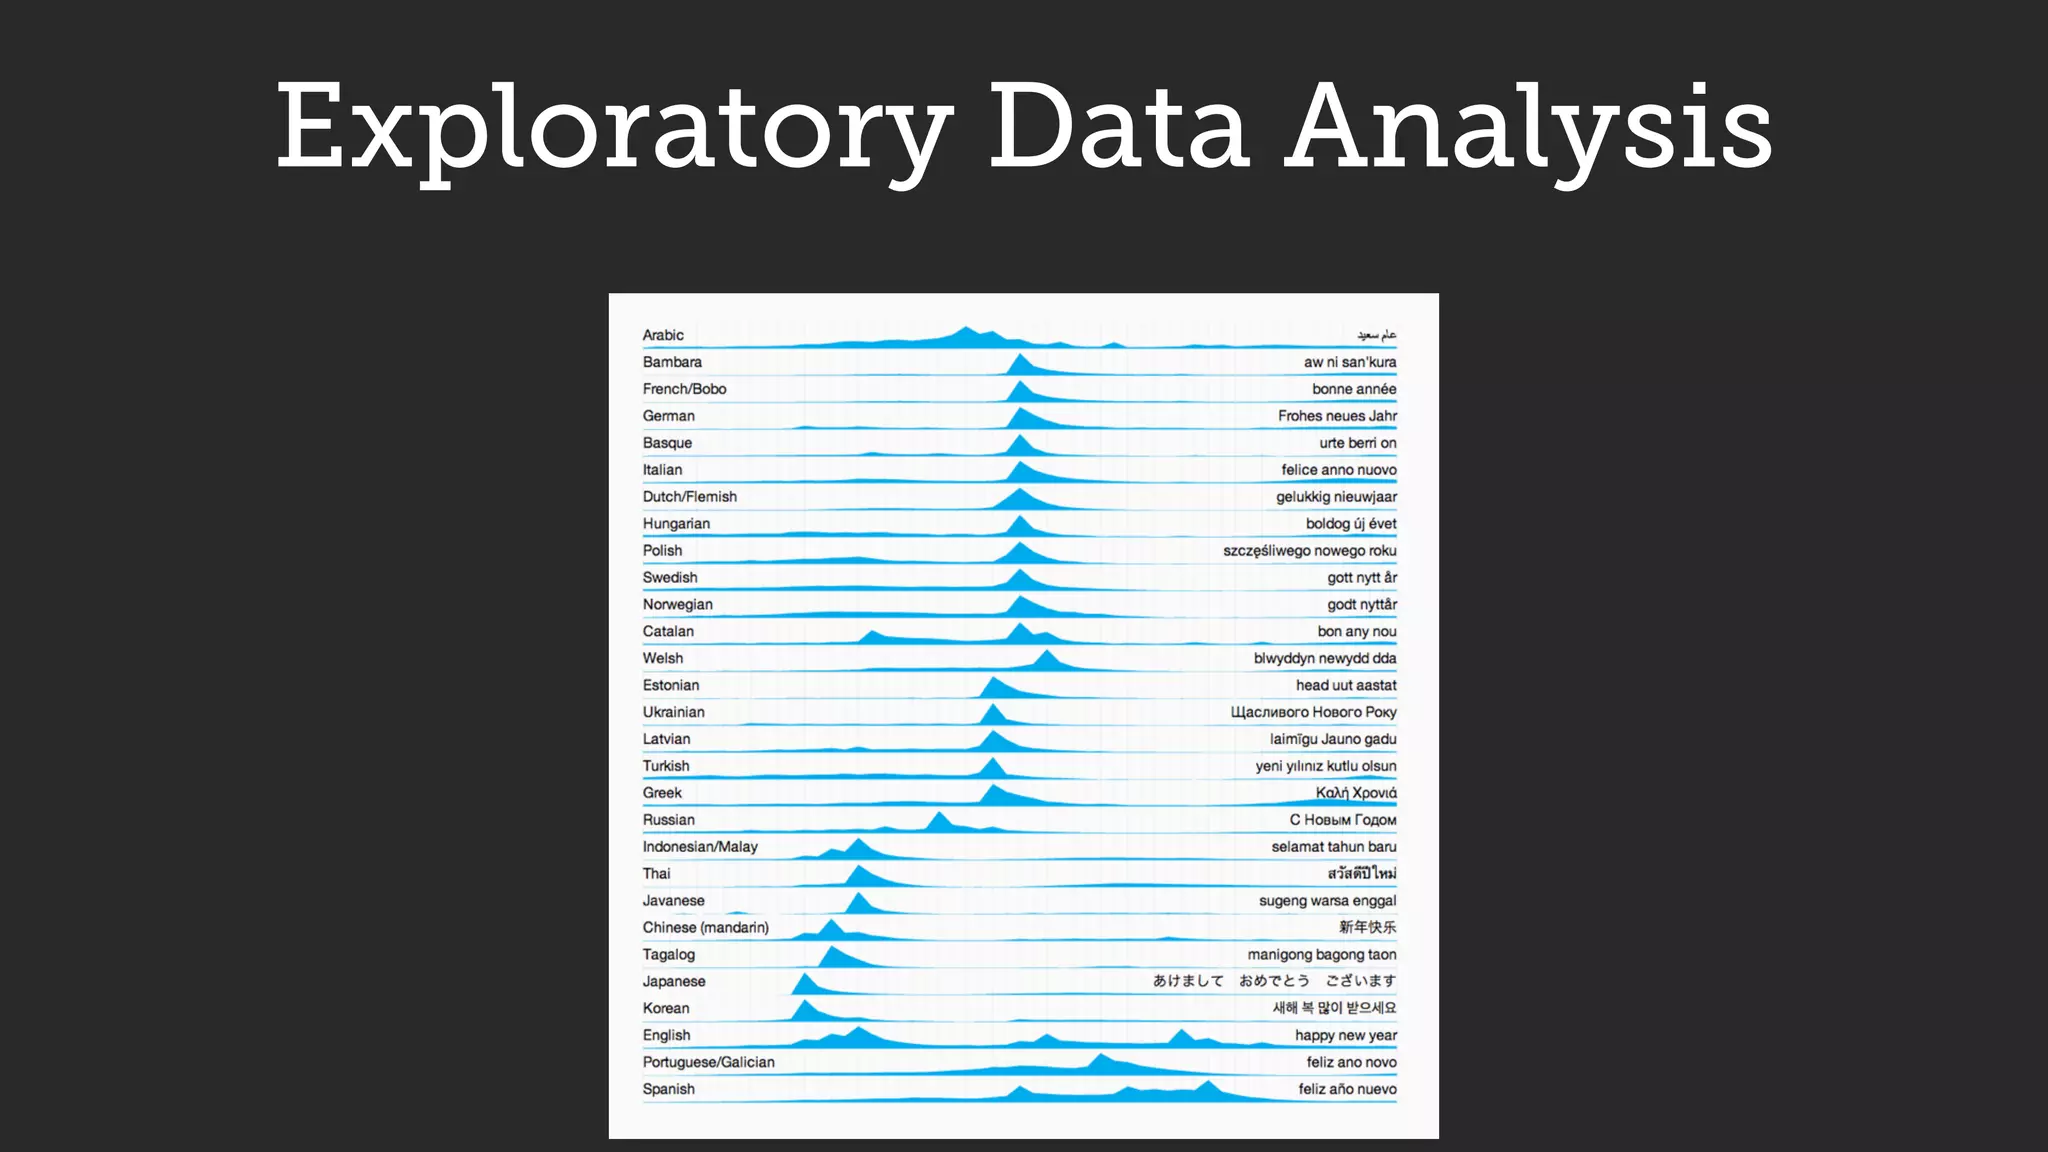
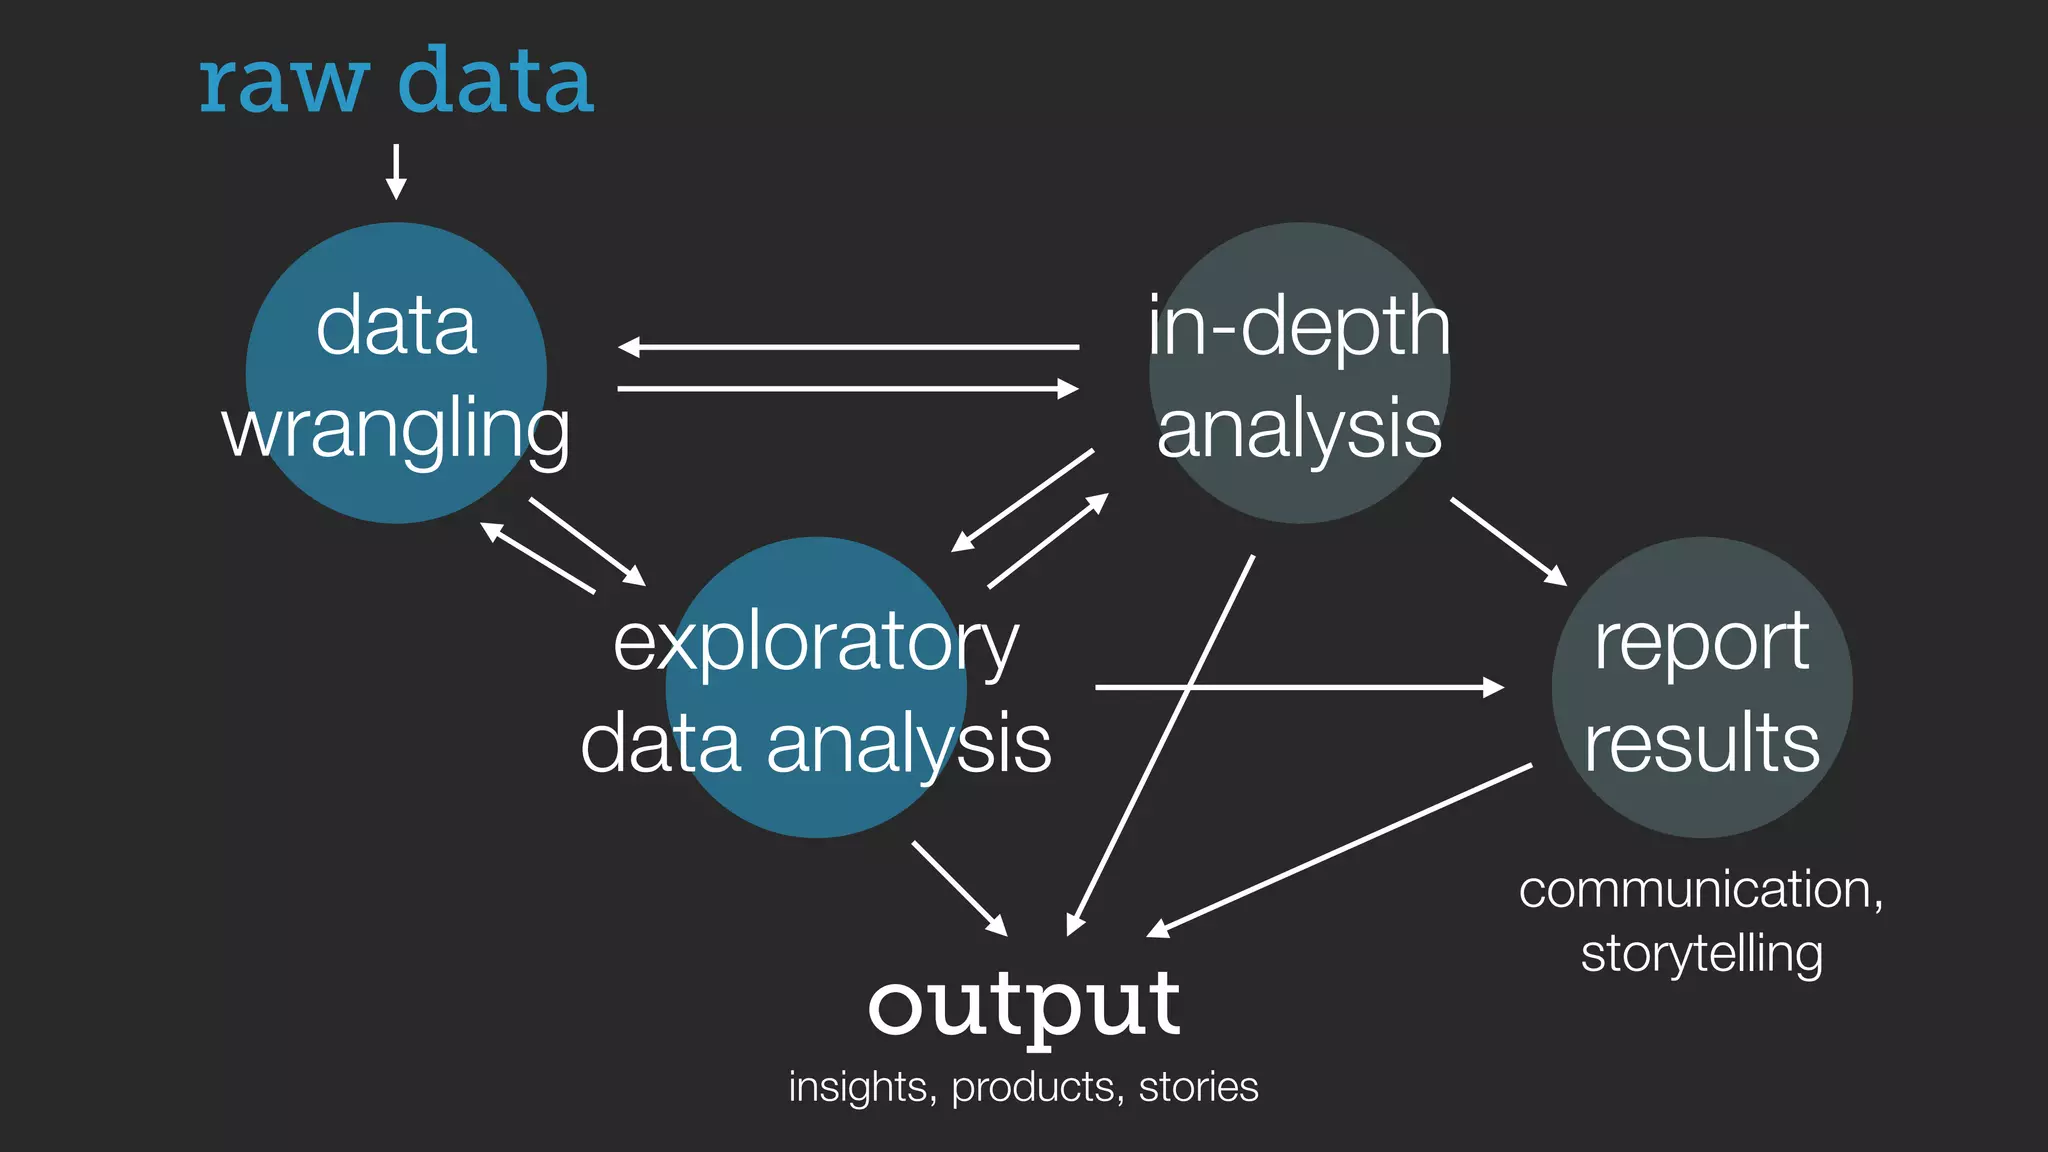
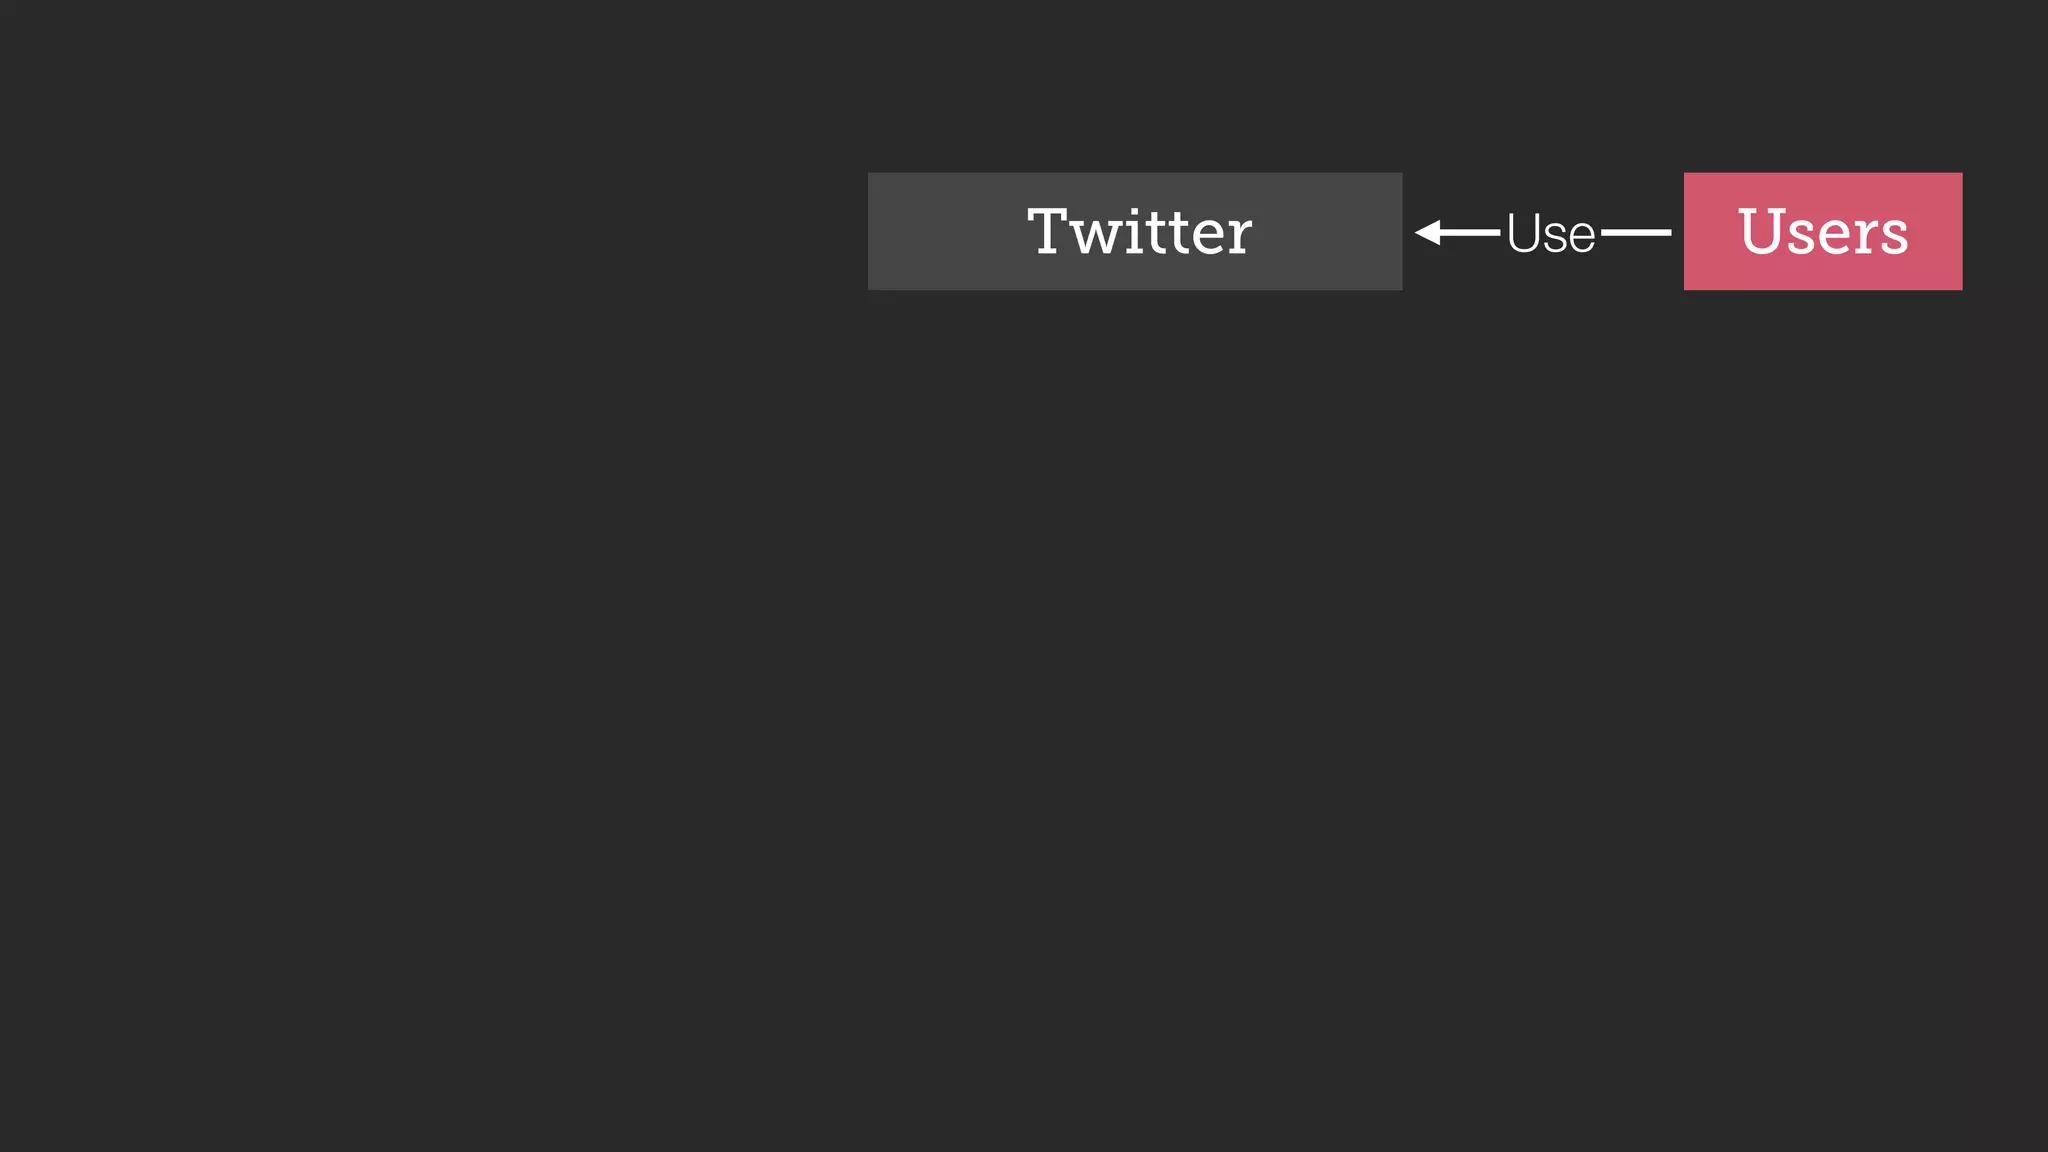
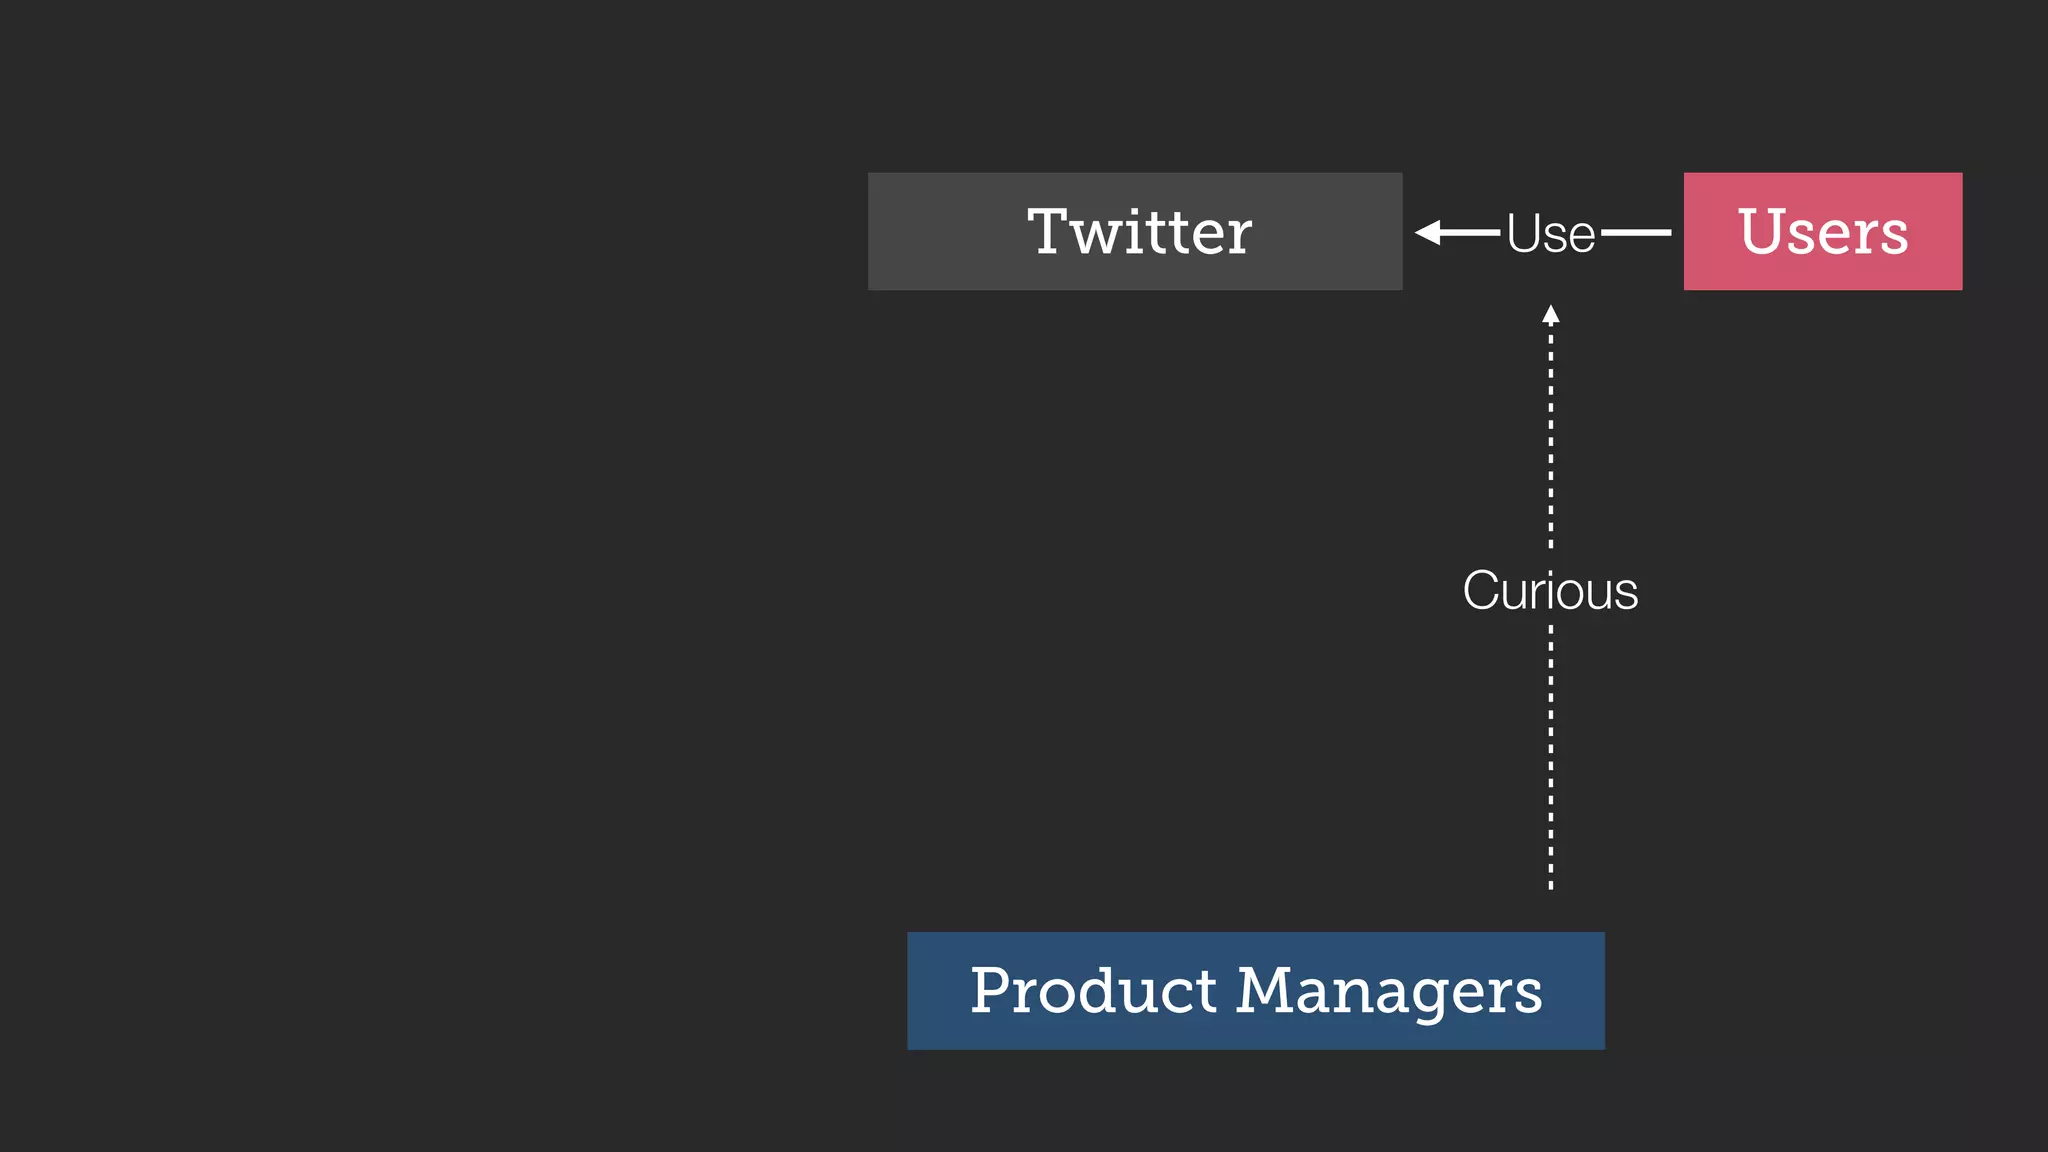
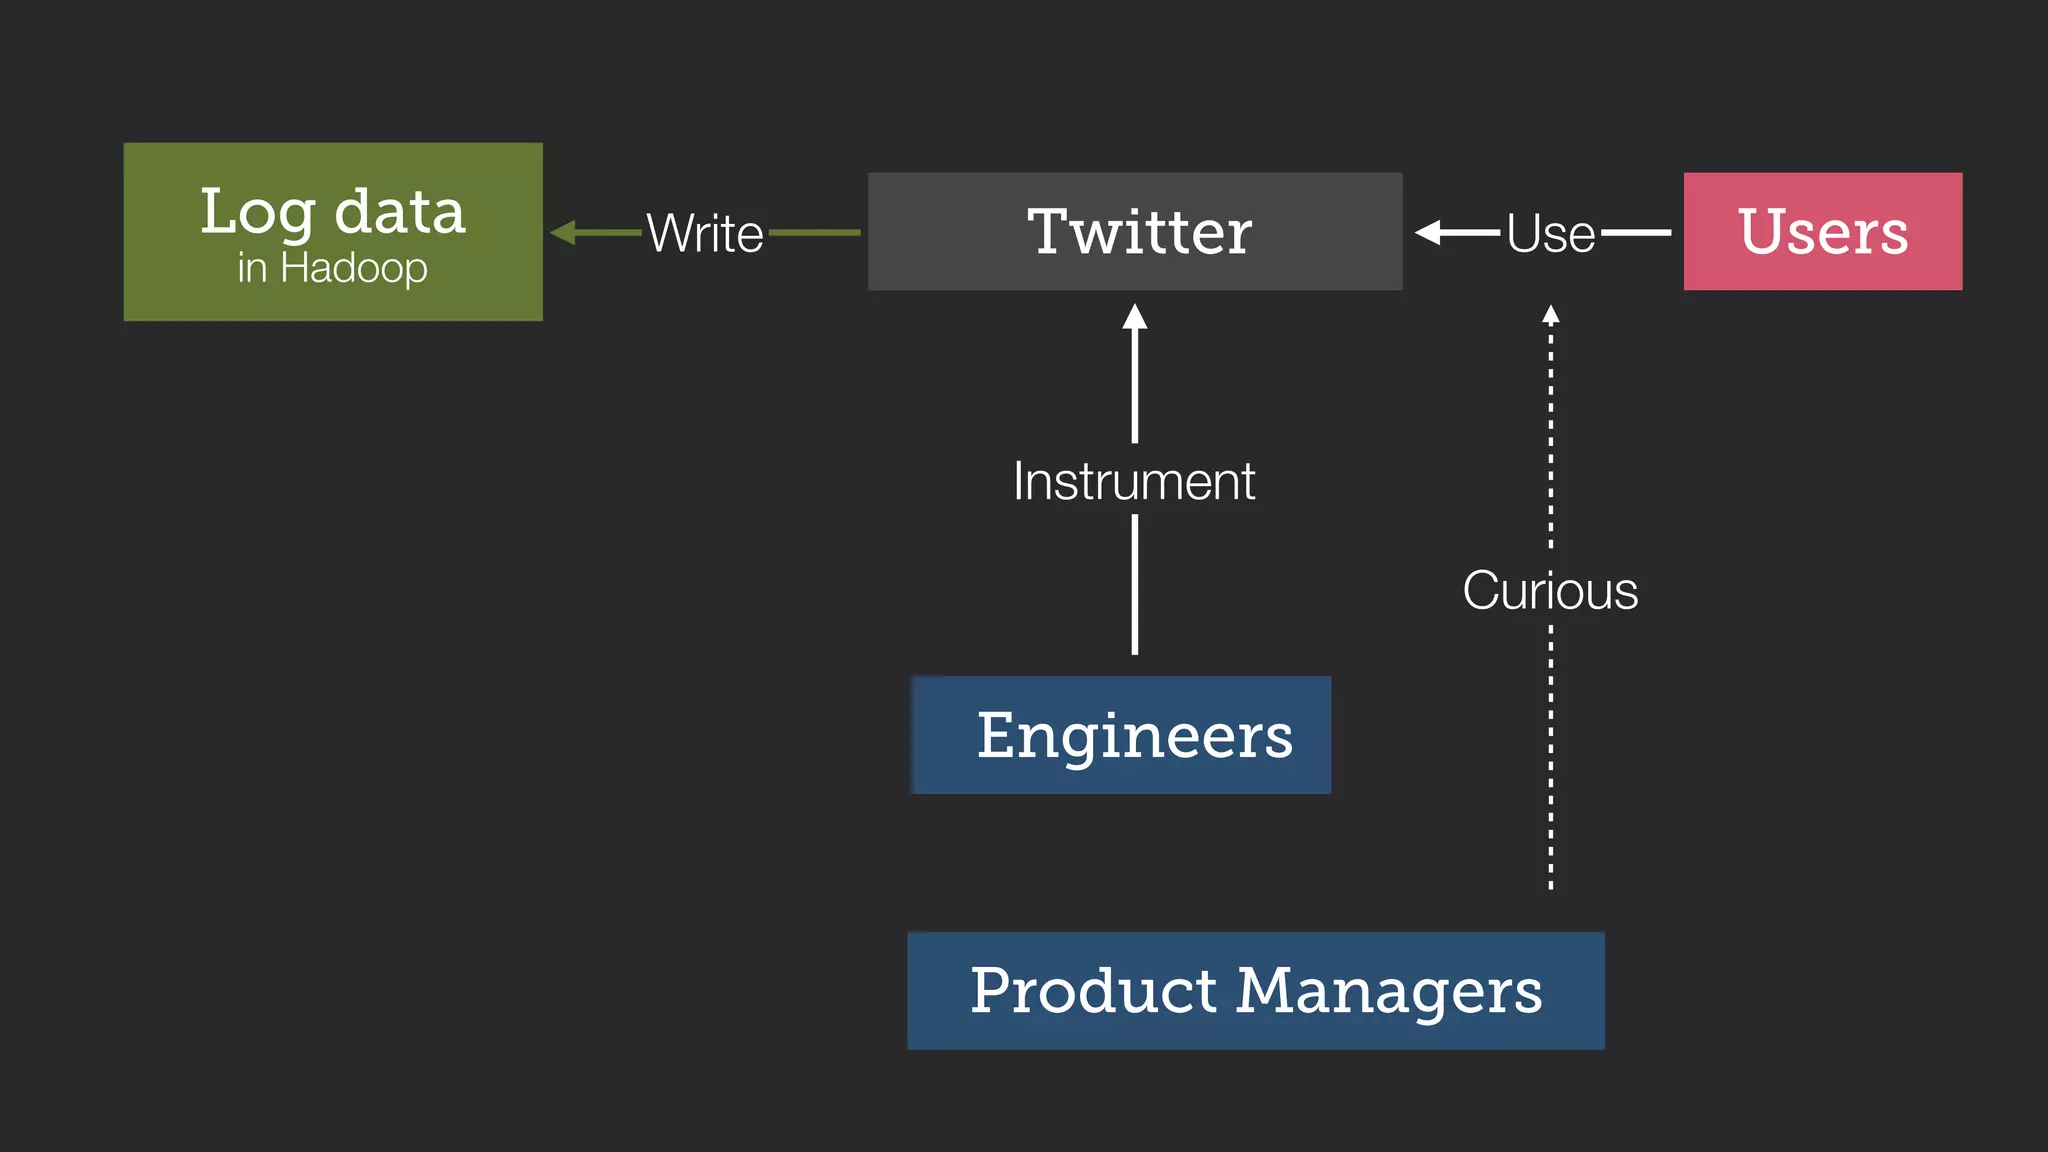
The document discusses the significance of data visualization in data science, asserting that visual displays enhance information communication and facilitate exploratory data analysis. It presents various projects, including analyses of Twitter data and the Cholera epidemic, demonstrating the application of data wrangling to extract insights. Additionally, it highlights the importance of visual storytelling in transforming raw data into valuable insights.


![[DSC Europe 25] Branko Dzakula - From Defense to Attack: How AI Redefines Cyb...](https://cdn.slidesharecdn.com/ss_thumbnails/80bdzdxpr3ky2g0qvyk9-8-251211083048-ce5fc1ee-thumbnail.jpg?width=640&height=640&fit=bounds)

![[DSC Europe 25] Tatevik Maytesyan - How to actually use AI in marketing: gett...](https://cdn.slidesharecdn.com/ss_thumbnails/tjo626lsqdgfntbgl2mw-4-251216103155-e36cd239-thumbnail.jpg?width=640&height=640&fit=bounds)

![[DSC Europe 25] Behzad Hosseini - AI Agents in the Wild: Deploying Models tha...](https://cdn.slidesharecdn.com/ss_thumbnails/3qtejajvsjqrzwfept2c-10-251212103250-7f2b1068-thumbnail.jpg?width=640&height=640&fit=bounds)
![[DSC Europe 25] Hans Kleinsman - The Compliance Gearbox: How Tax Tech Mediate...](https://cdn.slidesharecdn.com/ss_thumbnails/dxdytie1toel0hr90bjs-2-251212103250-174fdbe7-thumbnail.jpg?width=640&height=640&fit=bounds)

![[DSC Europe 25] Miodrag Pesovic & Vladislav Radonjic - Federated Data Archite...](https://cdn.slidesharecdn.com/ss_thumbnails/gsbe3y5it5uhndi4e08e-1-251212103249-f1008e0c-thumbnail.jpg?width=640&height=640&fit=bounds)
![[DSC Europe 25] Debmalya Biswas - Agentification: the art of transforming man...](https://cdn.slidesharecdn.com/ss_thumbnails/r5azlggvtqiaiiusrqdr-4-251212103249-5a12c89b-thumbnail.jpg?width=640&height=640&fit=bounds)

![[DSC Europe 25] Dunja Adzic Jovanovic - AI and Cybersecurity: Defending Data ...](https://cdn.slidesharecdn.com/ss_thumbnails/o1zylpbhrtwnixxq2xj8-7-251211083048-185086f6-thumbnail.jpg?width=640&height=640&fit=bounds)


![[DSC Europe 25] Dusan Nesic - Securing Tomorrow’s Infrastructure: Why Cyber-P...](https://cdn.slidesharecdn.com/ss_thumbnails/qikbszfftyowjm2q6duw-1-251211083848-8f2ead6b-thumbnail.jpg?width=640&height=640&fit=bounds)

