Downloaded 14 times


![LOG EVENT A.K.A. “CLIENT EVENT”
[Lee et al. 2012]](https://image.slidesharecdn.com/whattoexpectwhenyouarevisualizingv2shared-161108193531/85/What-to-expect-when-you-are-visualizing-v-2-144-320.jpg)
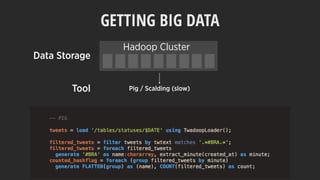
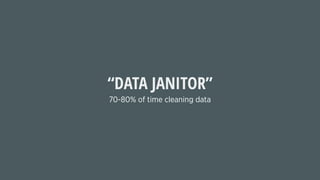
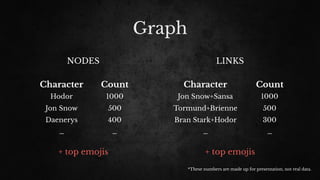
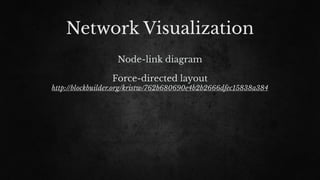
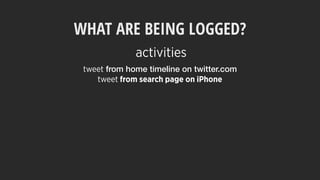
![LOG EVENT A.K.A. “CLIENT EVENT”
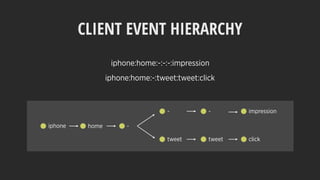
client : page : section : component : element : action
web : home : timeline : tweet_box : button : tweet
1) User ID
2) Timestamp
3) Event name
4) Event detail
[Lee et al. 2012]](https://image.slidesharecdn.com/whattoexpectwhenyouarevisualizingv2shared-161108193531/85/What-to-expect-when-you-are-visualizing-v-2-145-320.jpg)


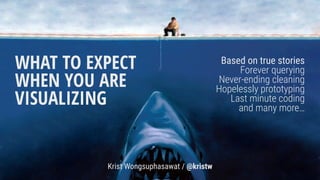
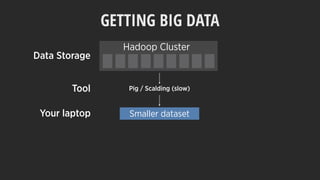
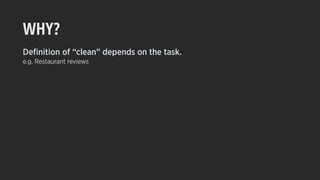
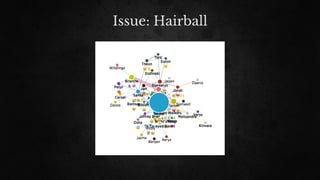
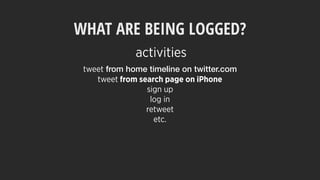
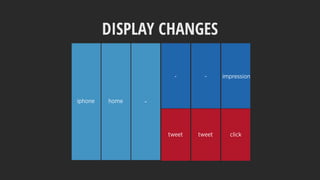
![DISPLAY CHANGES
iphone home -
- - impression
tweet tweet click
Map of the Market [Wattenberg 1999], StemView [Guerra-Gomez et al. 2013]](https://image.slidesharecdn.com/whattoexpectwhenyouarevisualizingv2shared-161108193531/85/What-to-expect-when-you-are-visualizing-v-2-160-320.jpg)


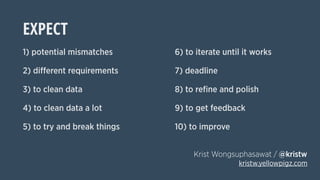


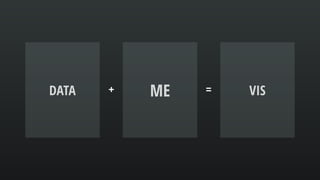
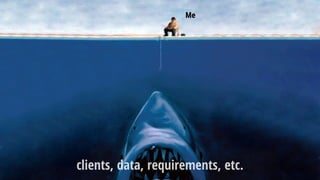
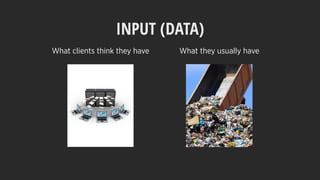
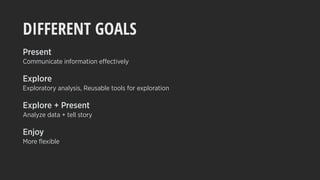
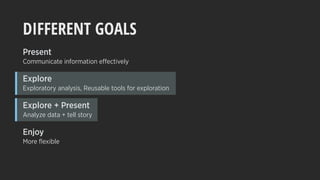
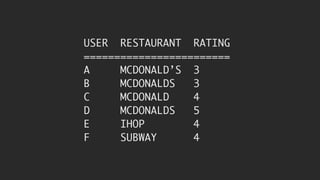
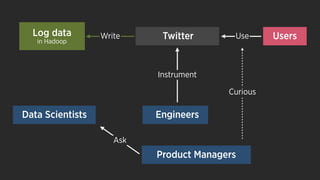
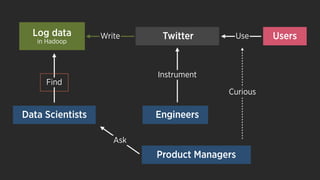
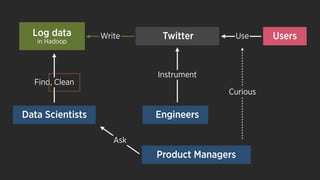
This document summarizes the key expectations and challenges when visualizing data or building visual analytics tools. There are several main points: 1. Expect potential mismatches between what clients think they need versus what the data and visualization actually require, requiring clear communication and compromise. 2. Different projects will have different goals that require flexibility in the types of visualizations created, whether for presentation, exploration, or both. 3. A significant amount of time, often 70-80%, will be spent cleaning and preparing data prior to visualization due to issues like missing values, formatting inconsistencies, and data quality problems. 4. Iteration is essential to work out bugs and refine visualizations to best meet requirements and dead