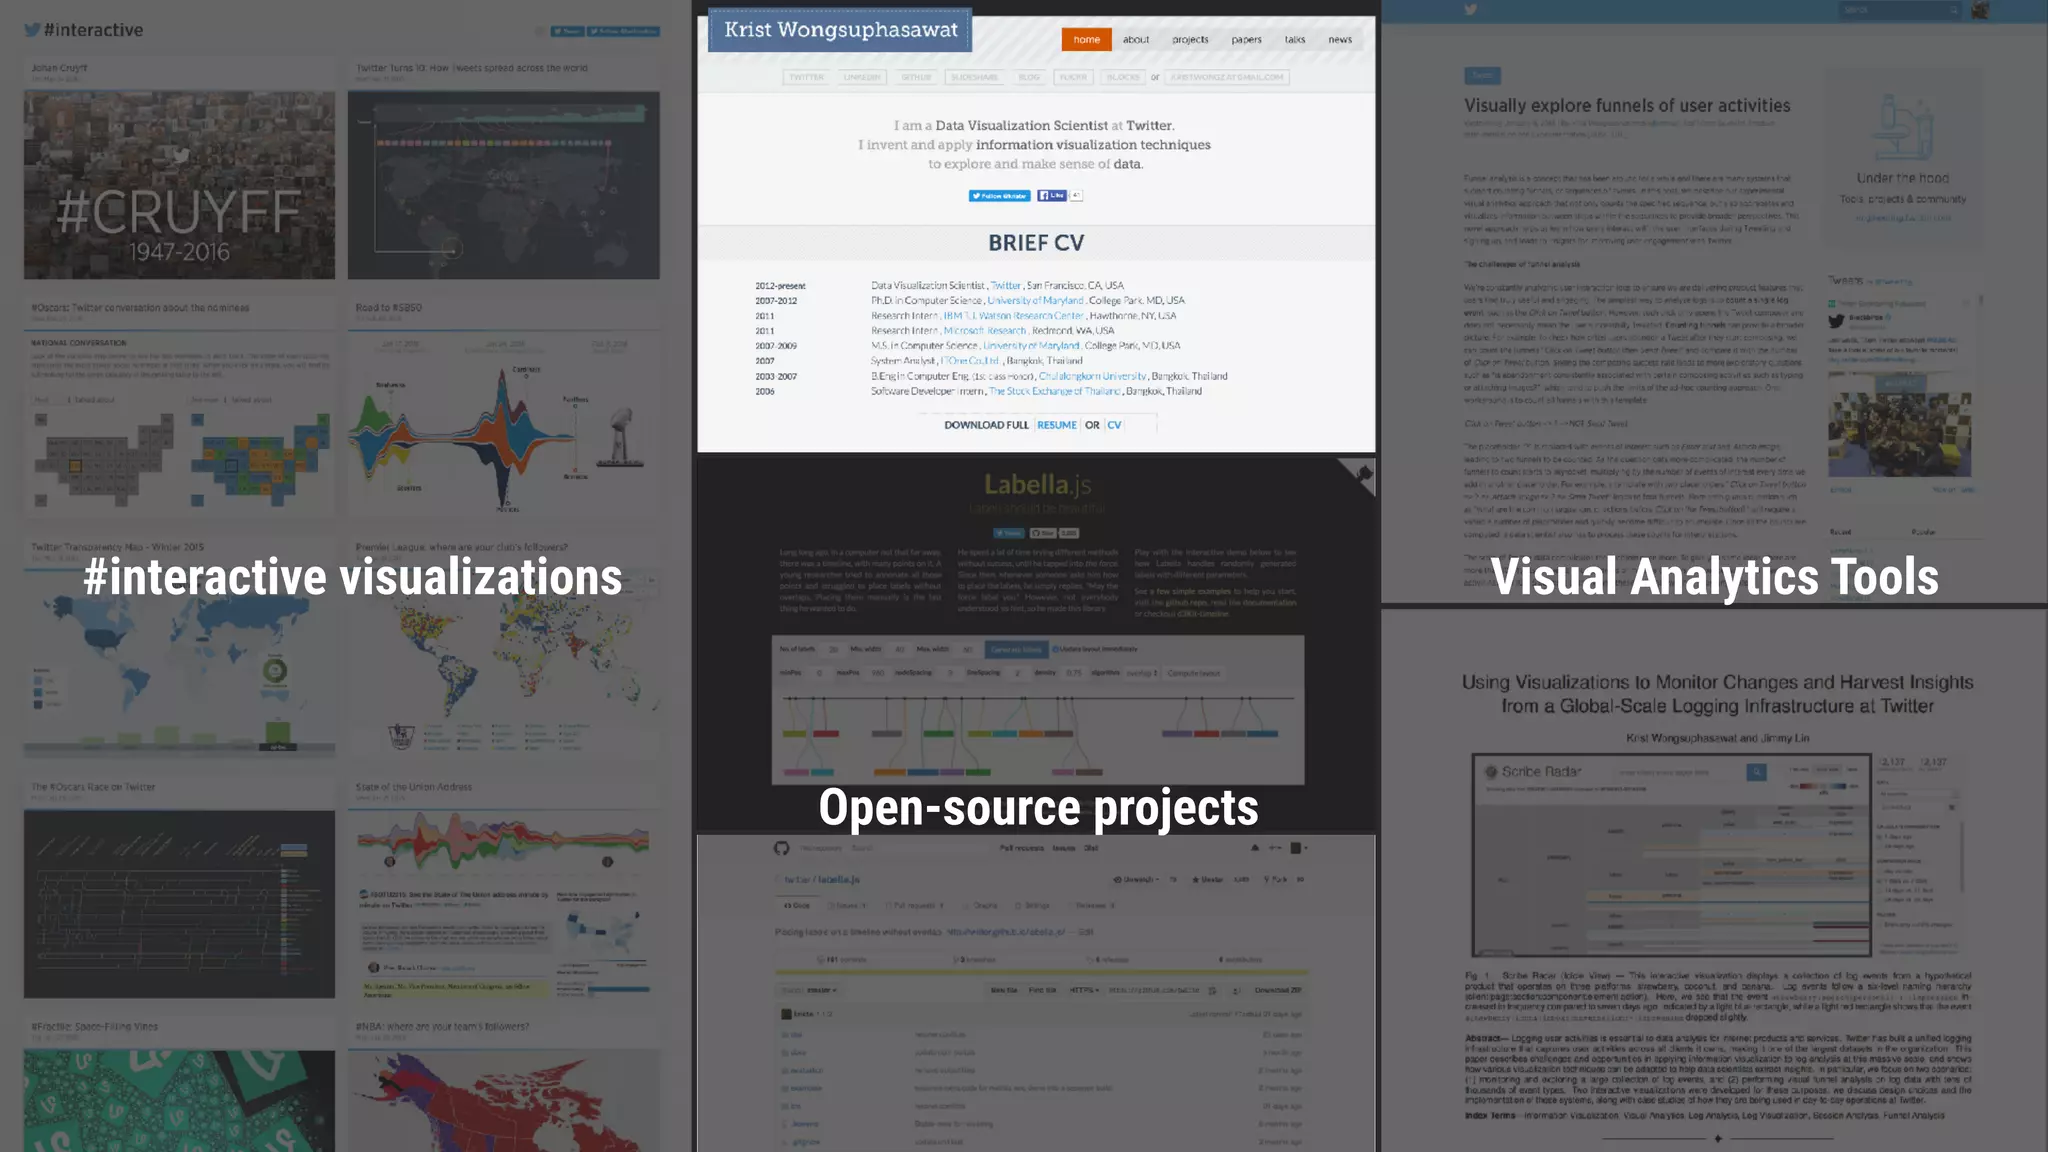
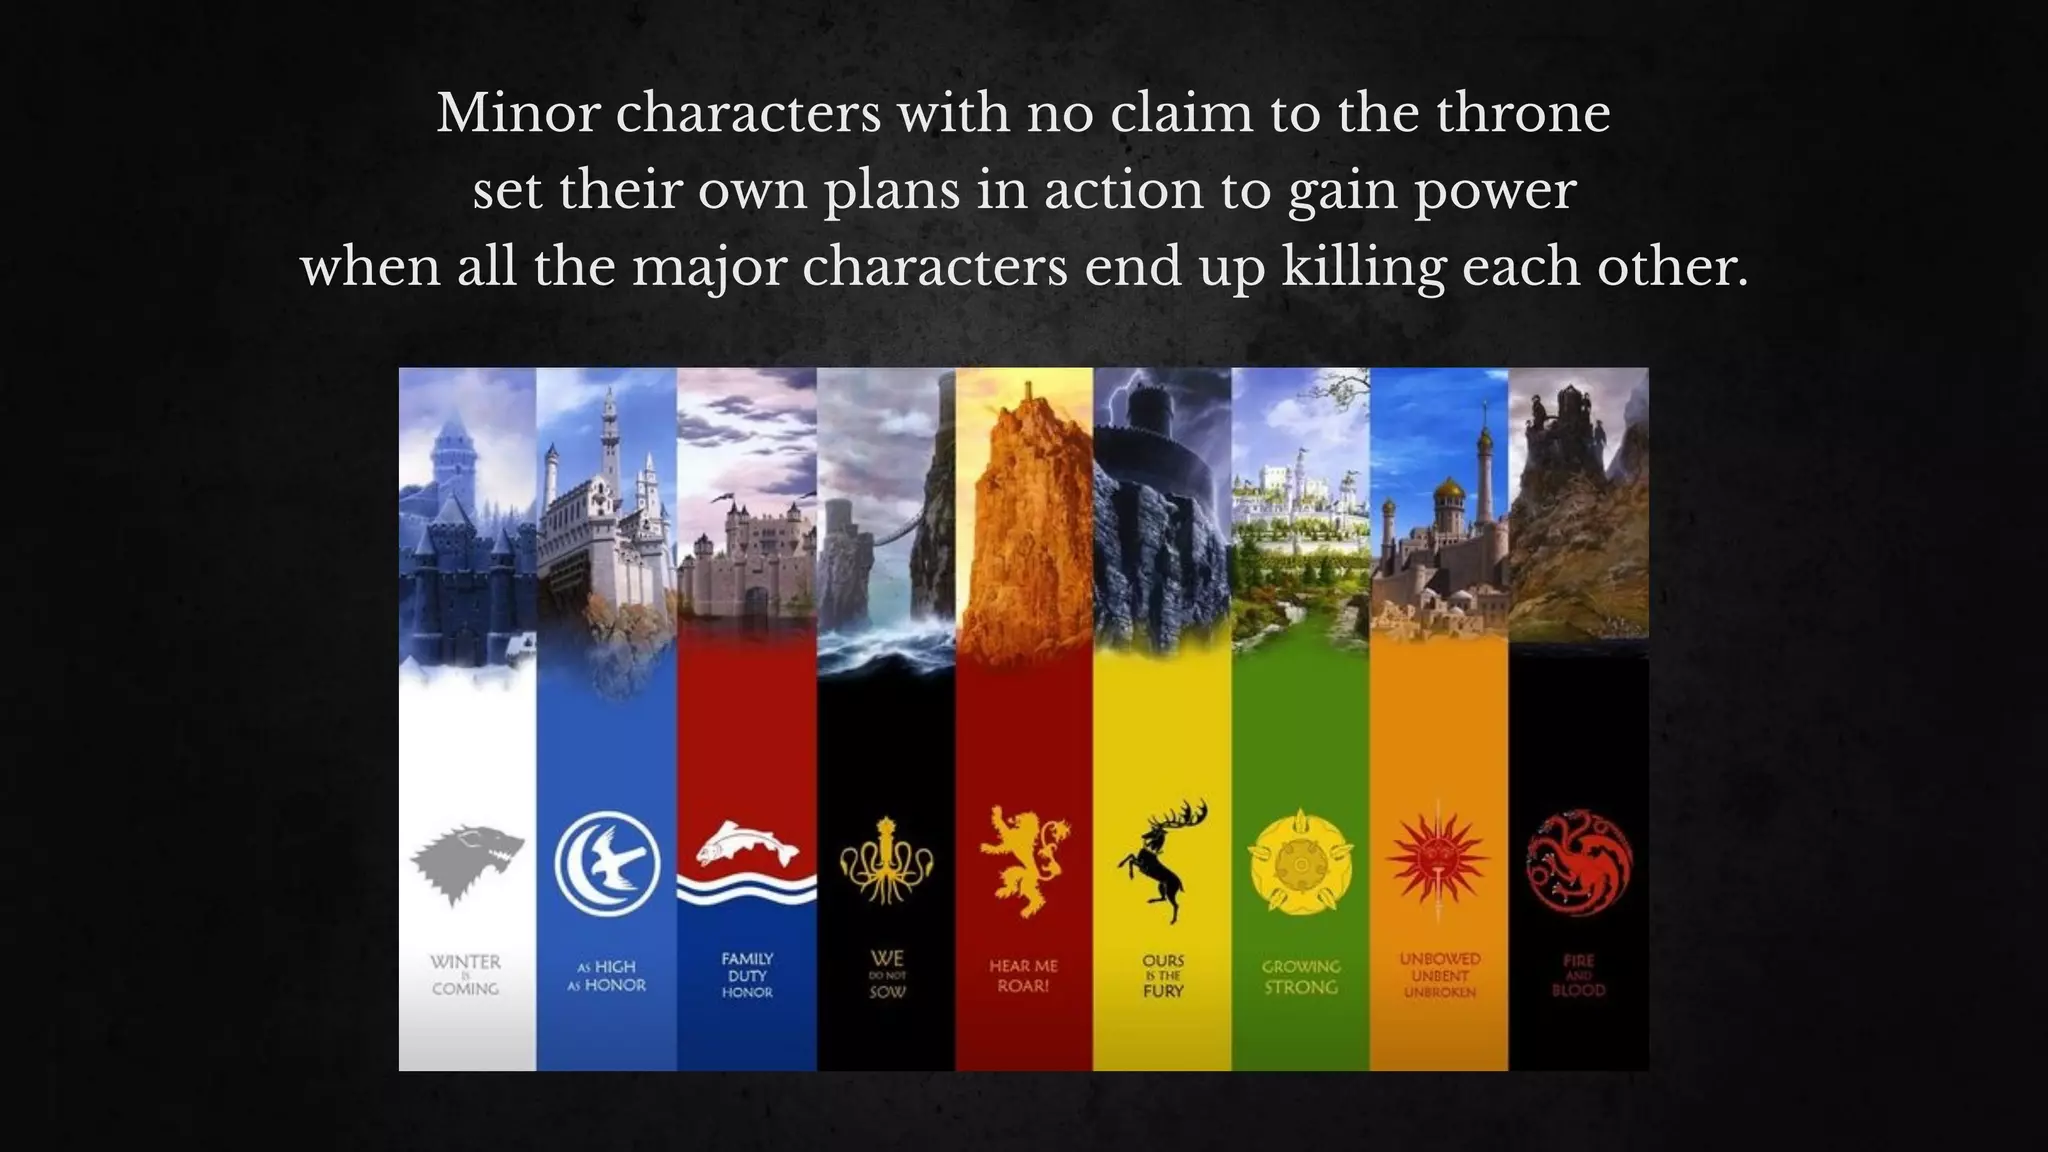
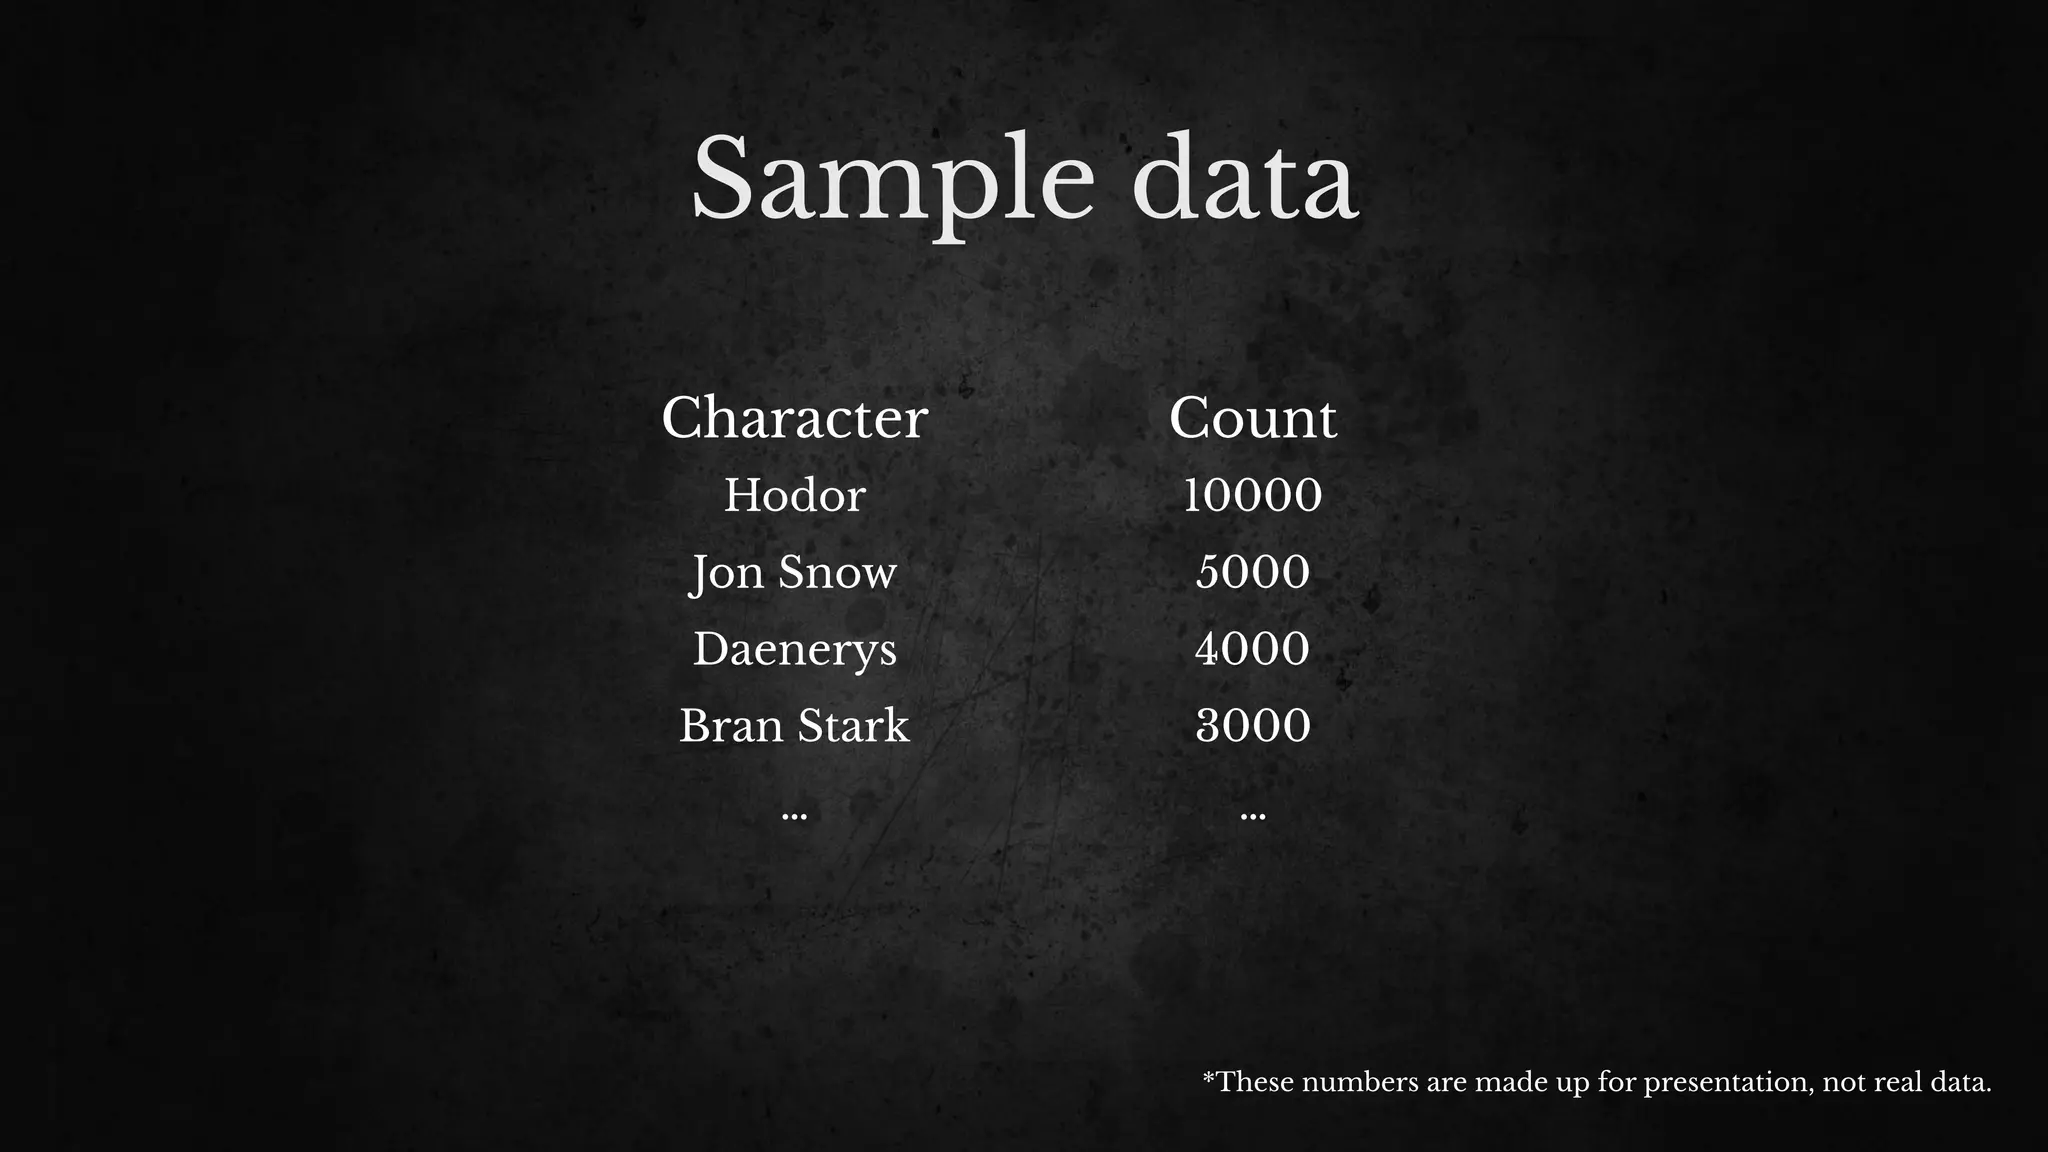
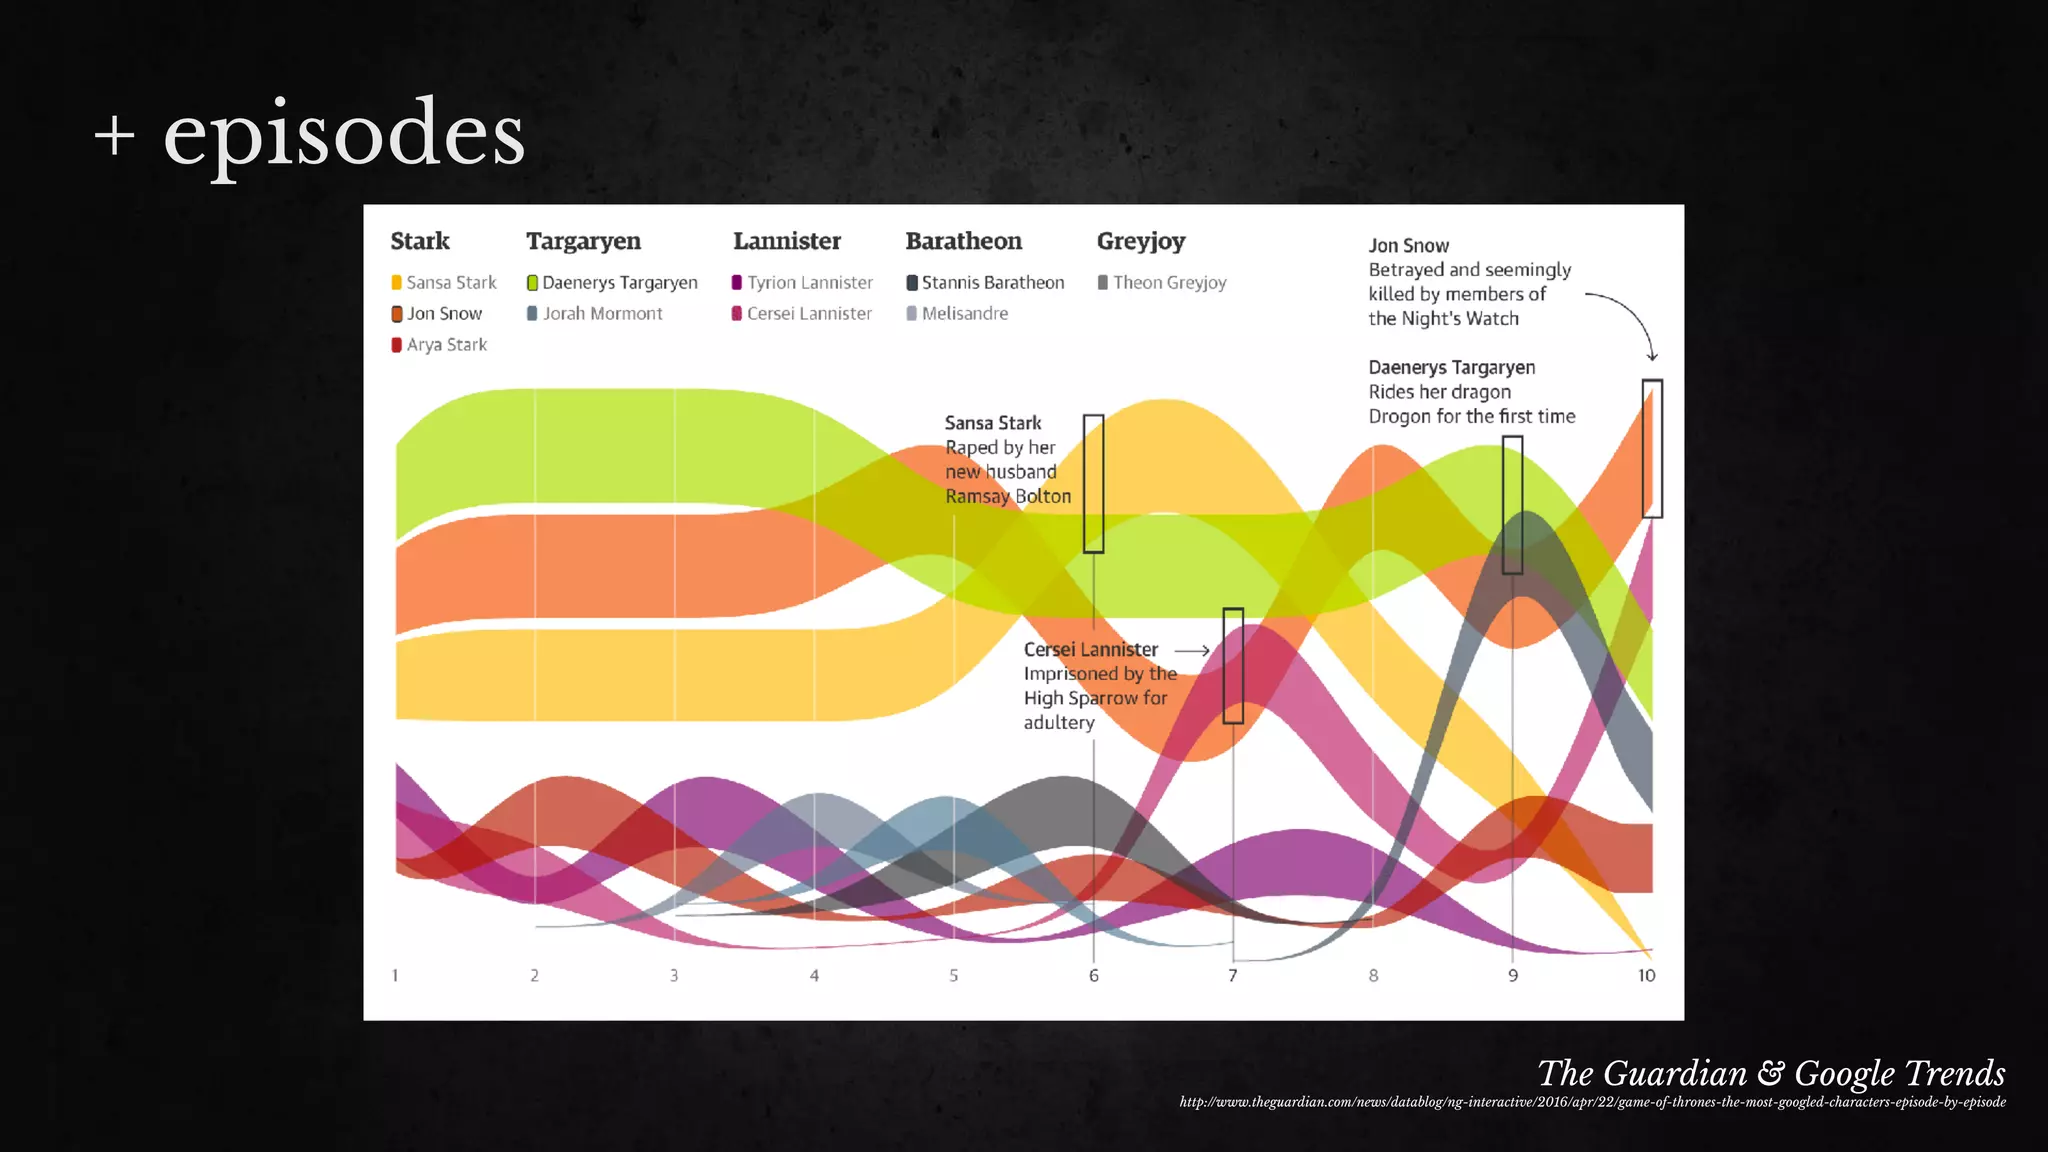
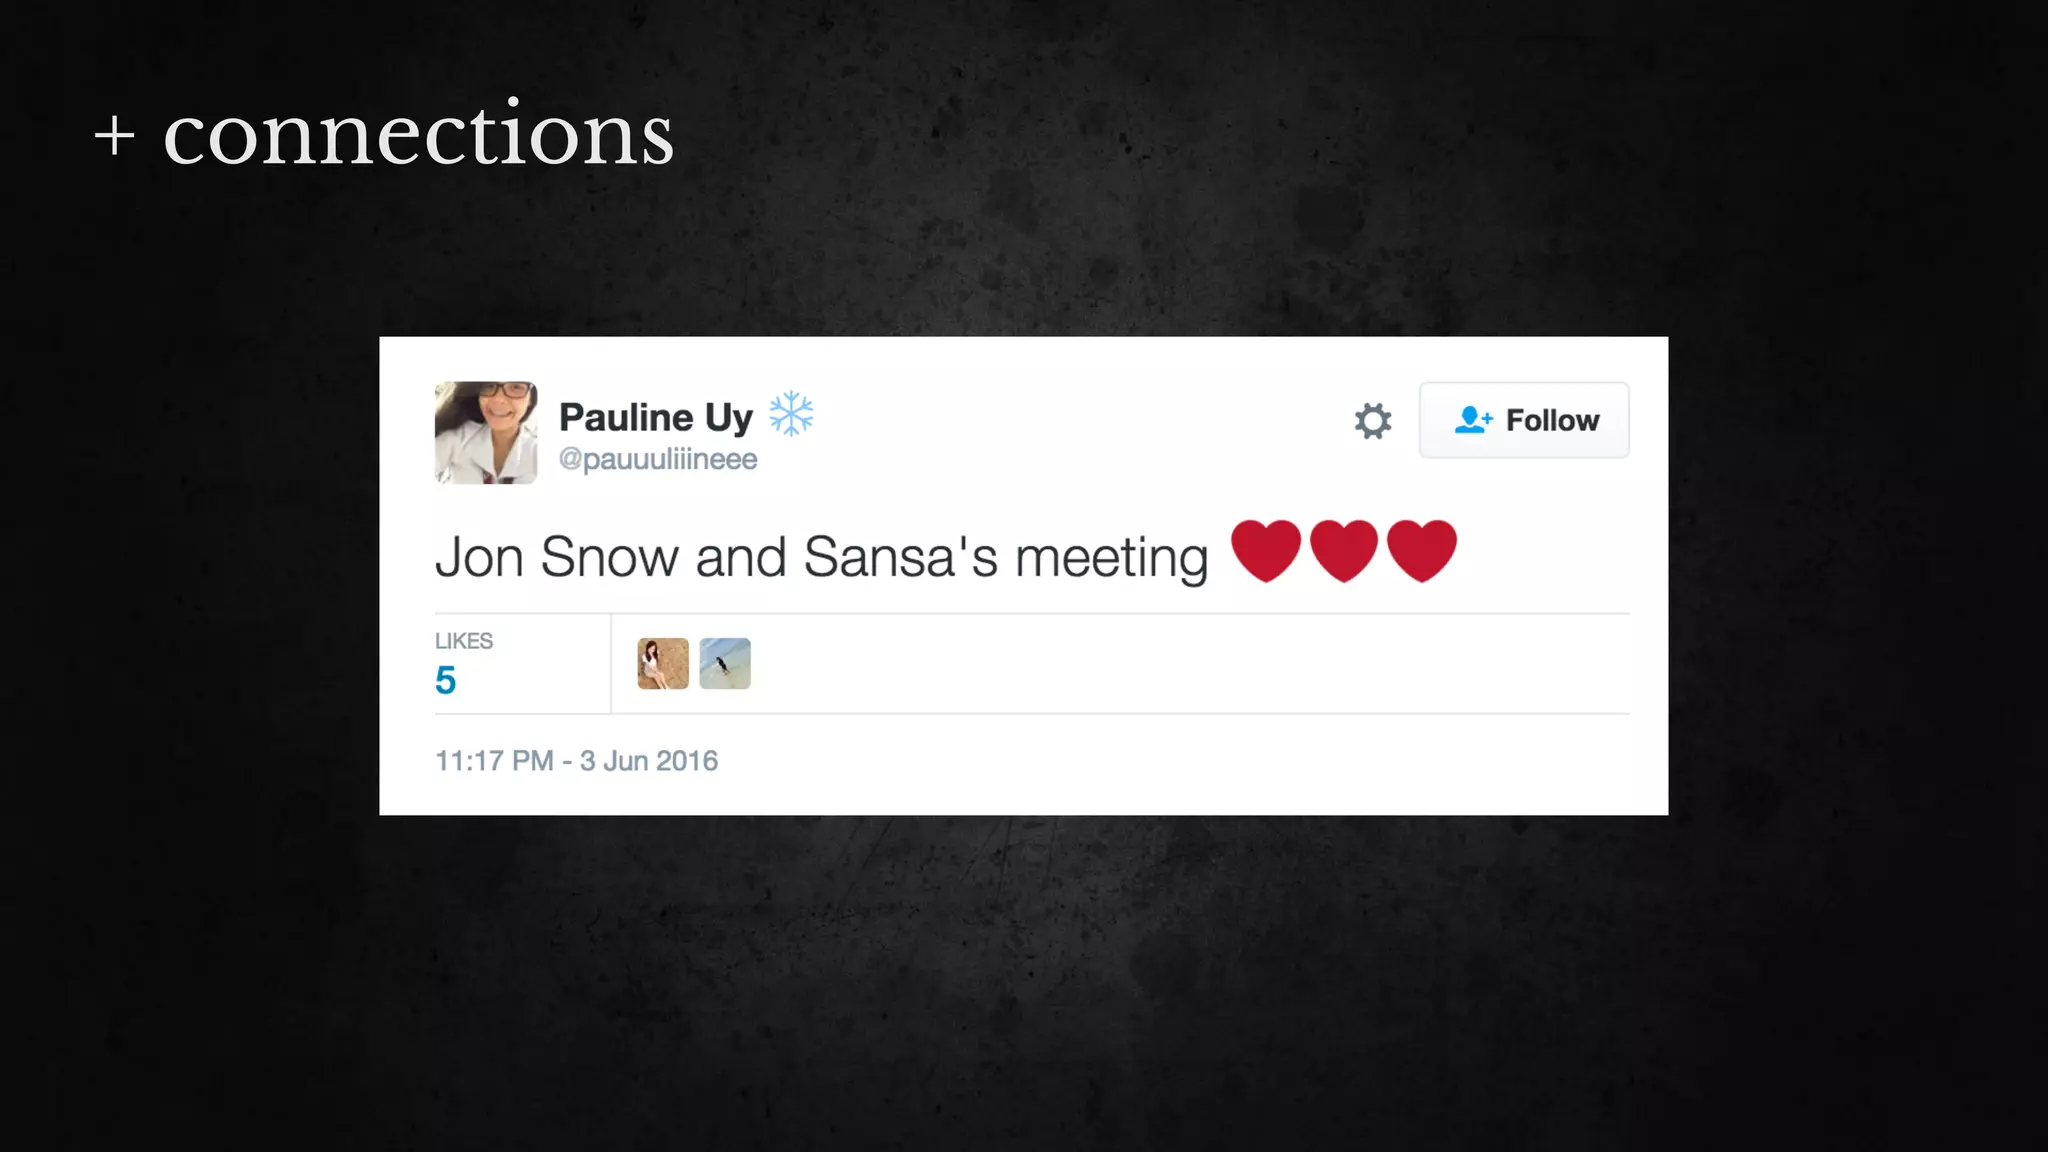
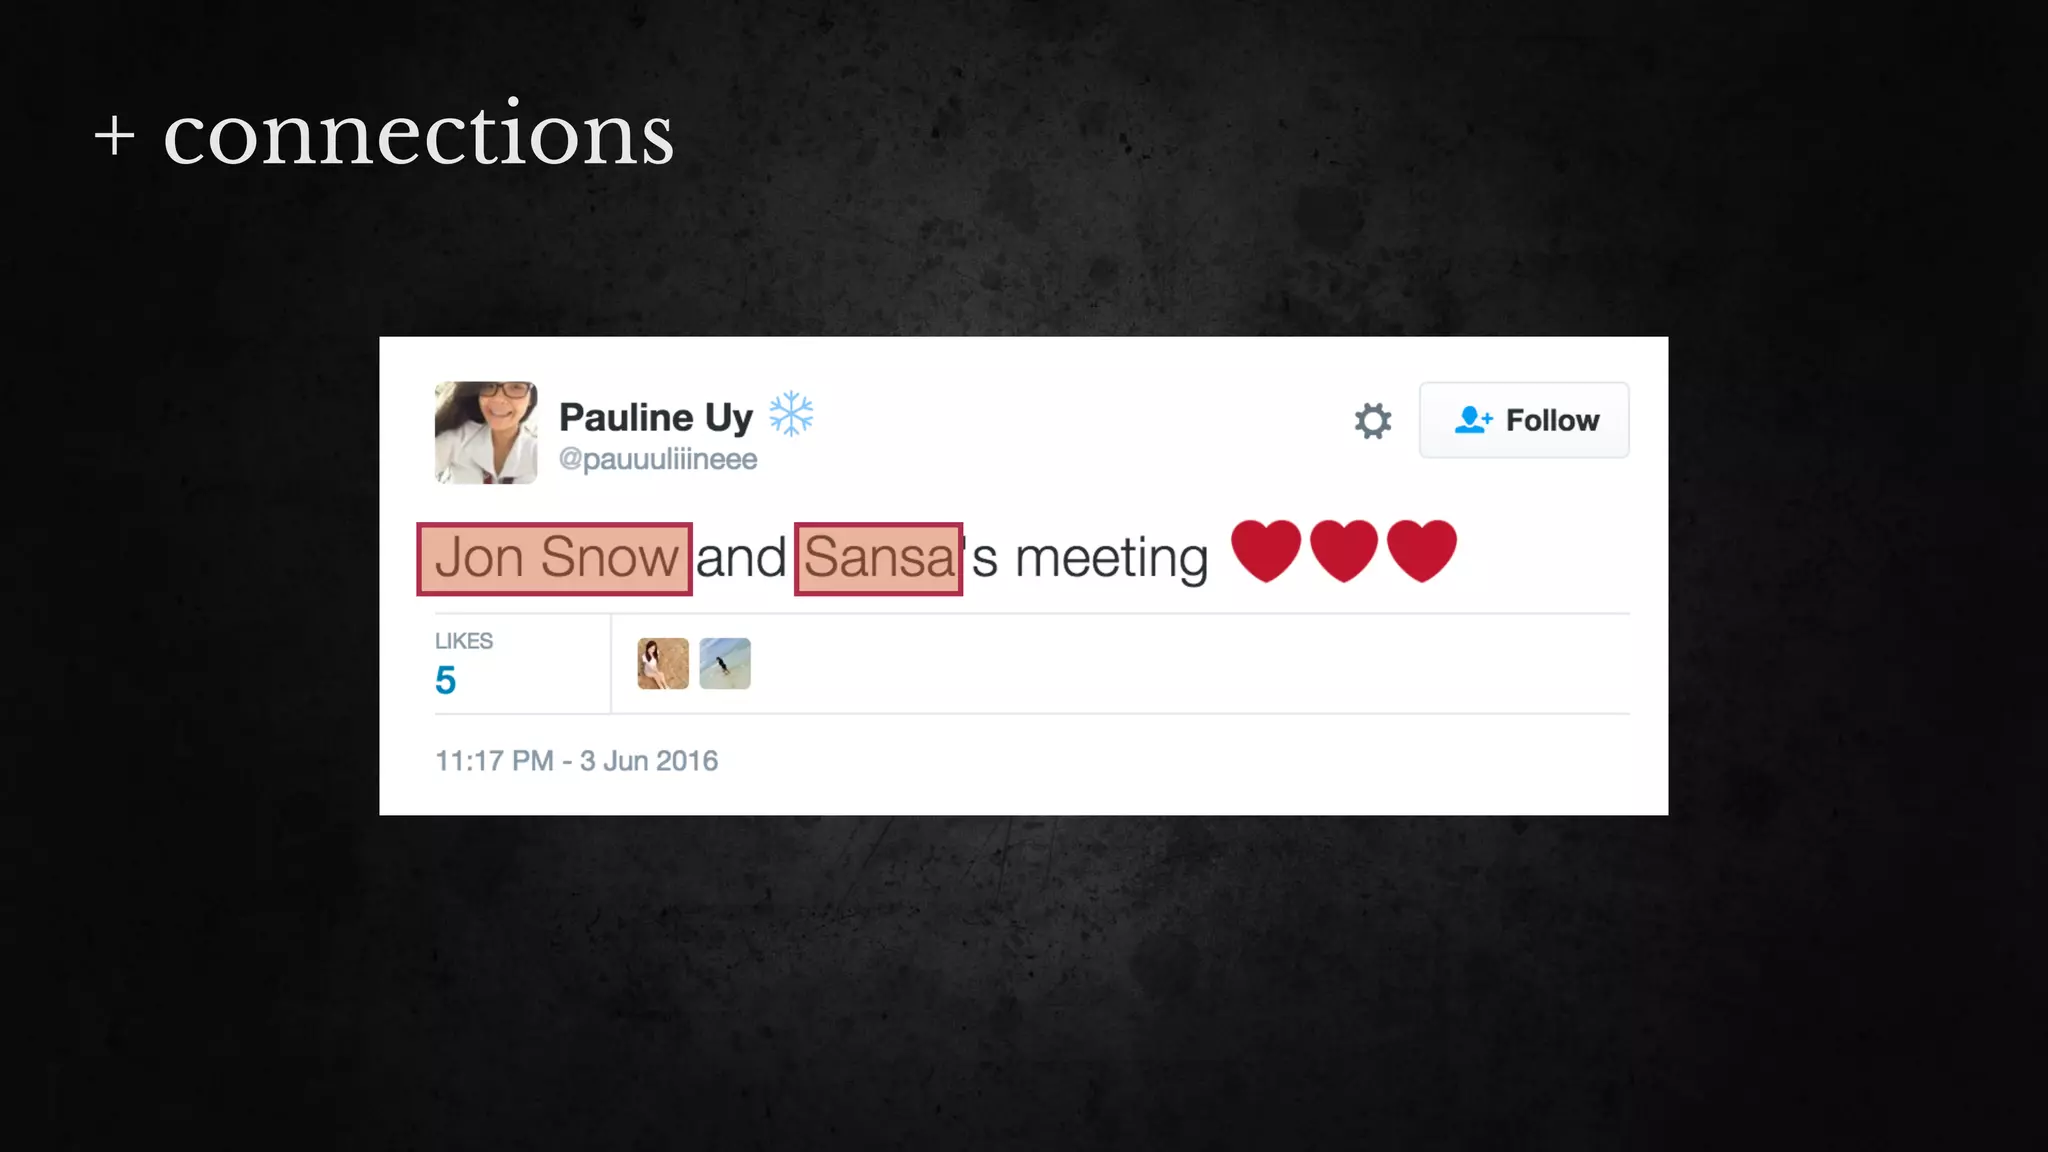
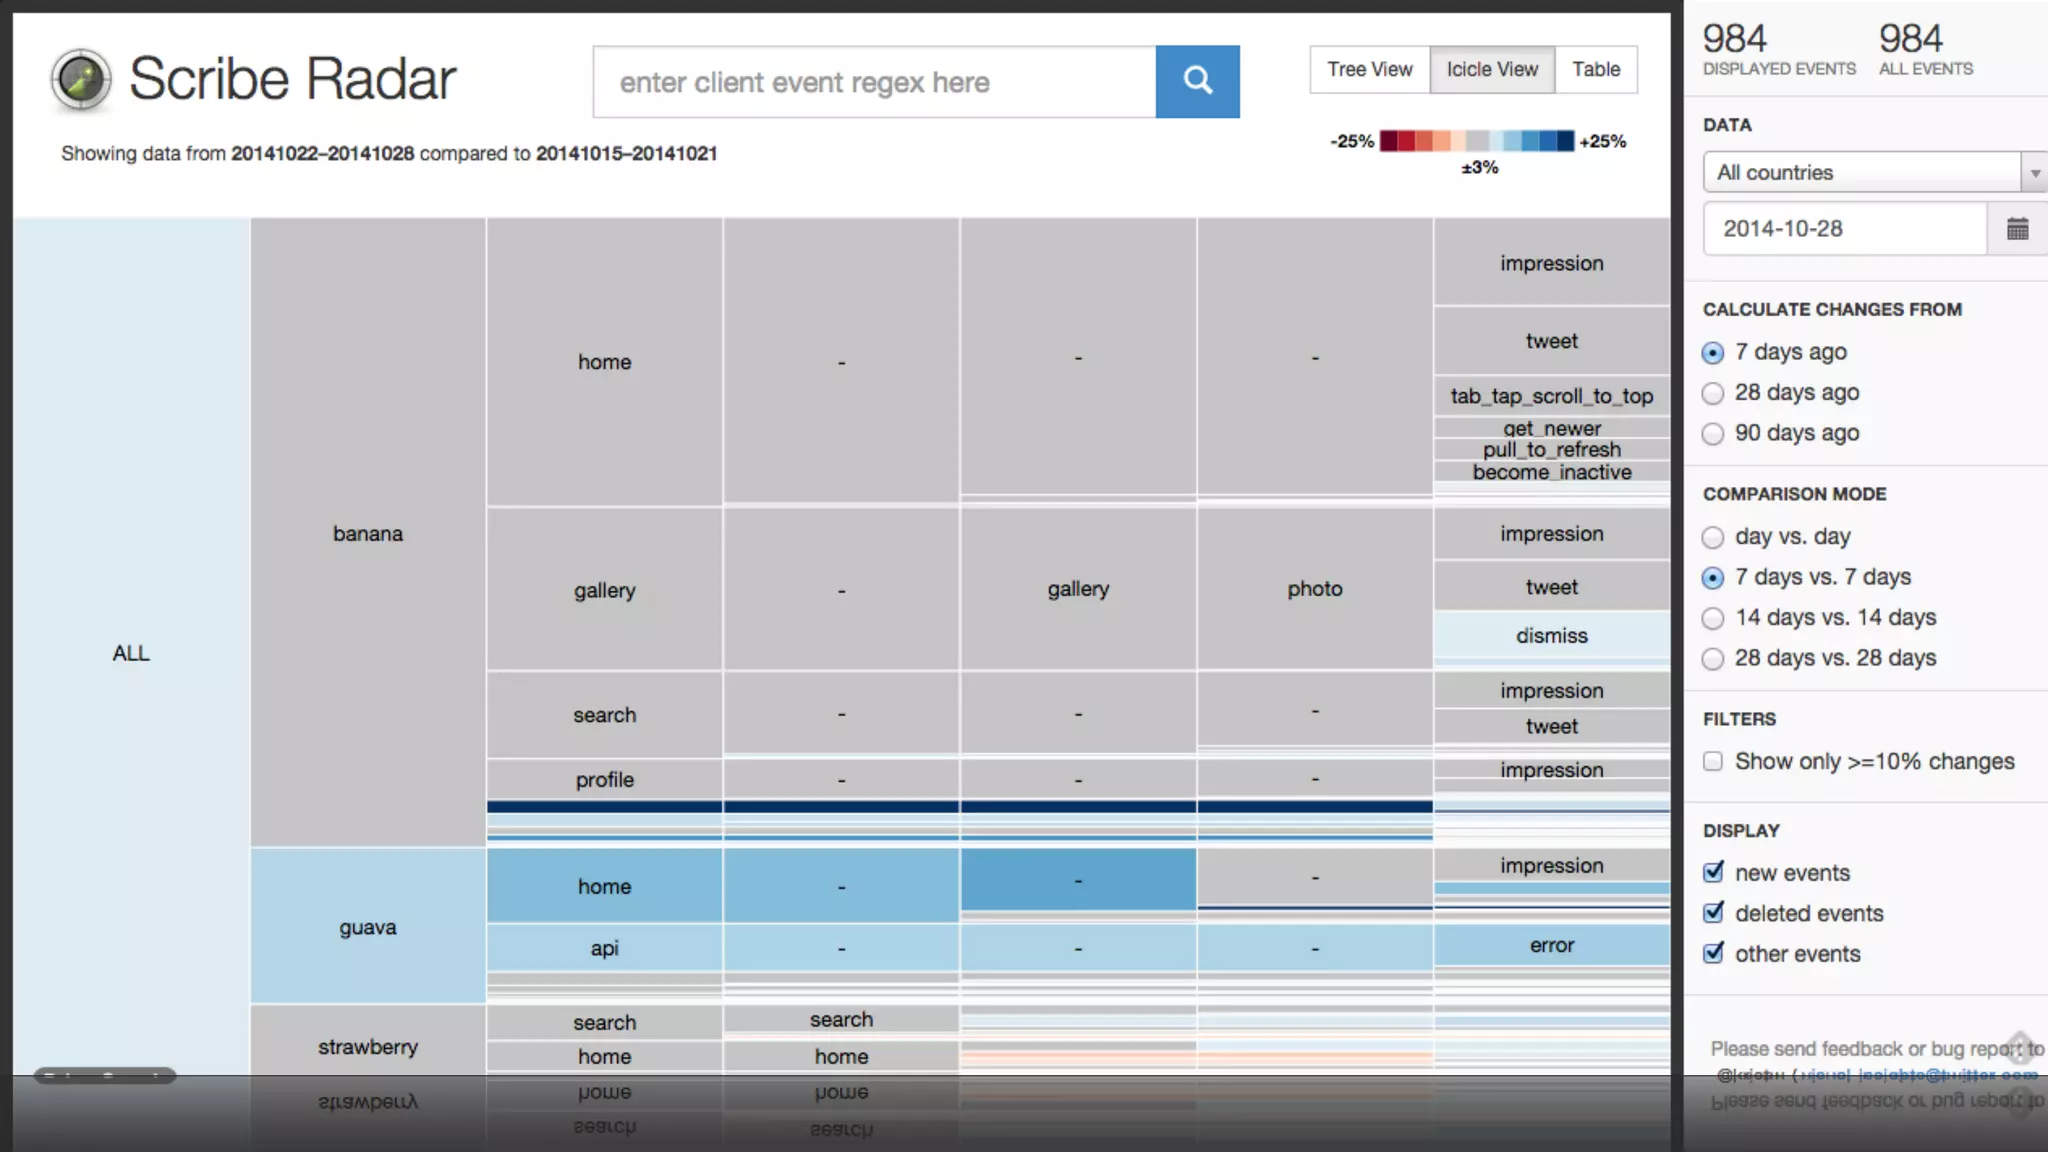
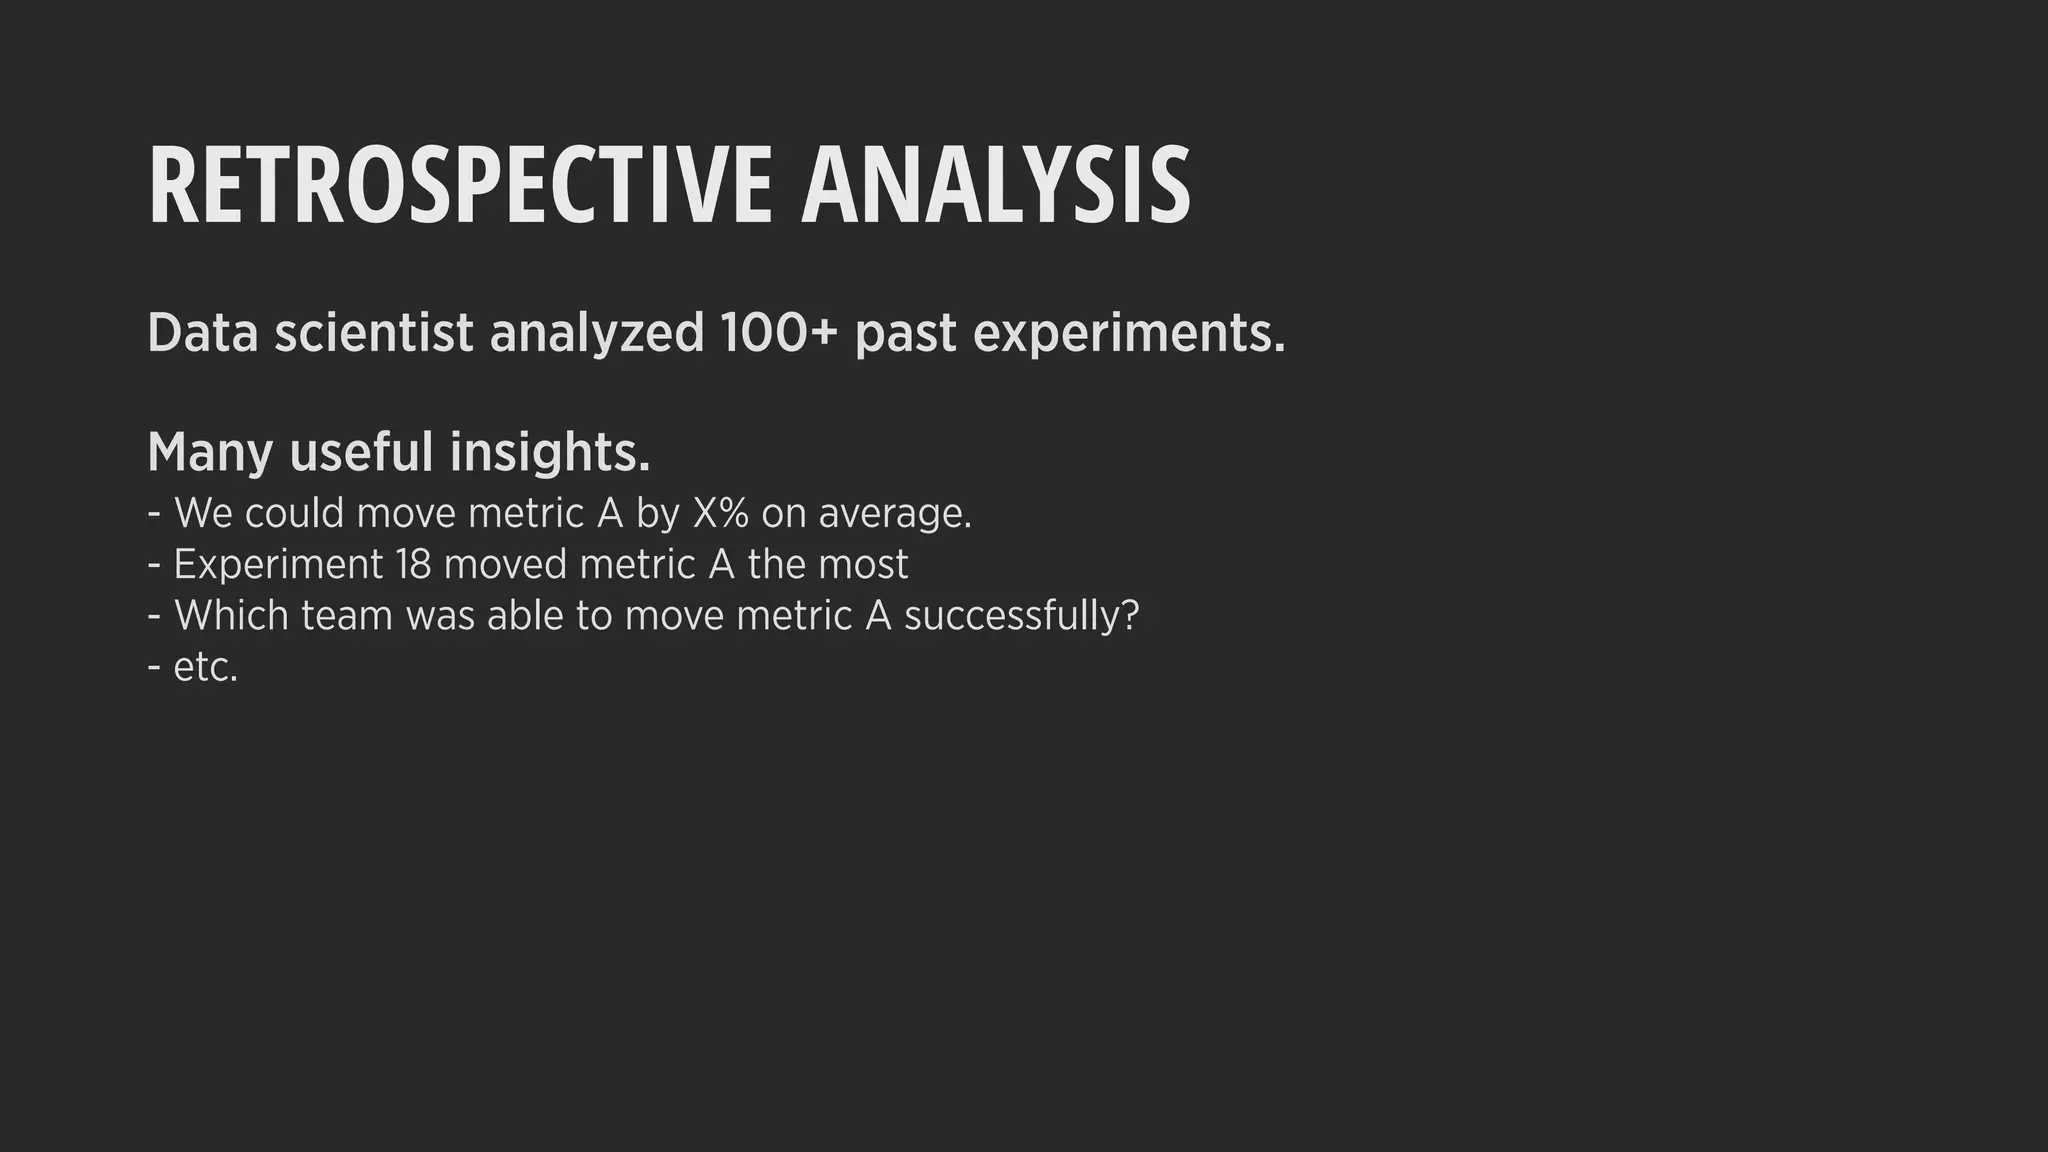
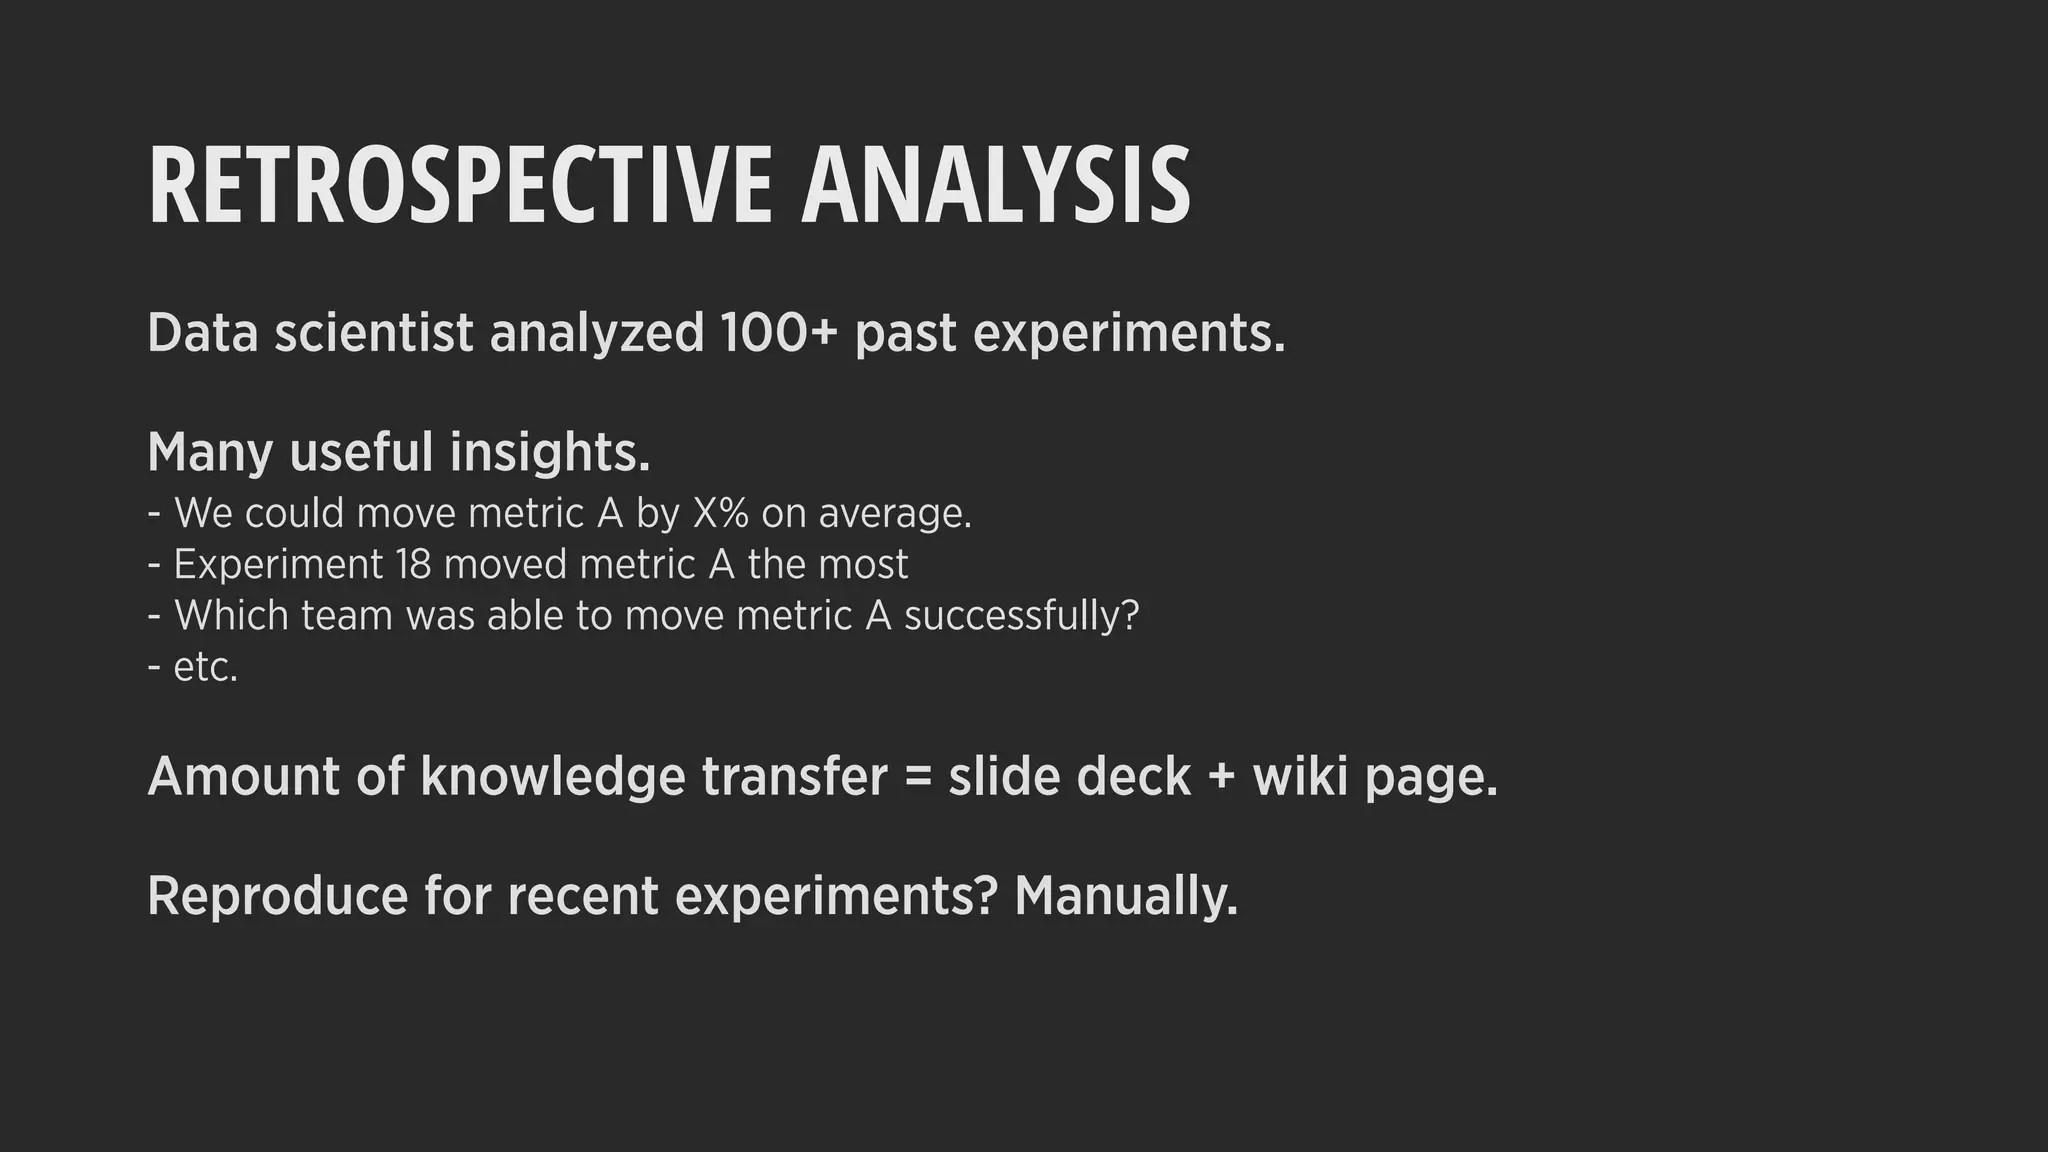
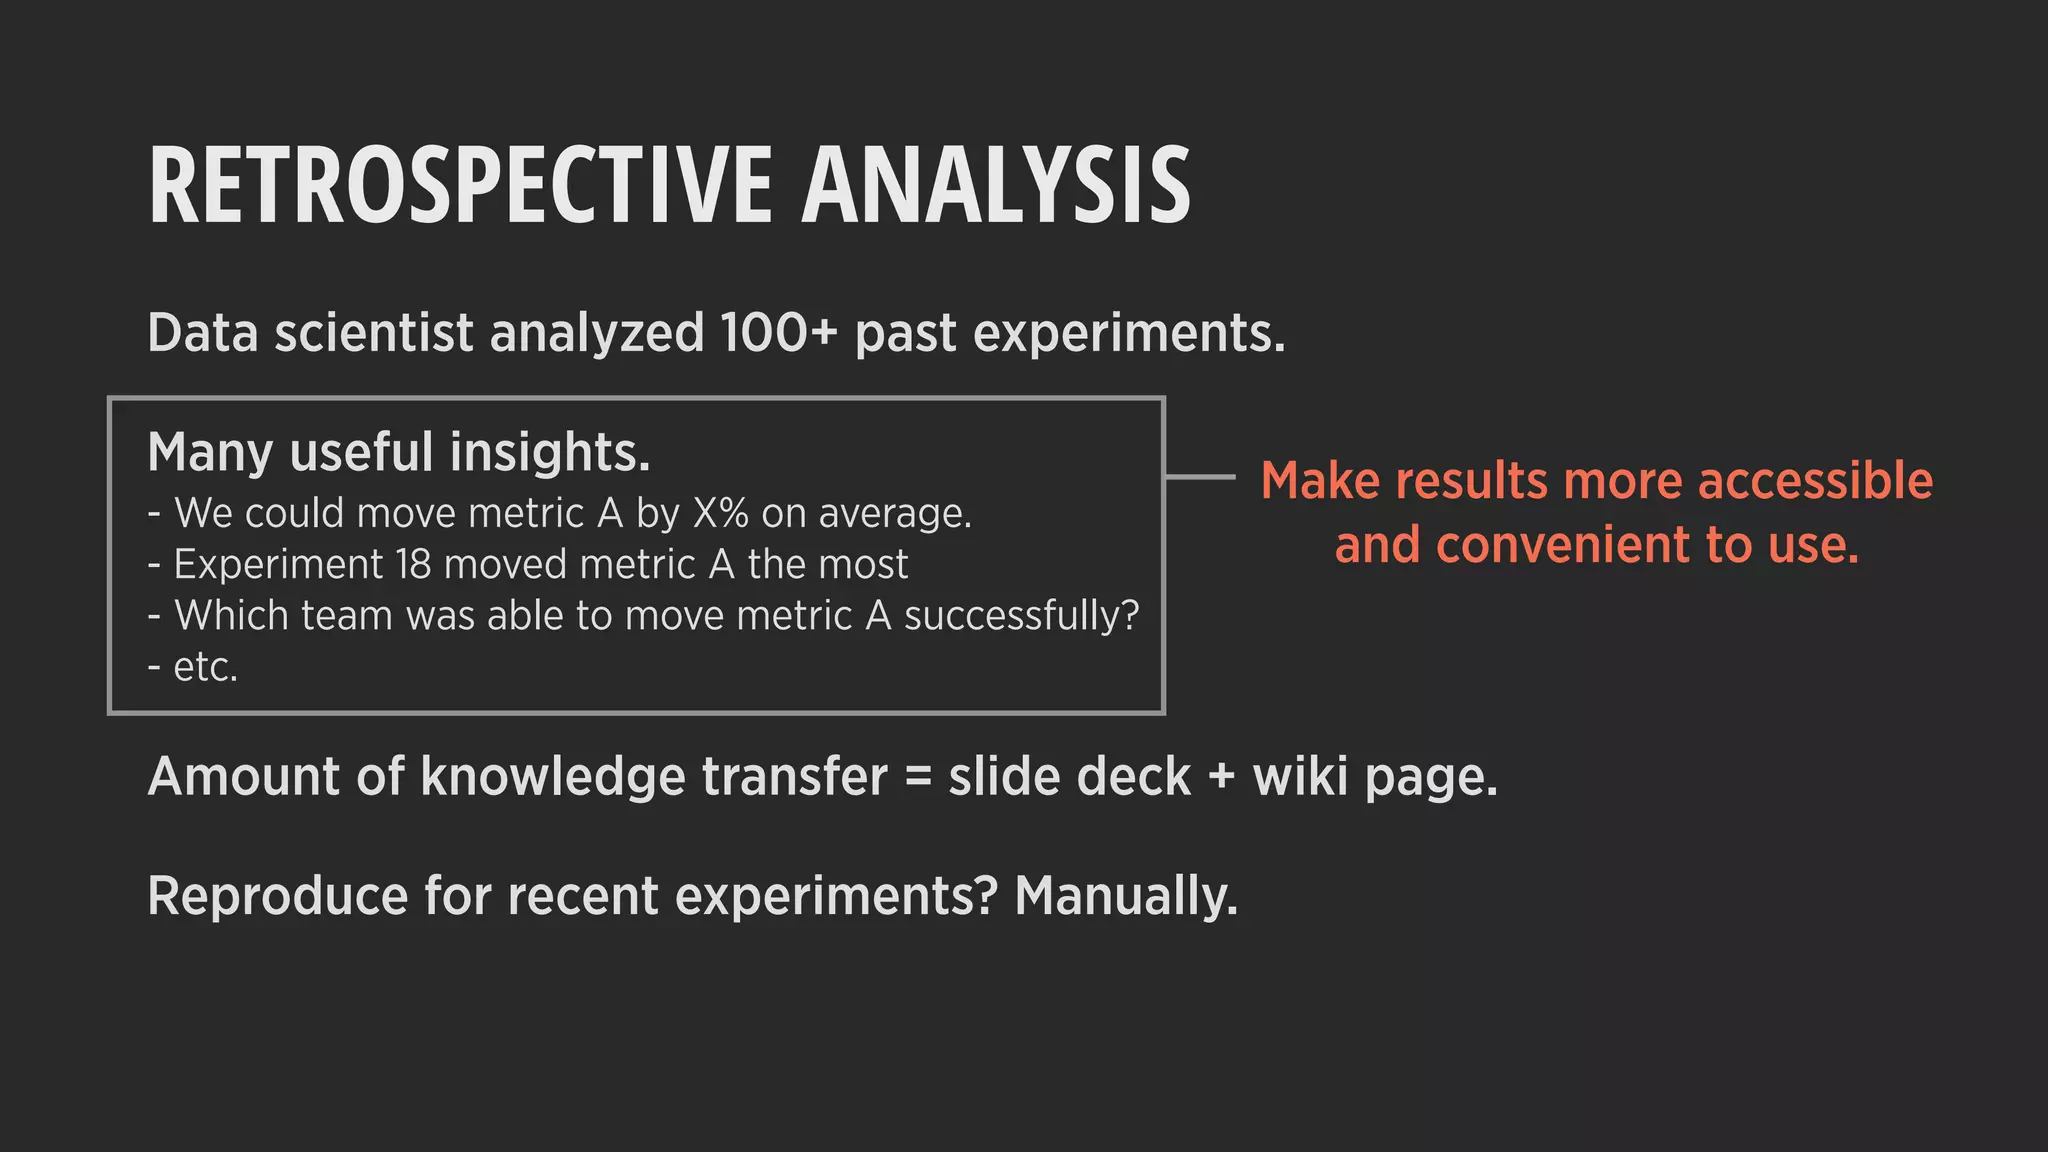
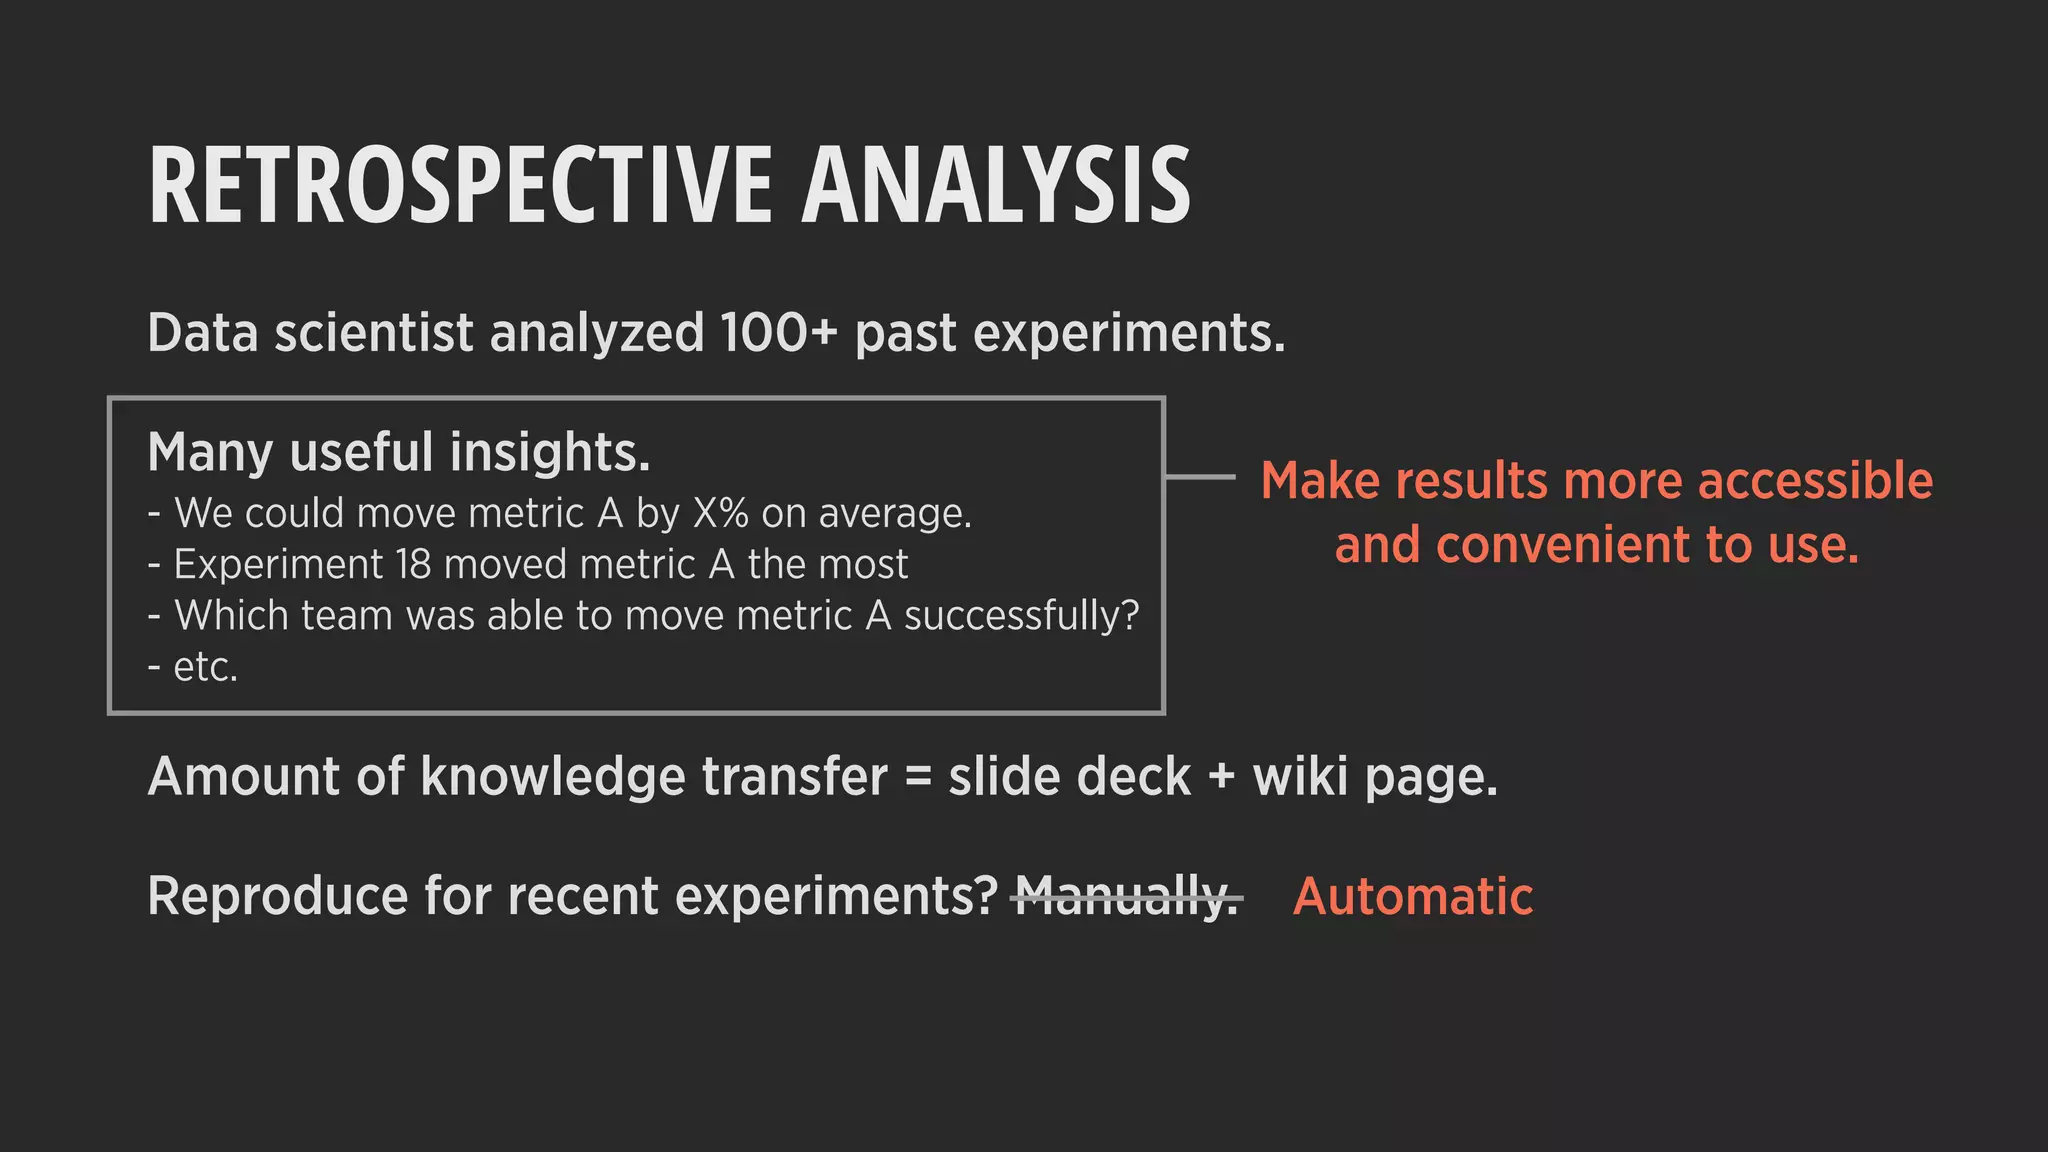
Downloaded 32 times


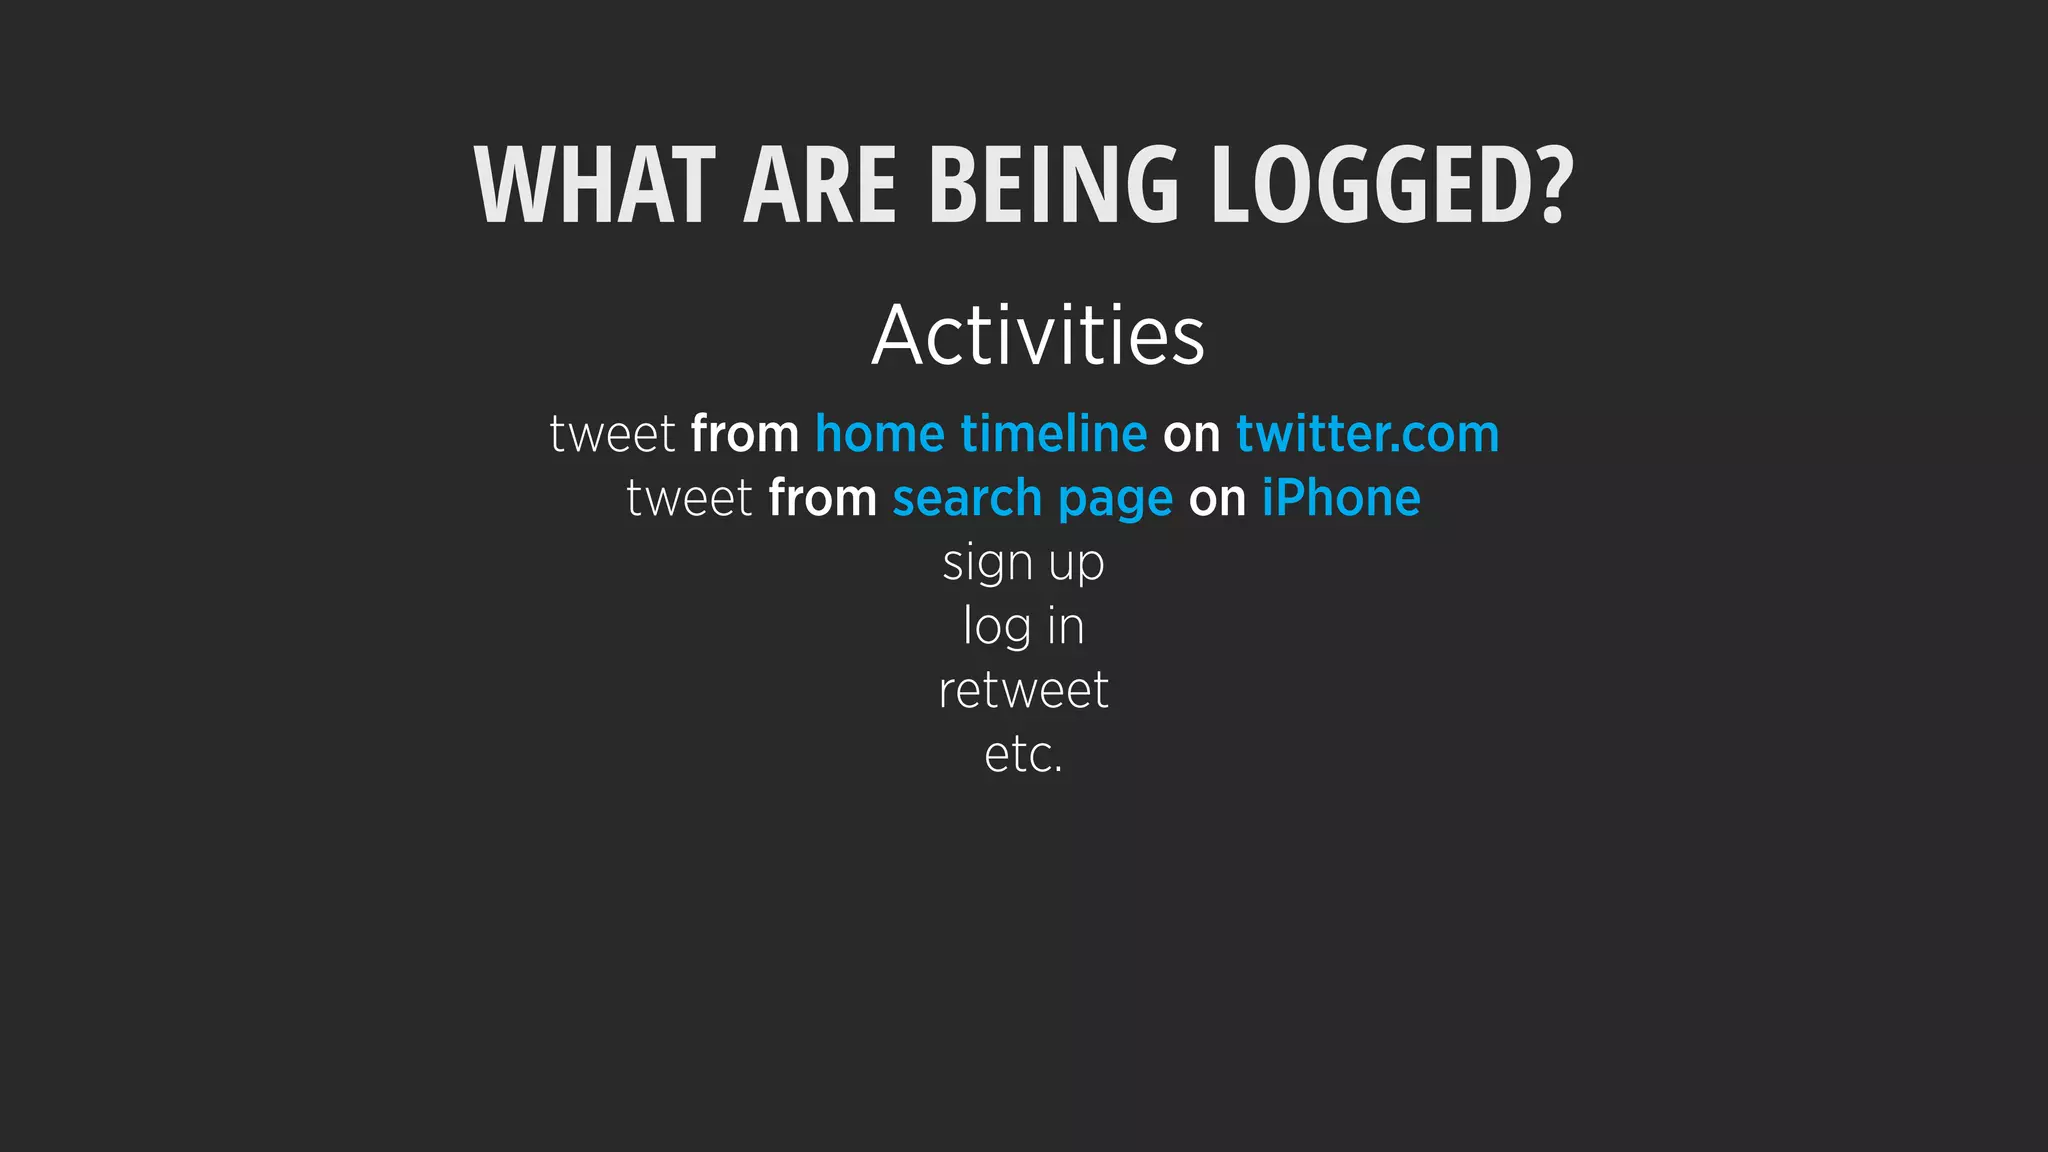

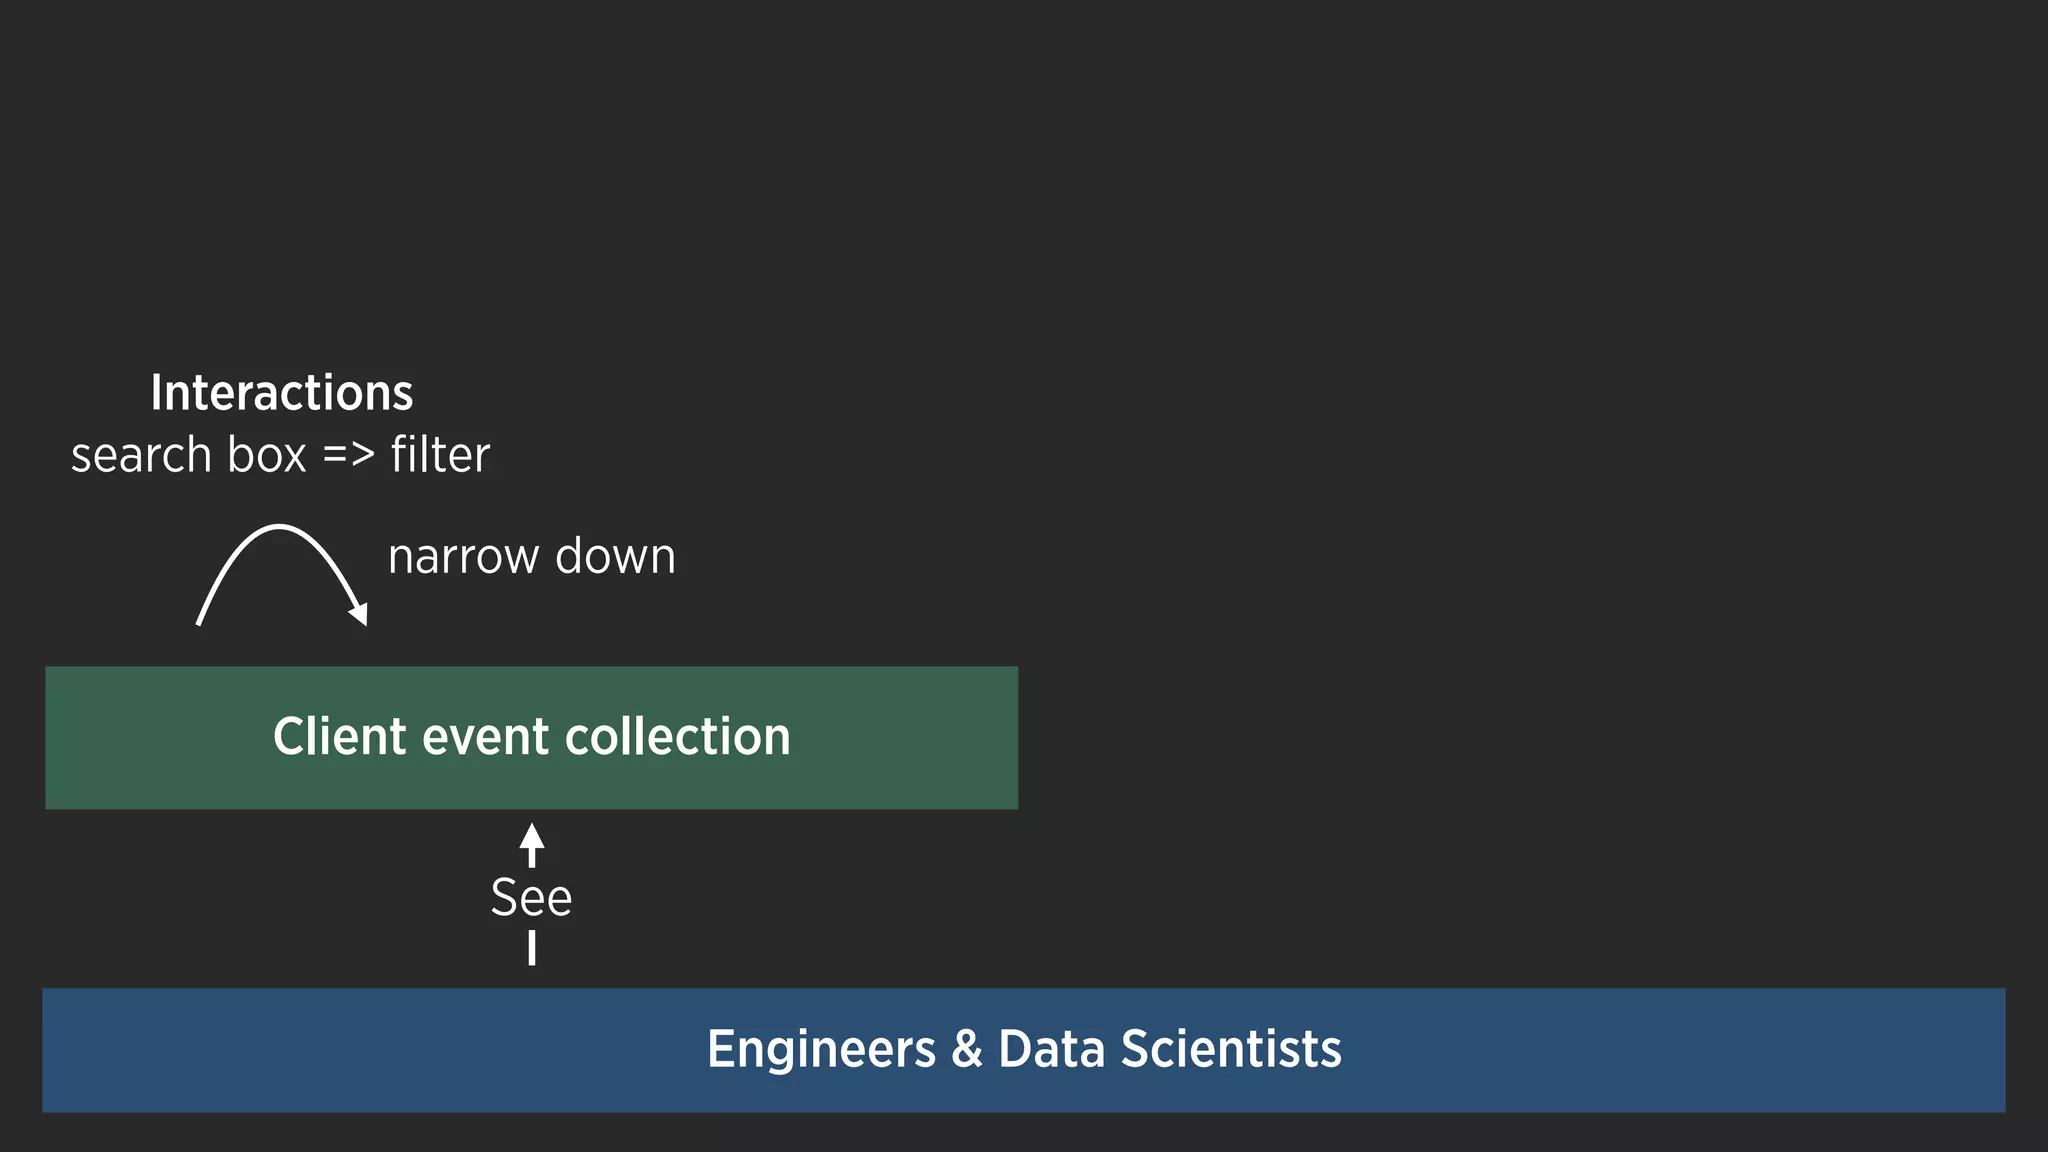
![LOG EVENT A.K.A. “CLIENT EVENT”
[Lee et al. 2012]](https://image.slidesharecdn.com/6thingstoexpectwhenyouarevisualizingshared-170228063140/75/6-things-to-expect-when-you-are-visualizing-147-2048.jpg)
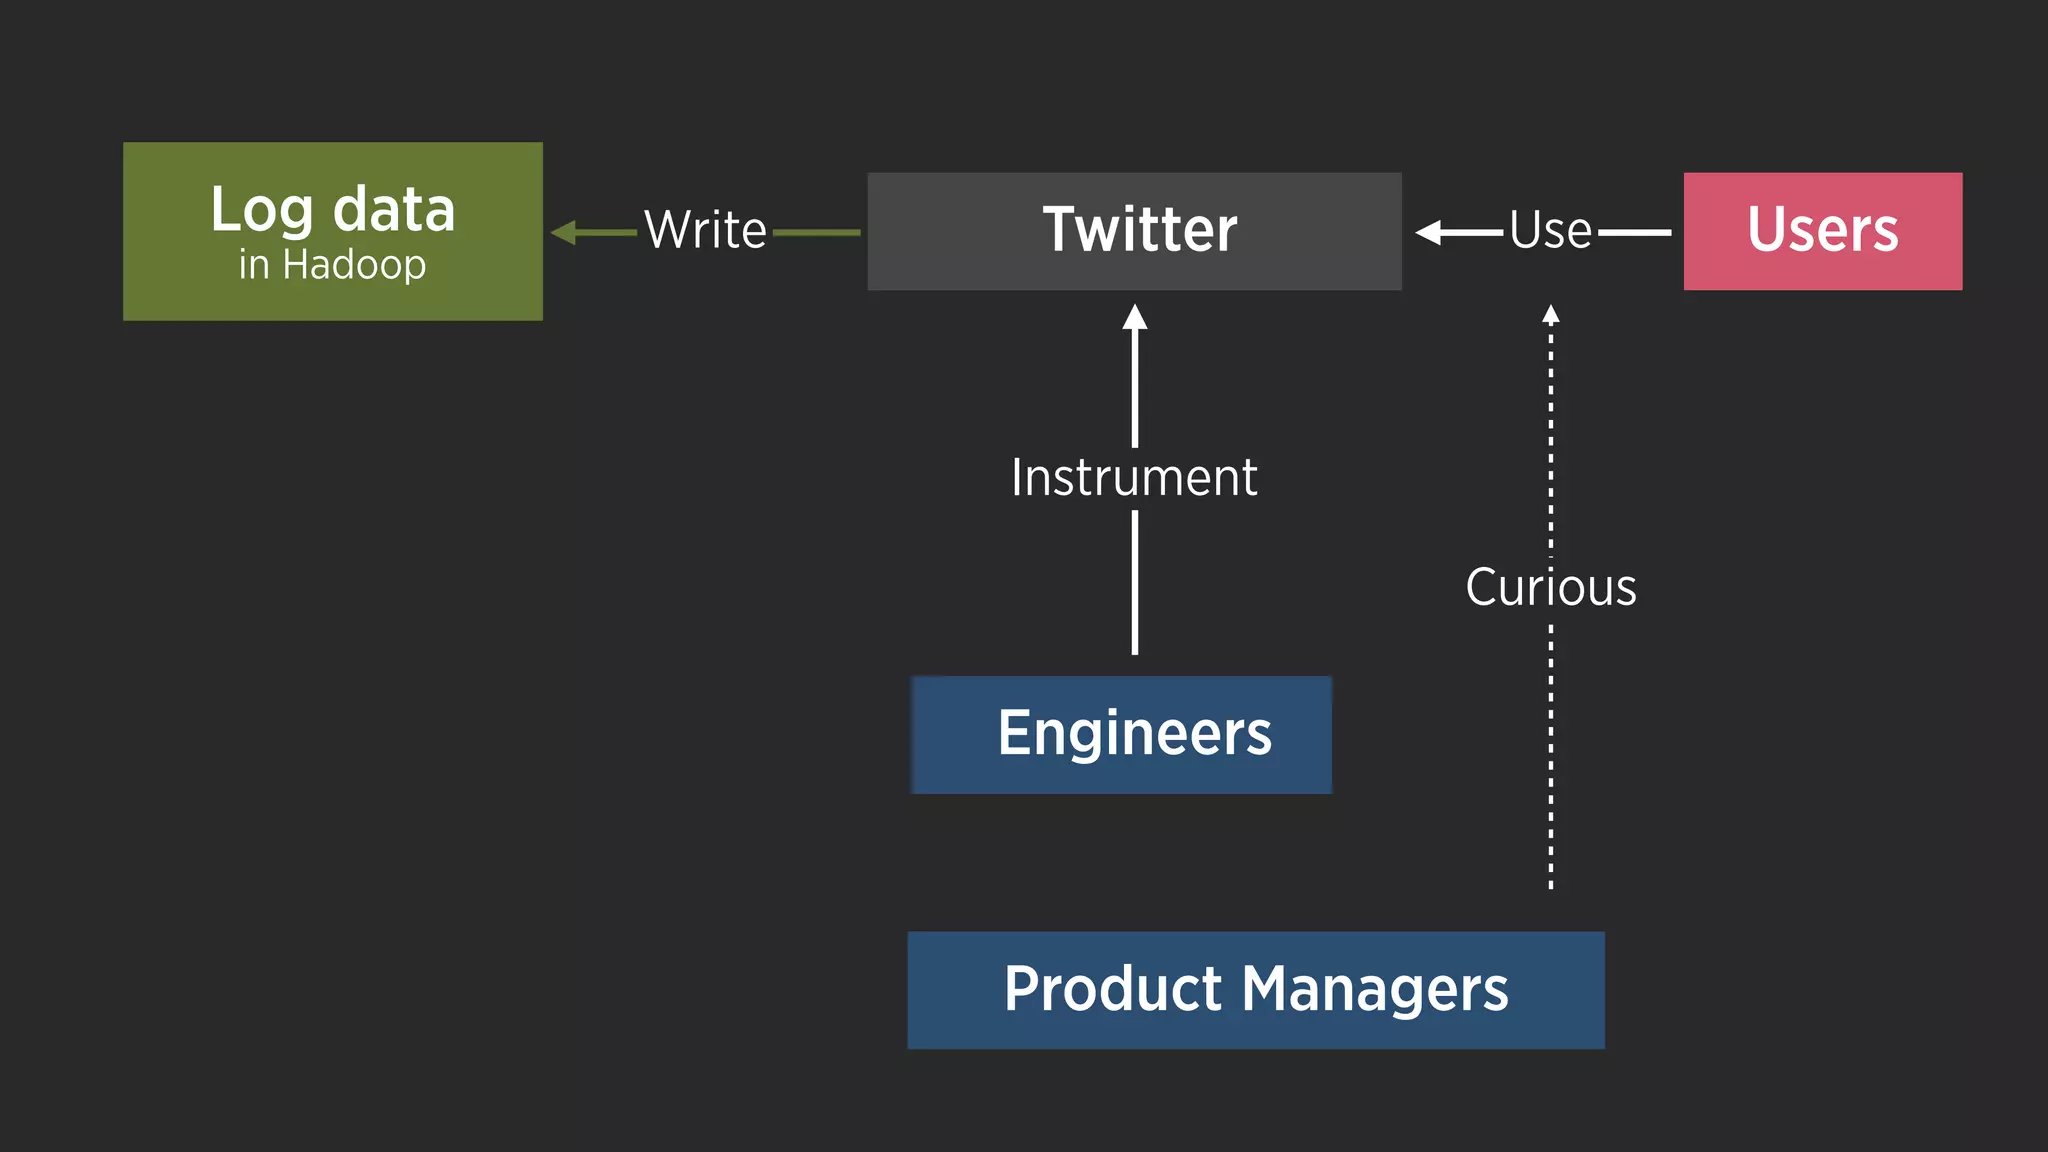
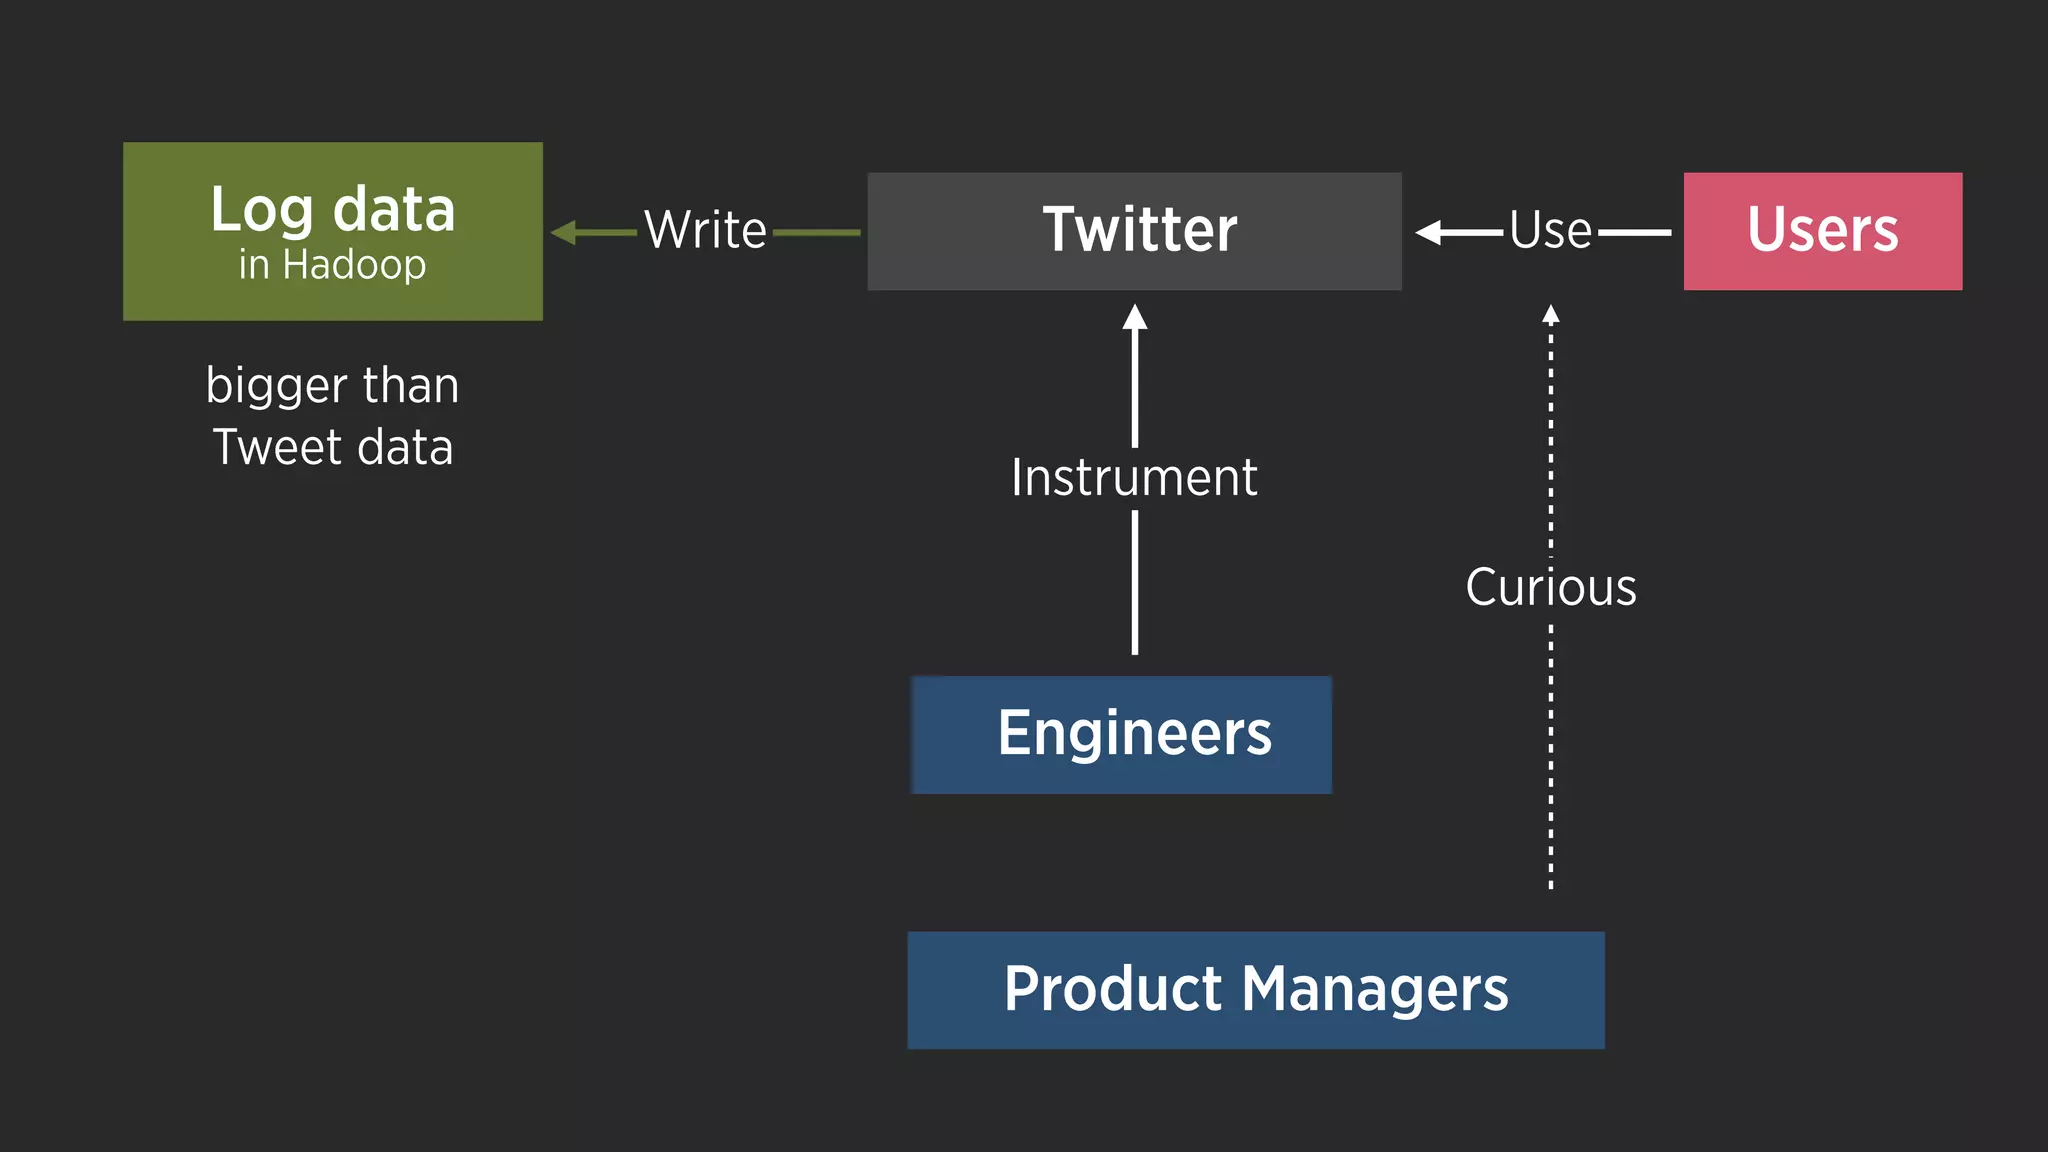
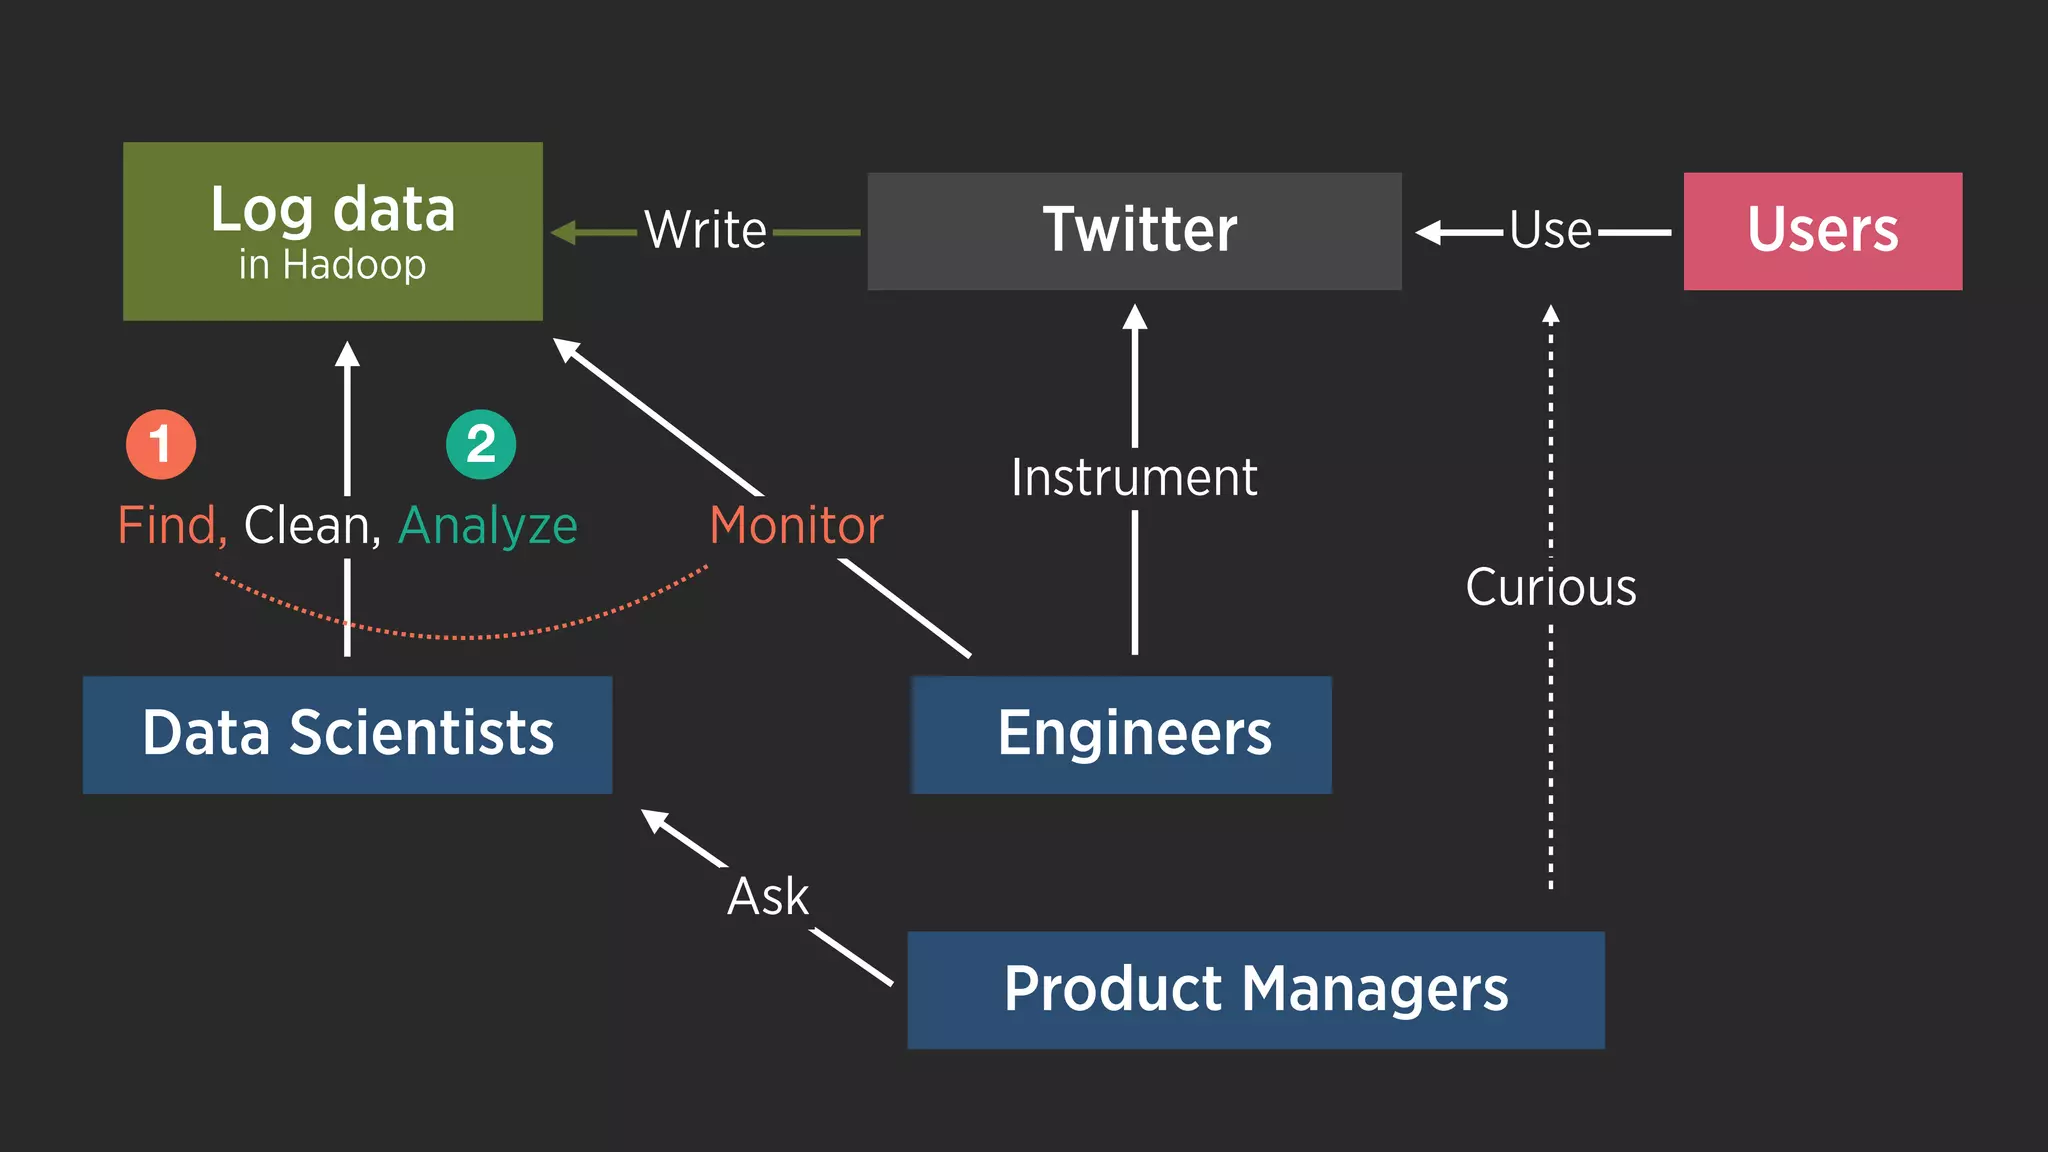
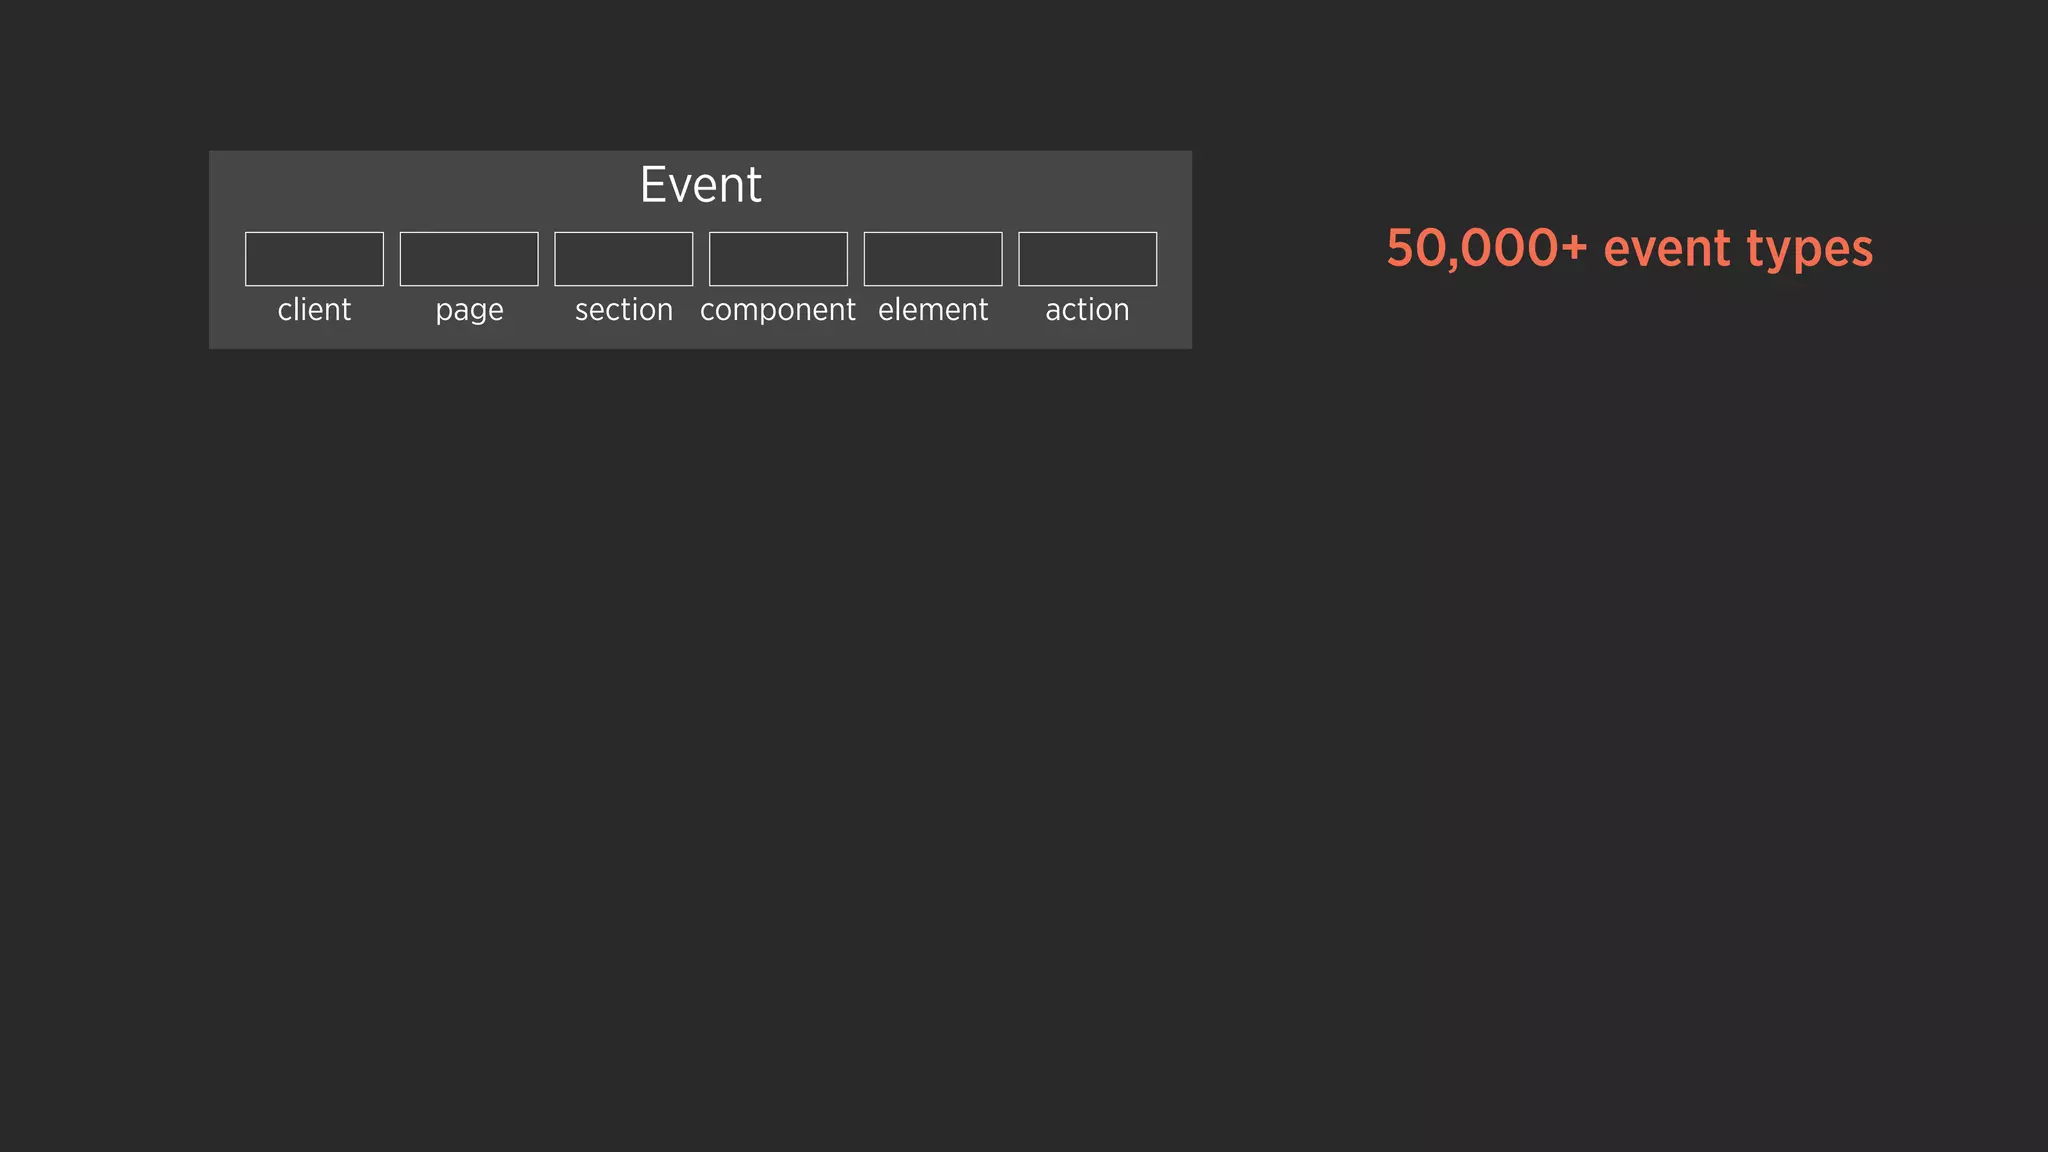
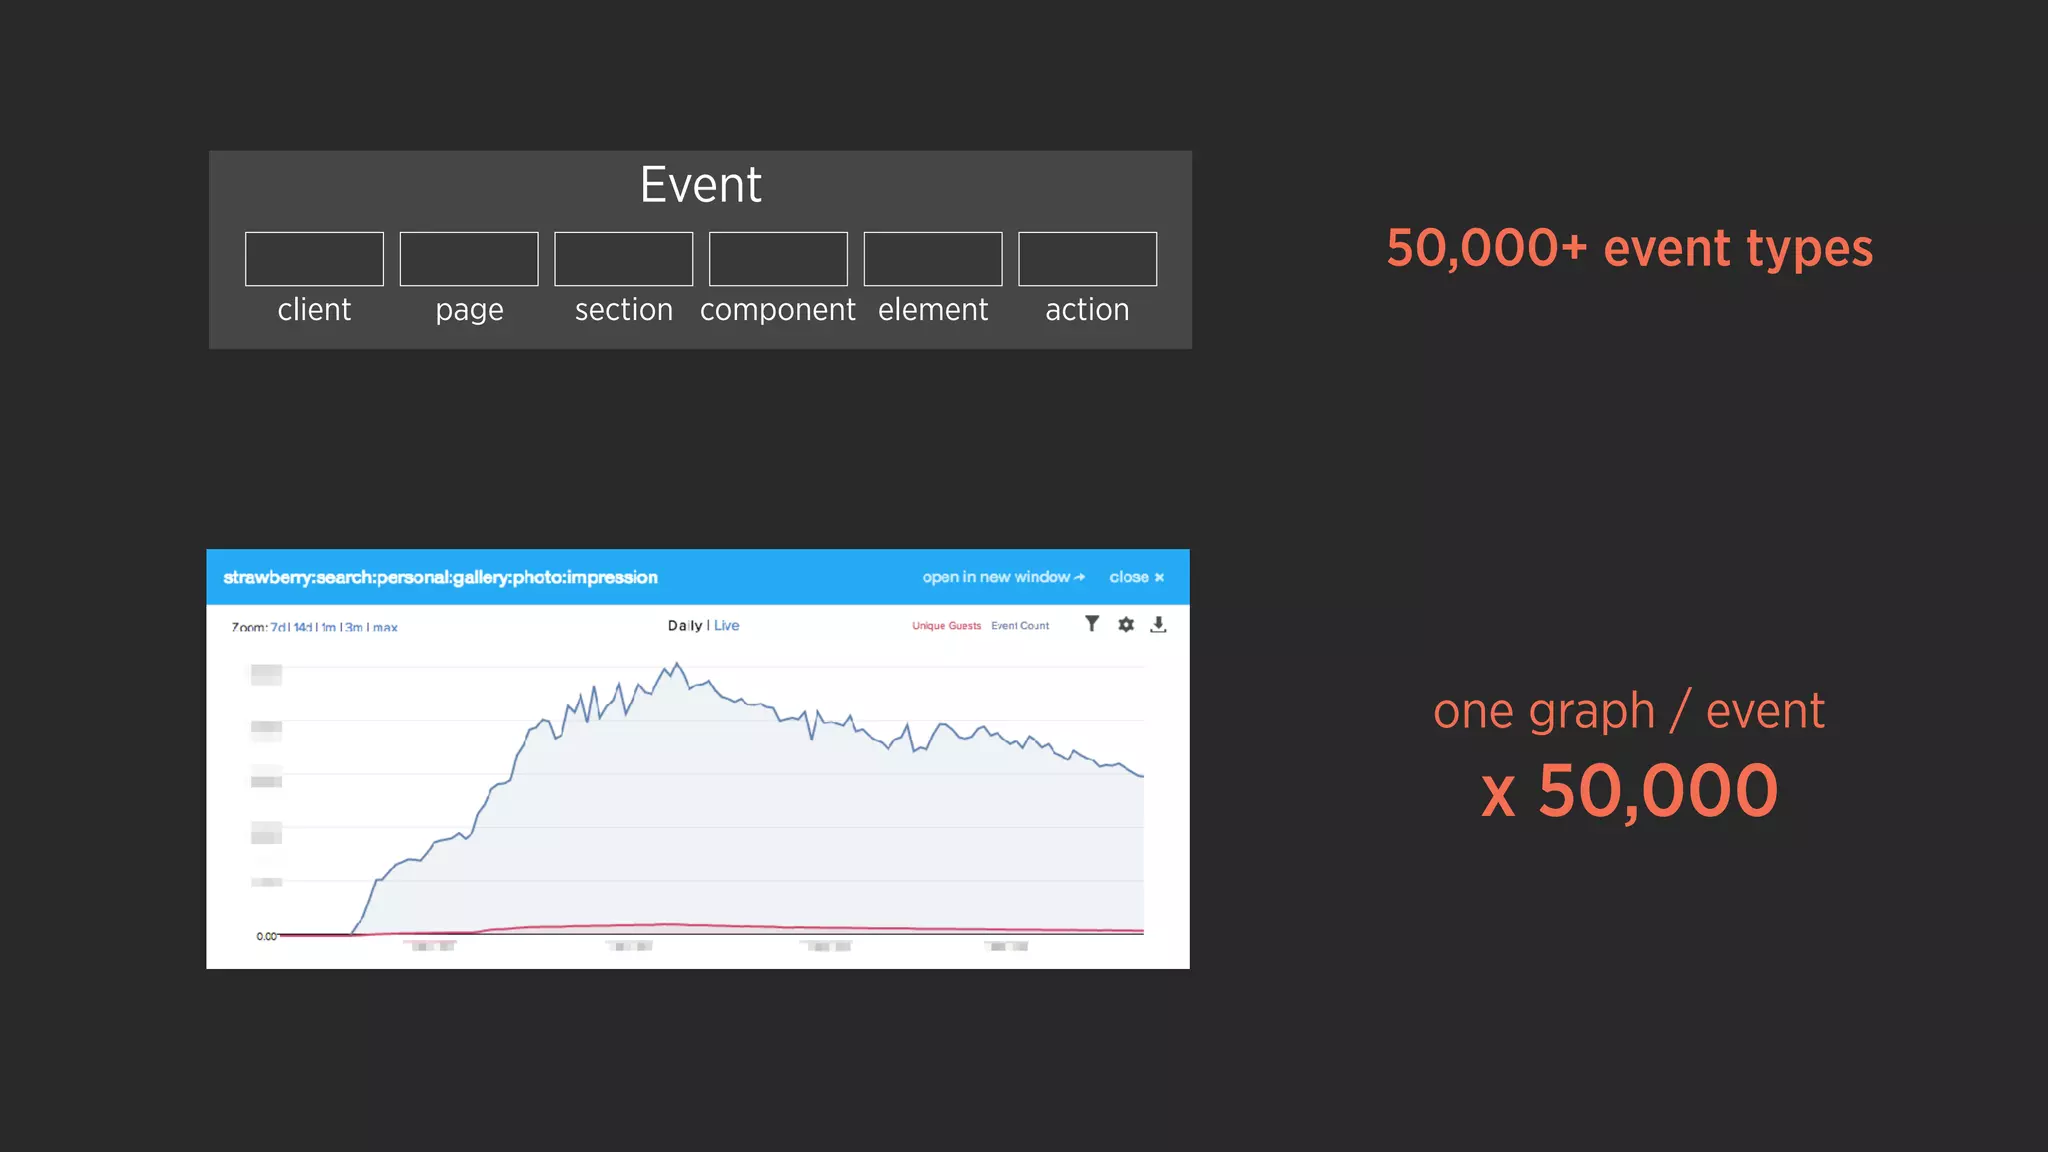
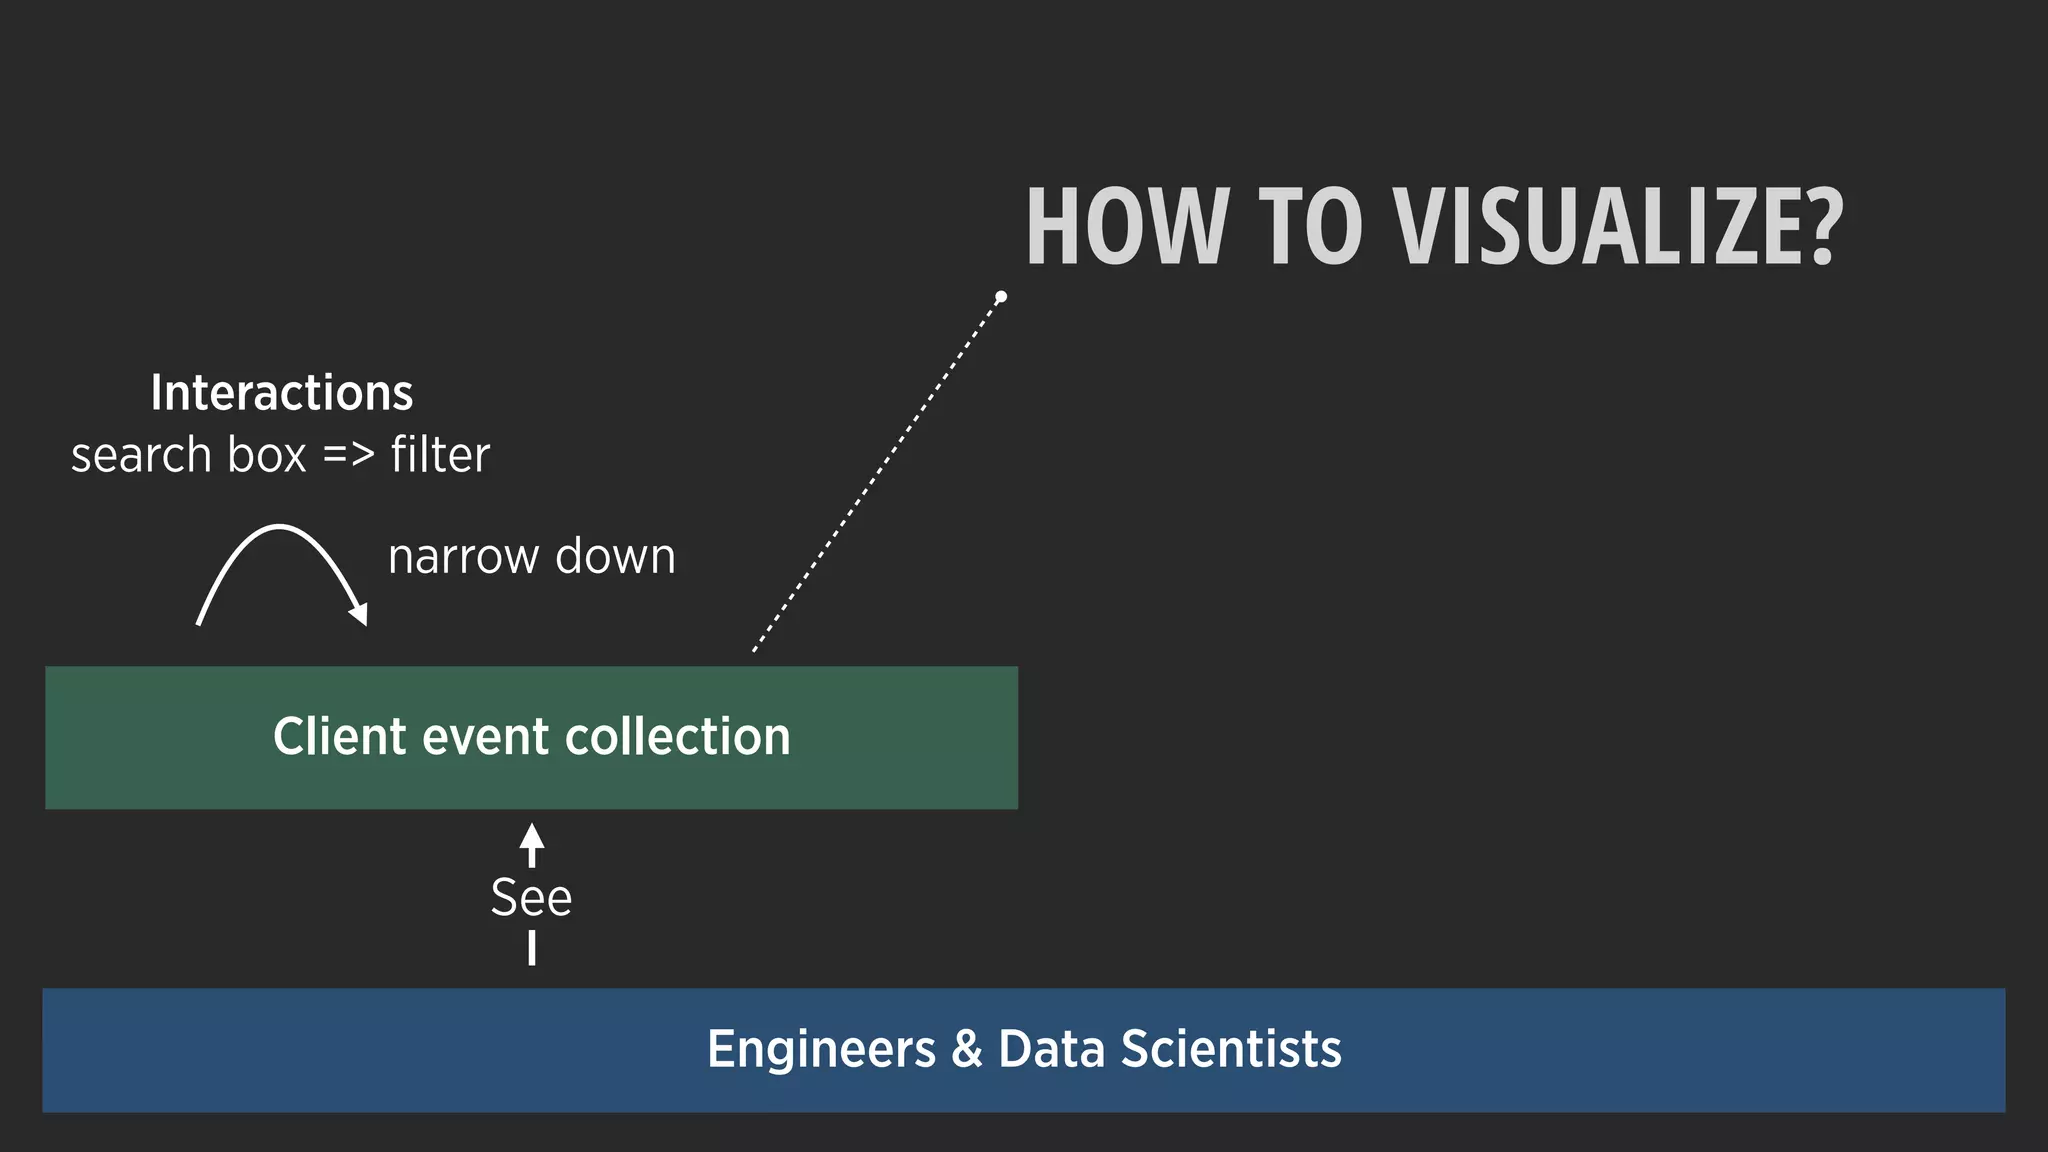
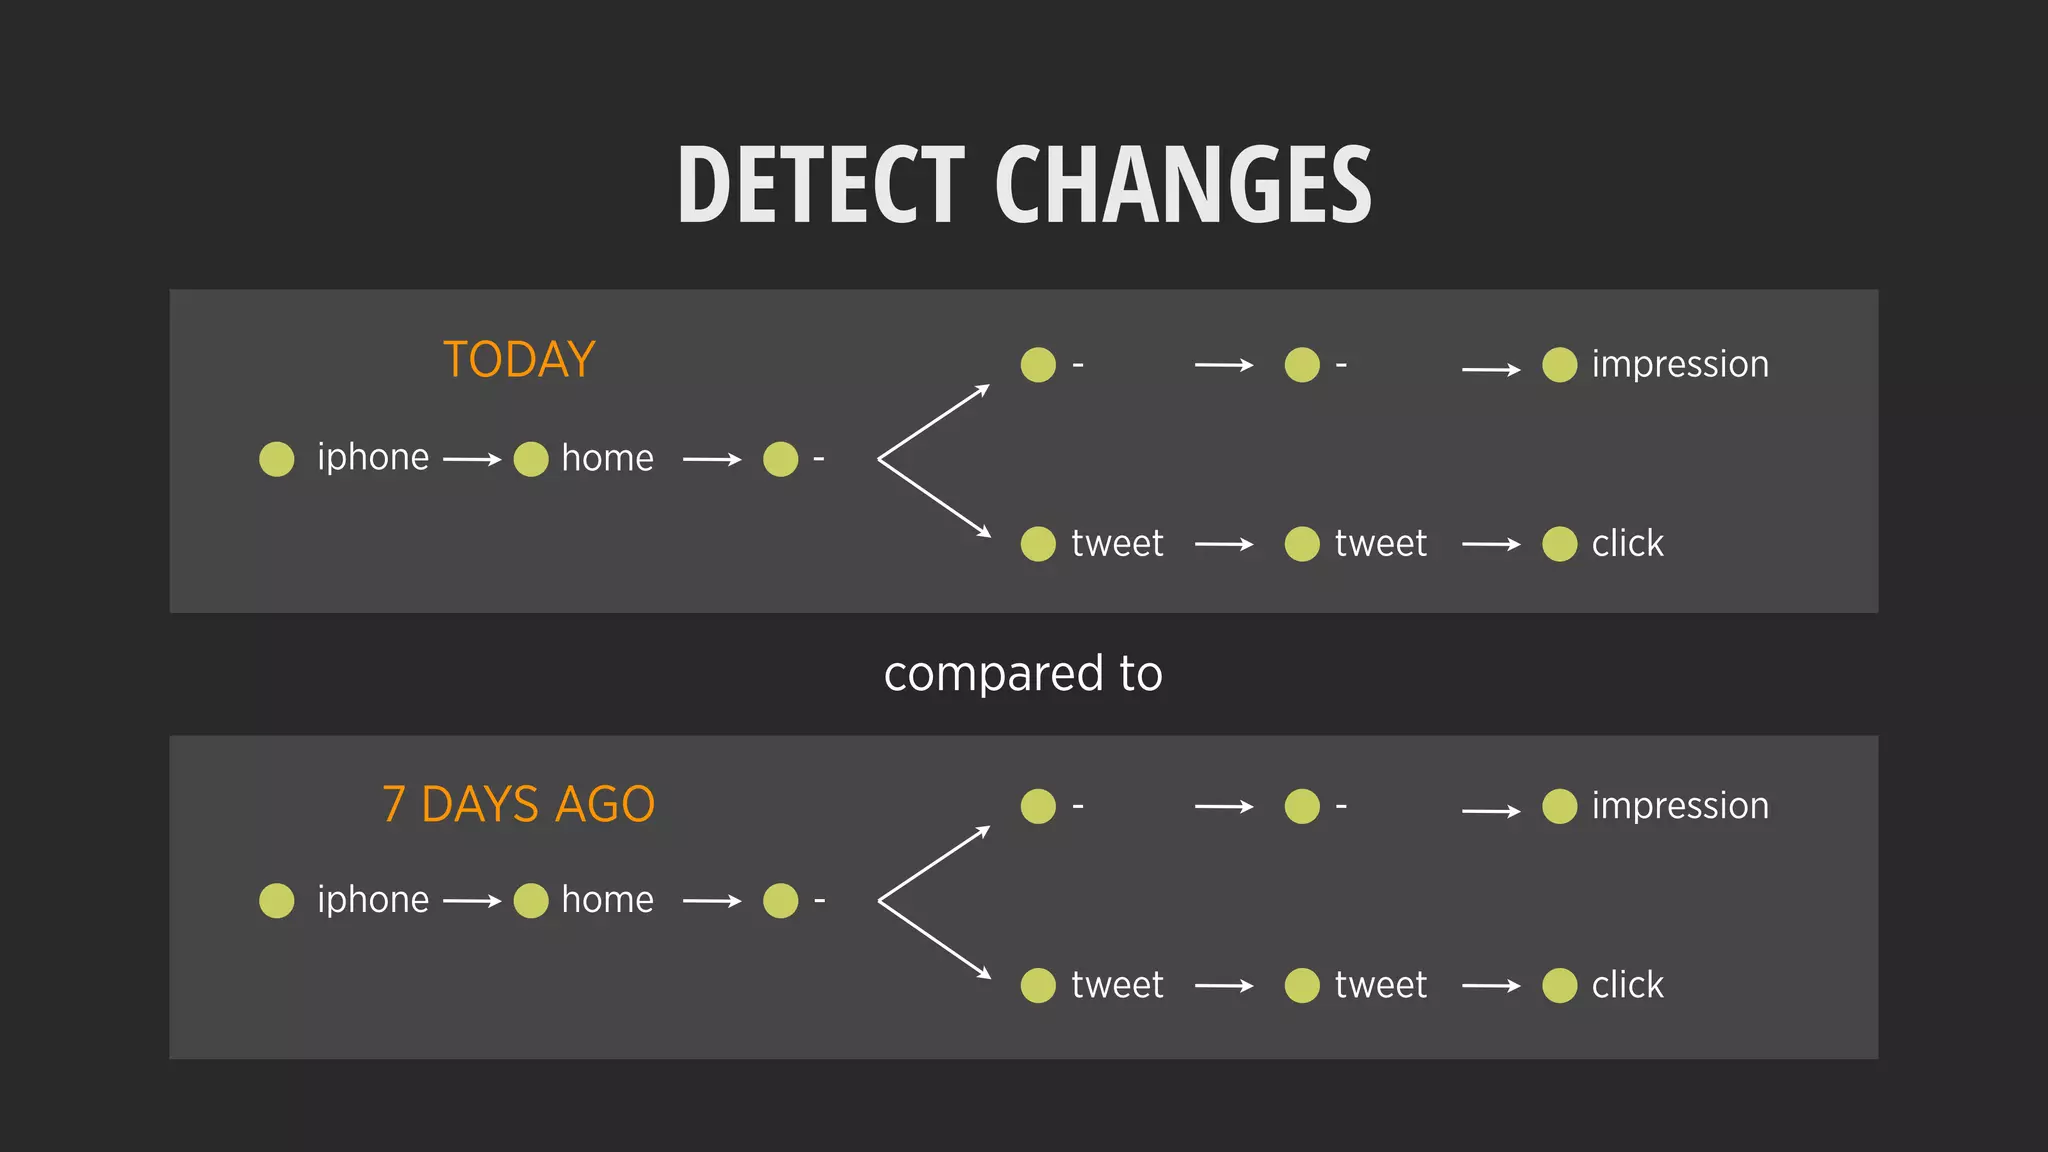
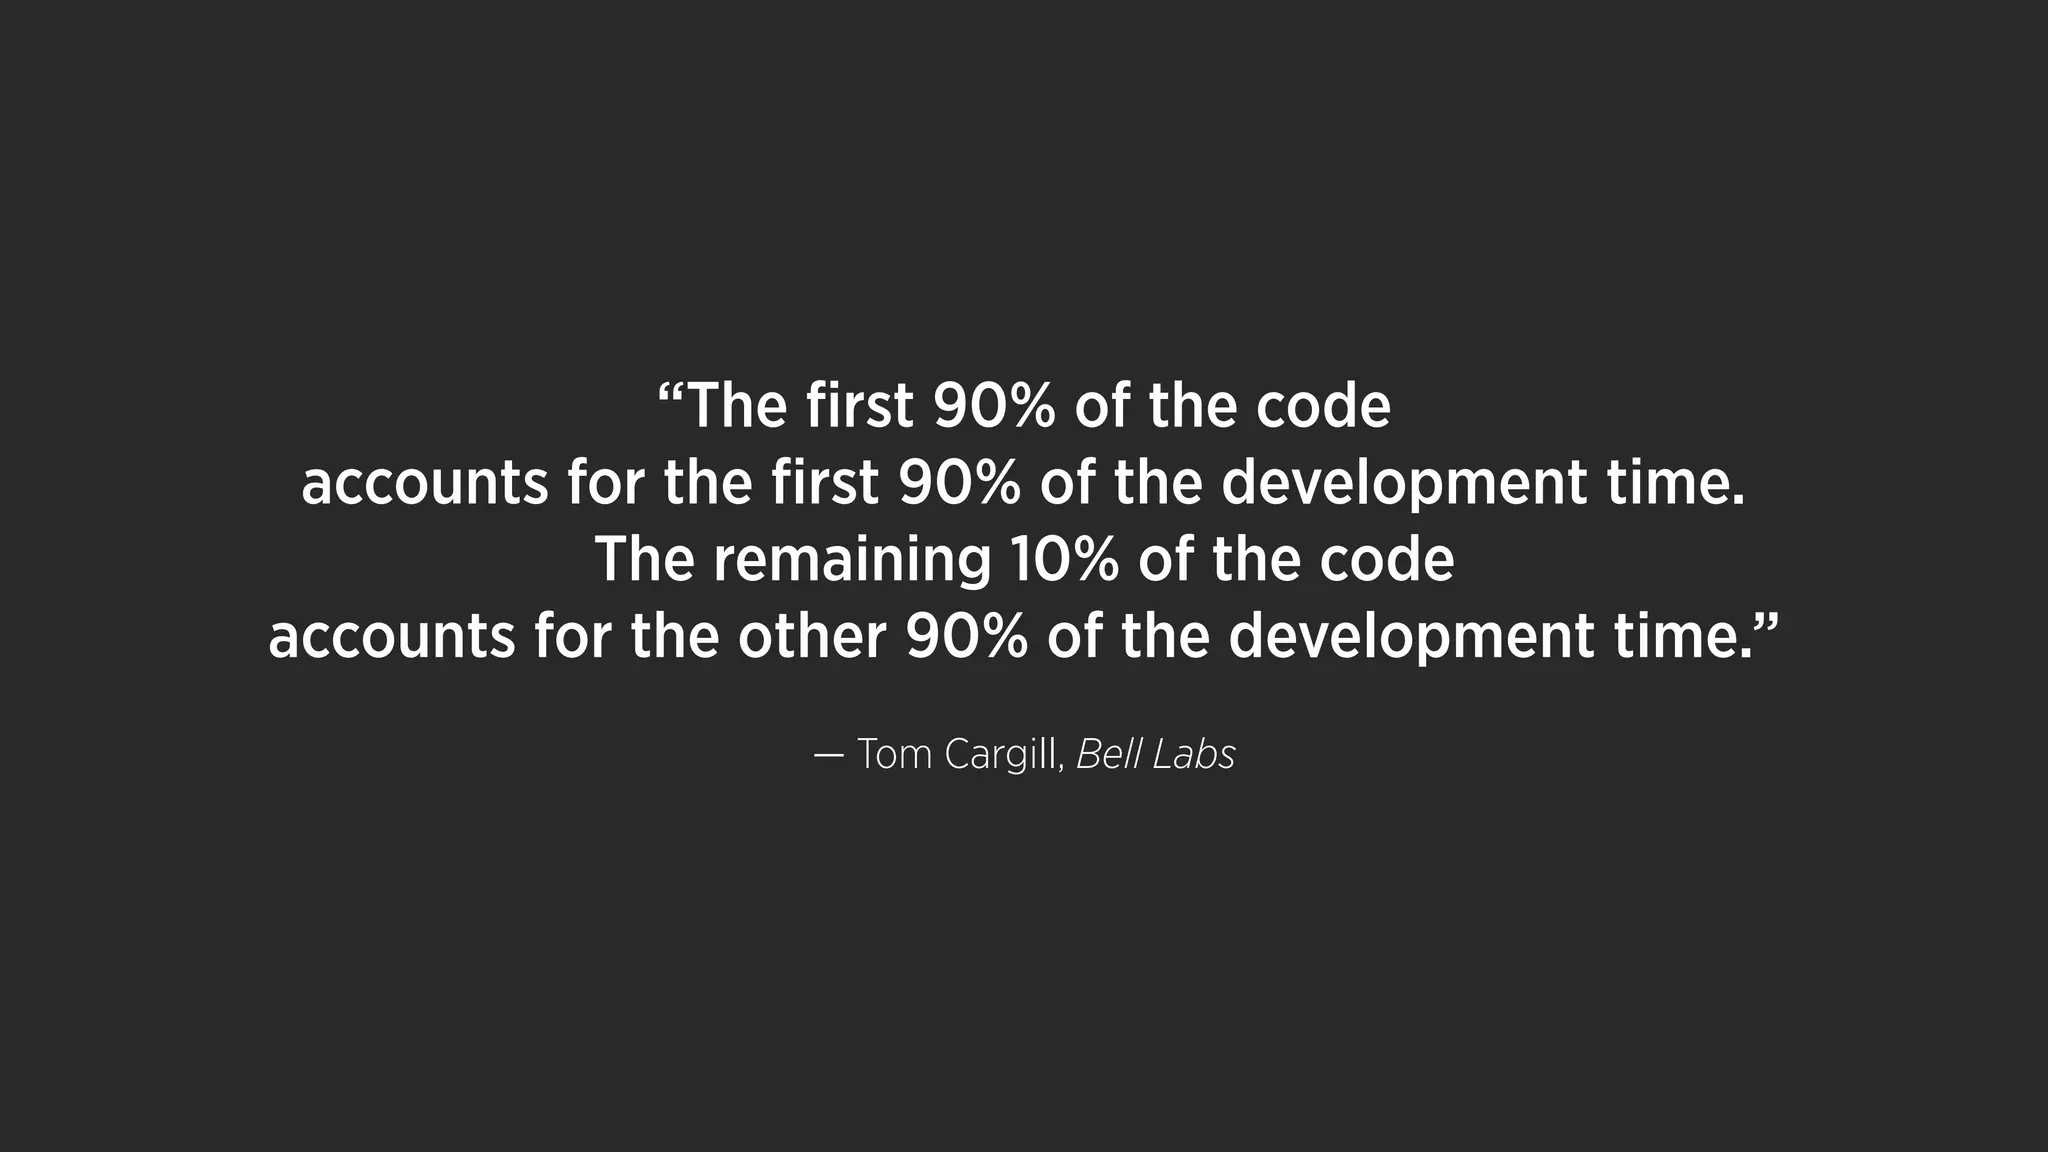
![LOG EVENT A.K.A. “CLIENT EVENT”
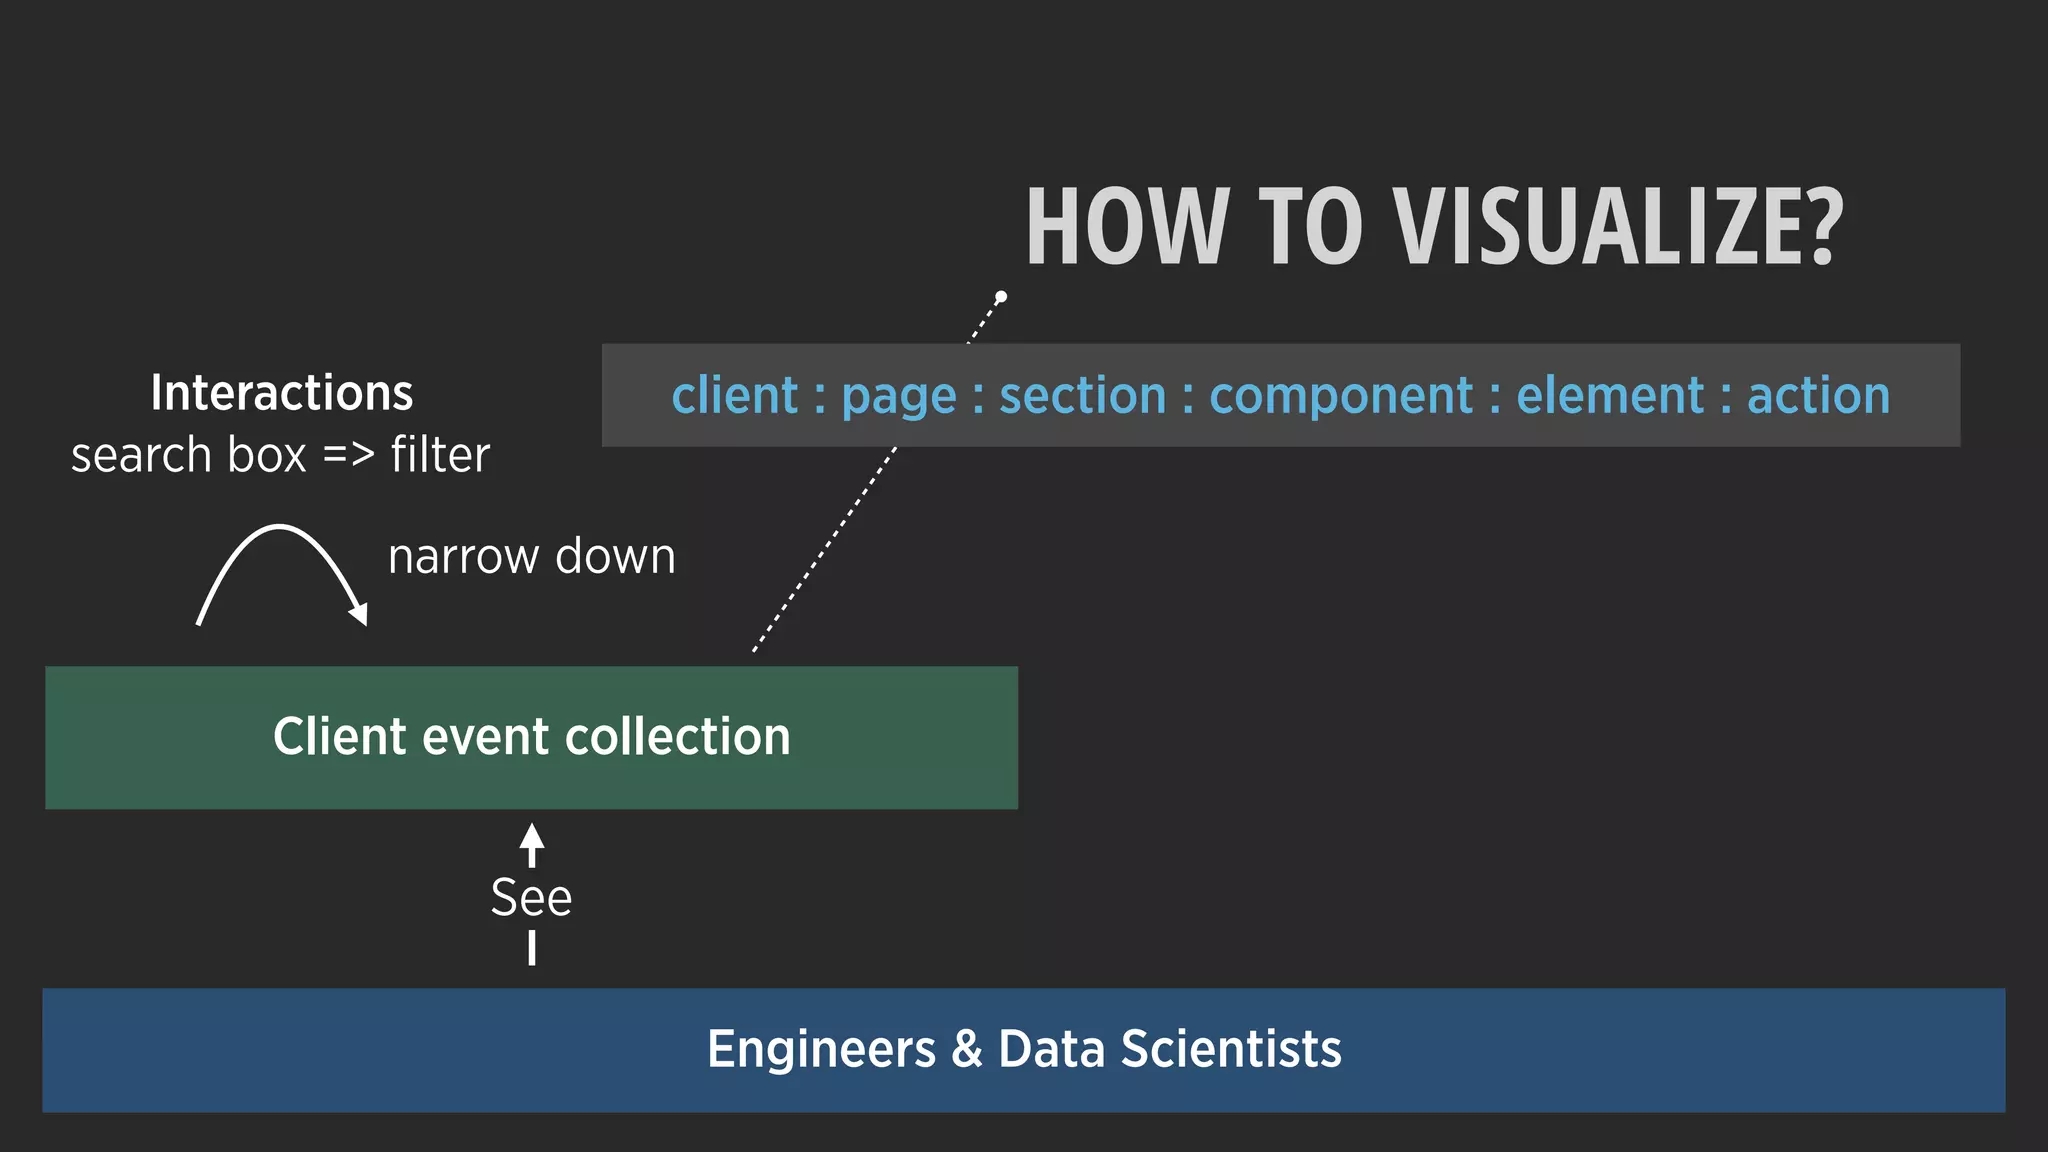
client : page : section : component : element : action
web : home : timeline : tweet_box : button : tweet
1) User ID
2) Timestamp
3) Event name
4) Event detail
[Lee et al. 2012]](https://image.slidesharecdn.com/6thingstoexpectwhenyouarevisualizingshared-170228063140/75/6-things-to-expect-when-you-are-visualizing-148-2048.jpg)


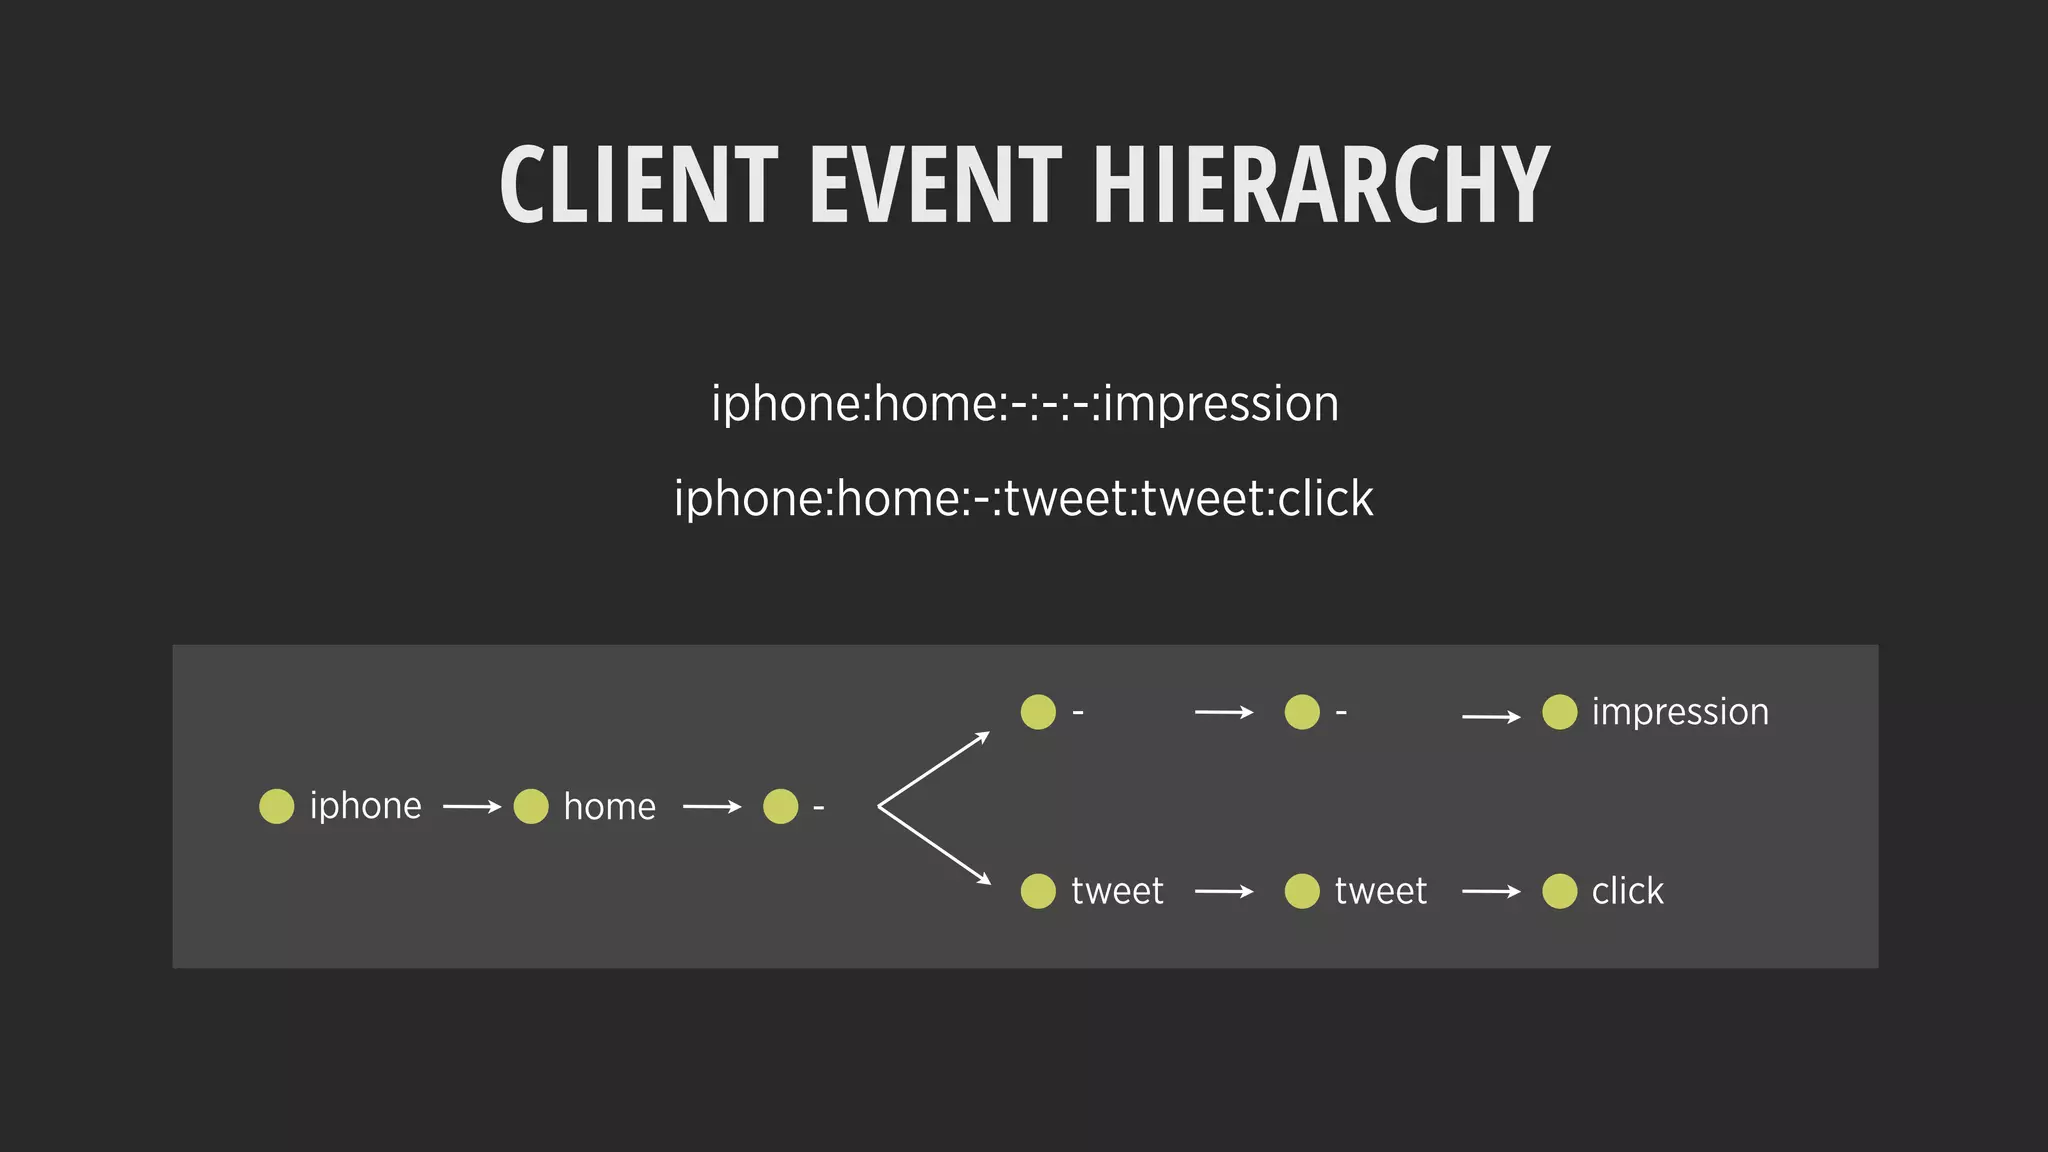
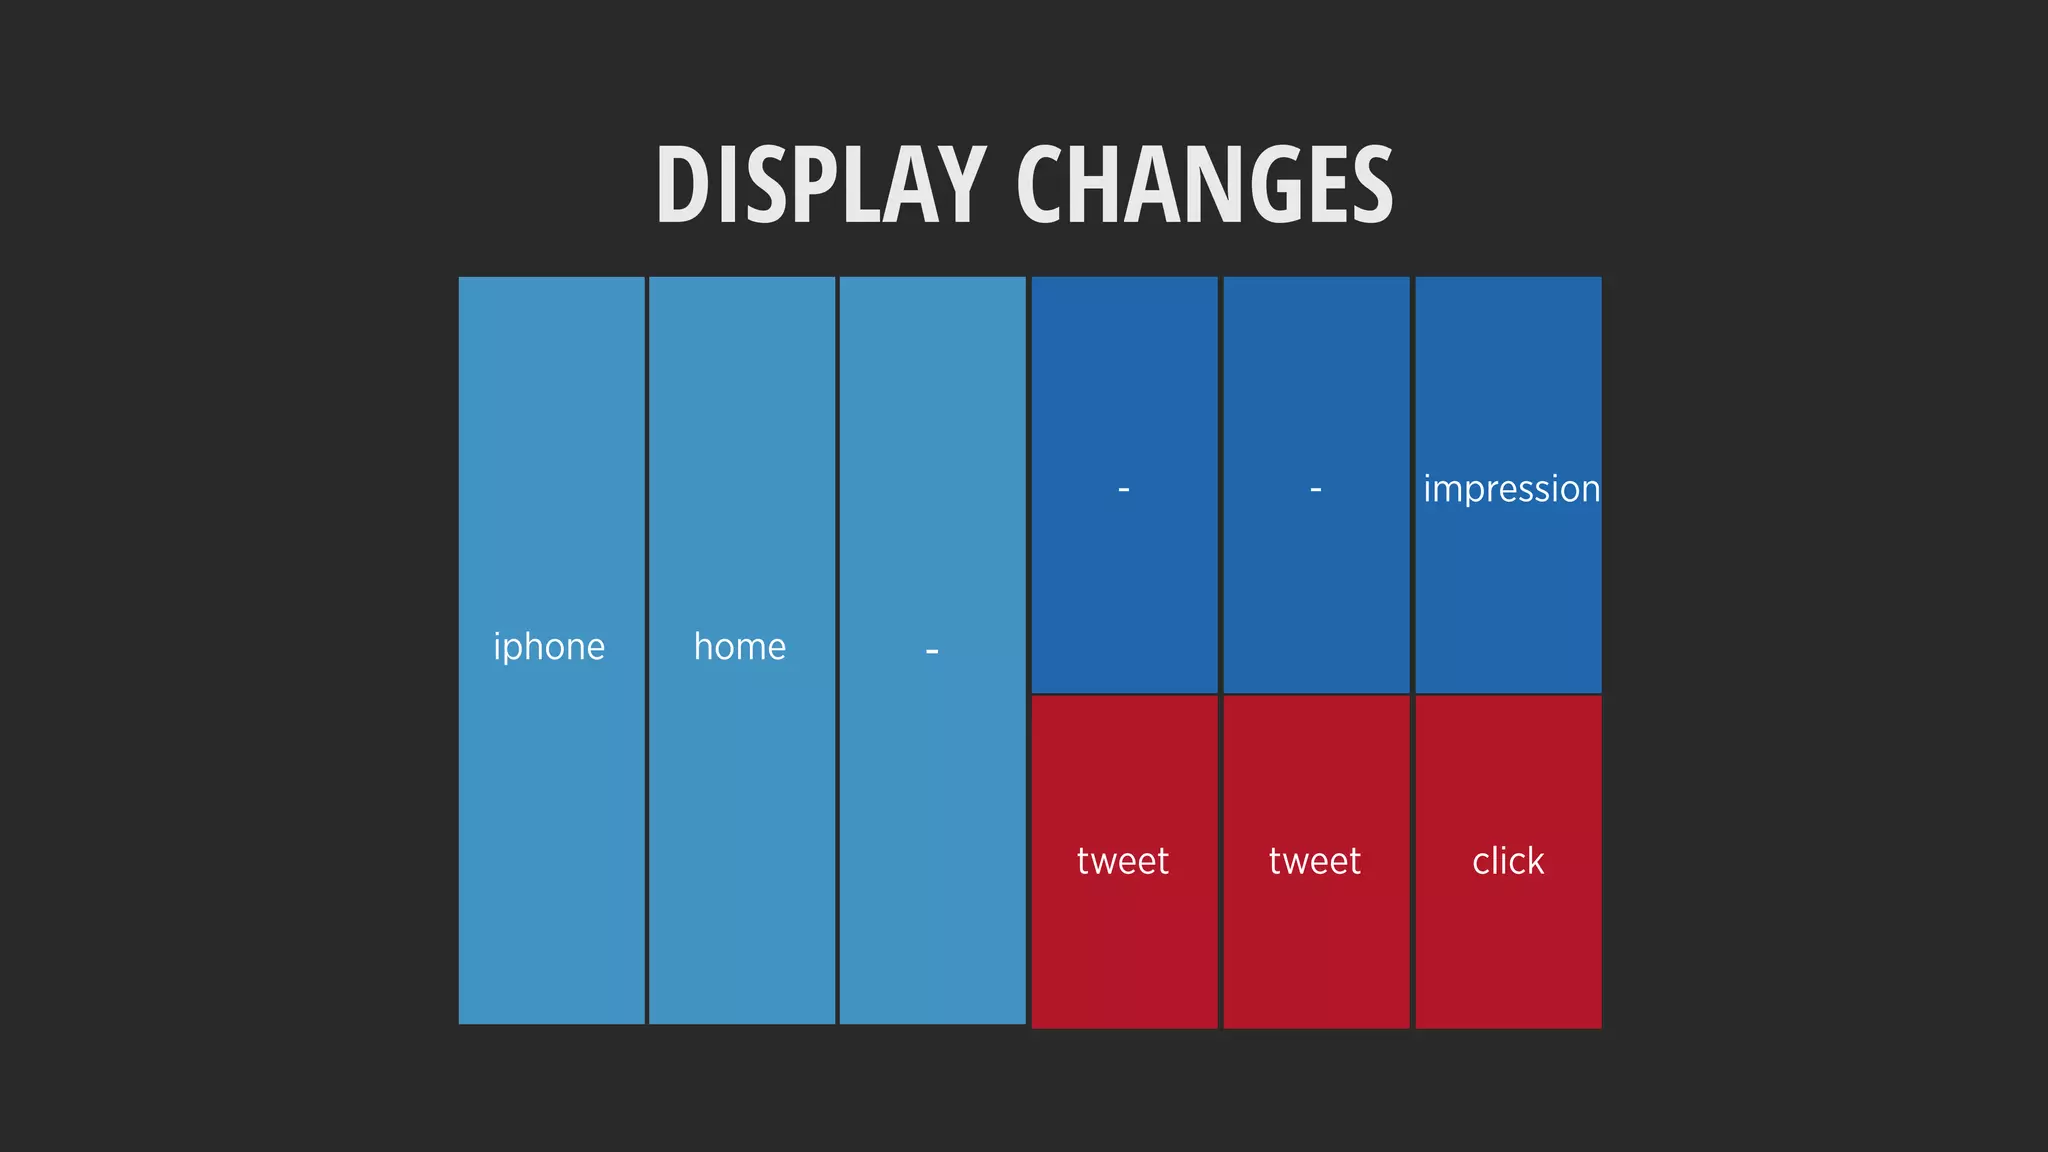
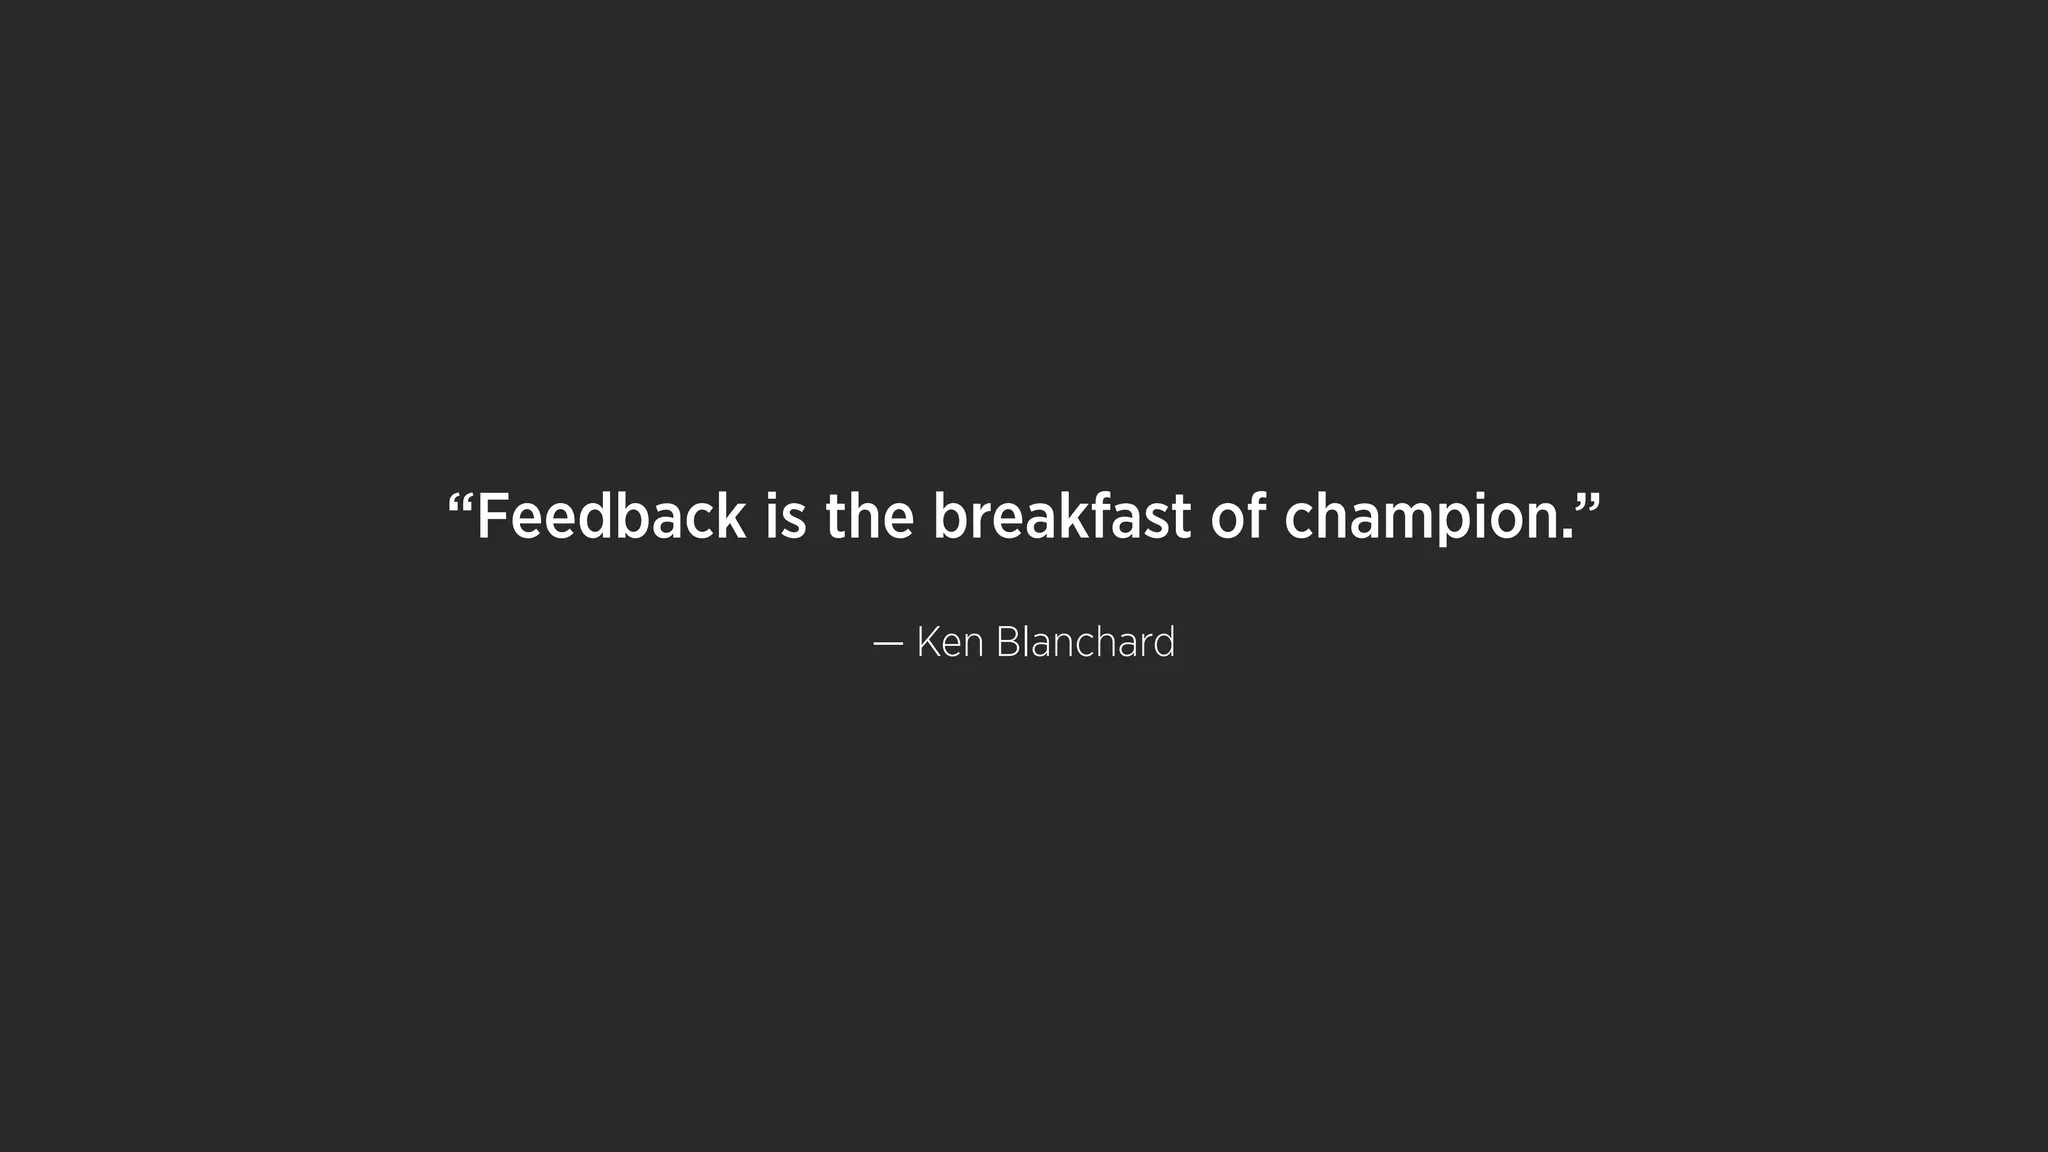
![DISPLAY CHANGES
iphone home -
- - impression
tweet tweet click
Map of the Market [Wattenberg 1999], StemView [Guerra-Gomez et al. 2013]](https://image.slidesharecdn.com/6thingstoexpectwhenyouarevisualizingshared-170228063140/75/6-things-to-expect-when-you-are-visualizing-168-2048.jpg)


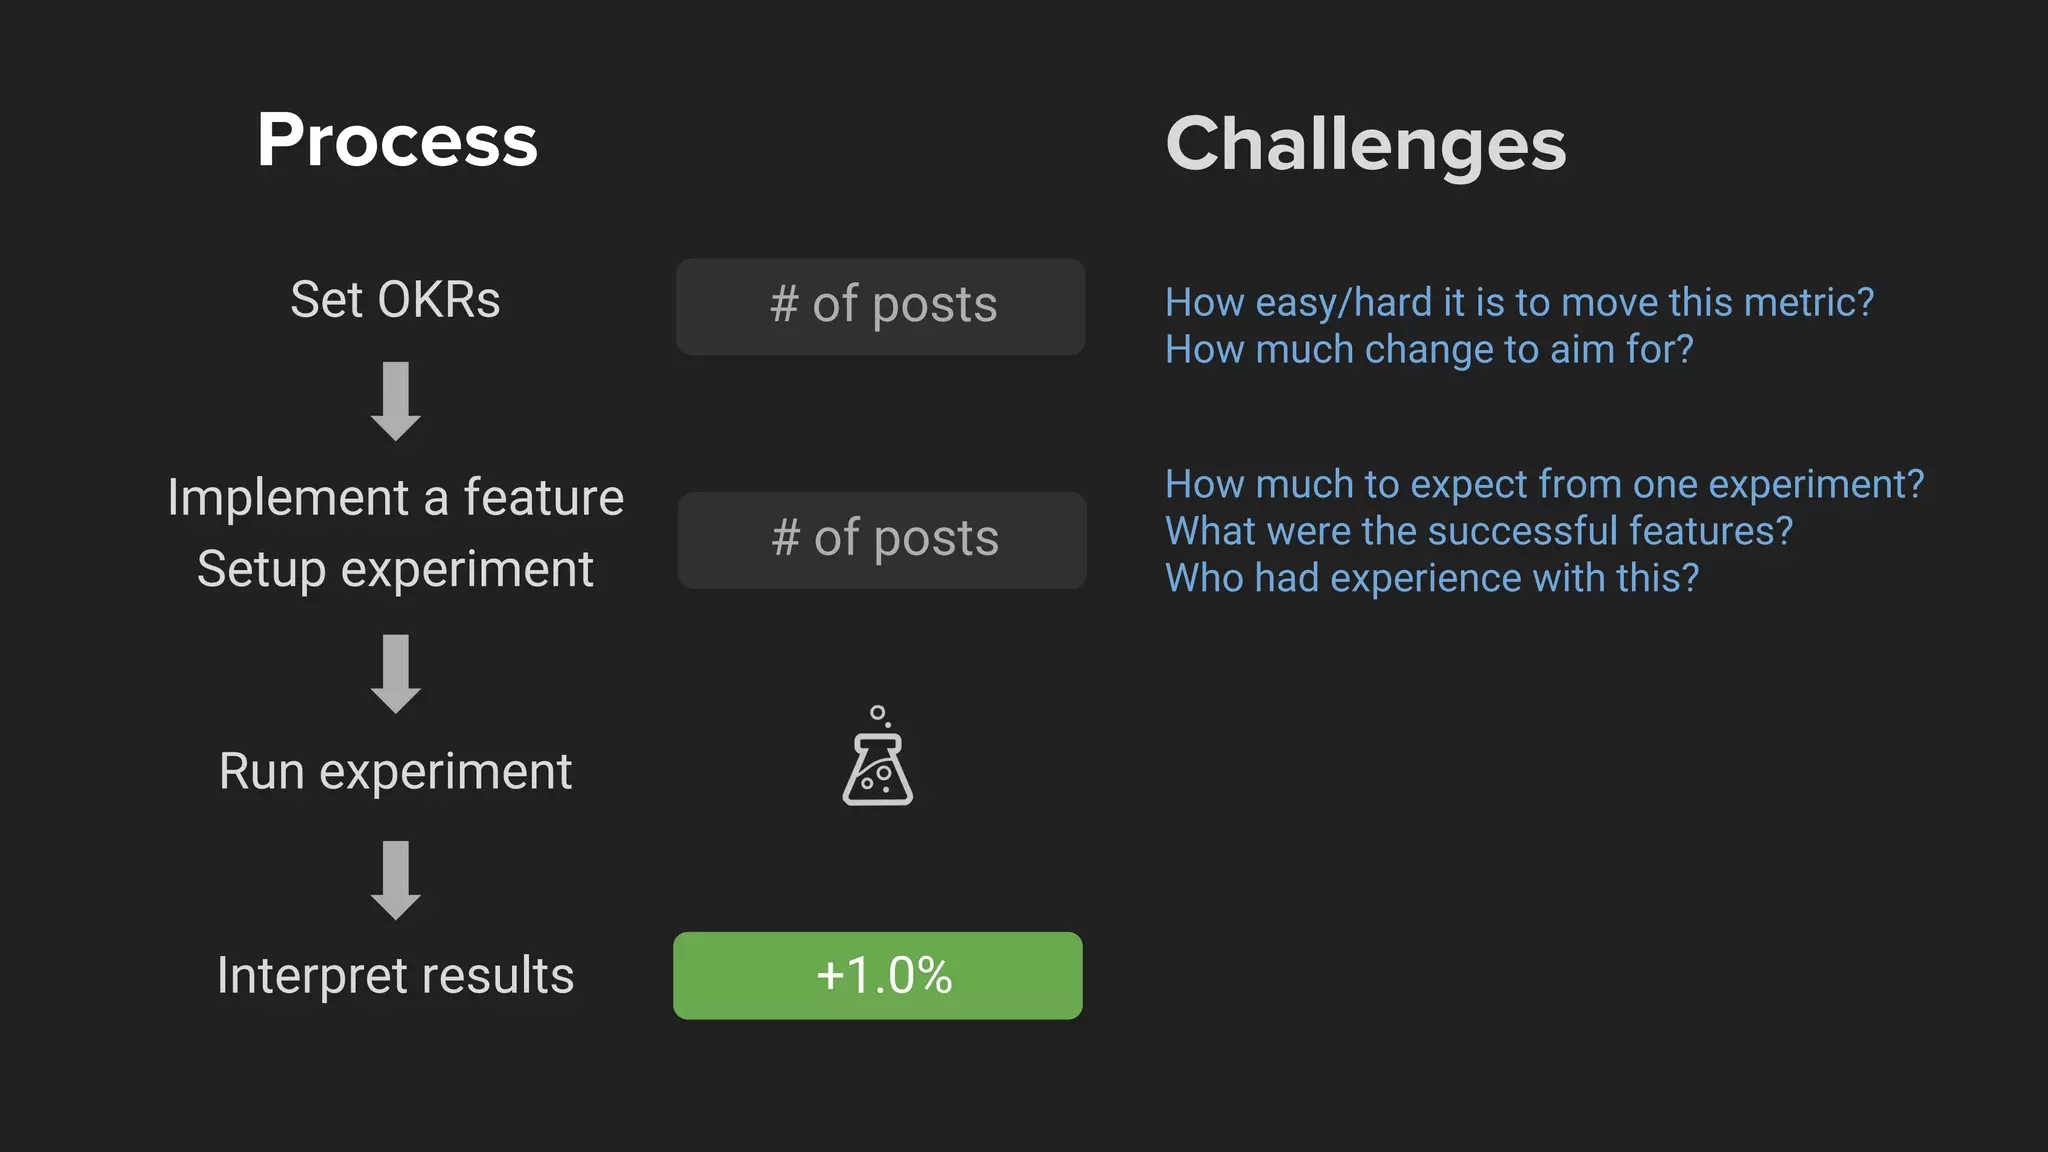


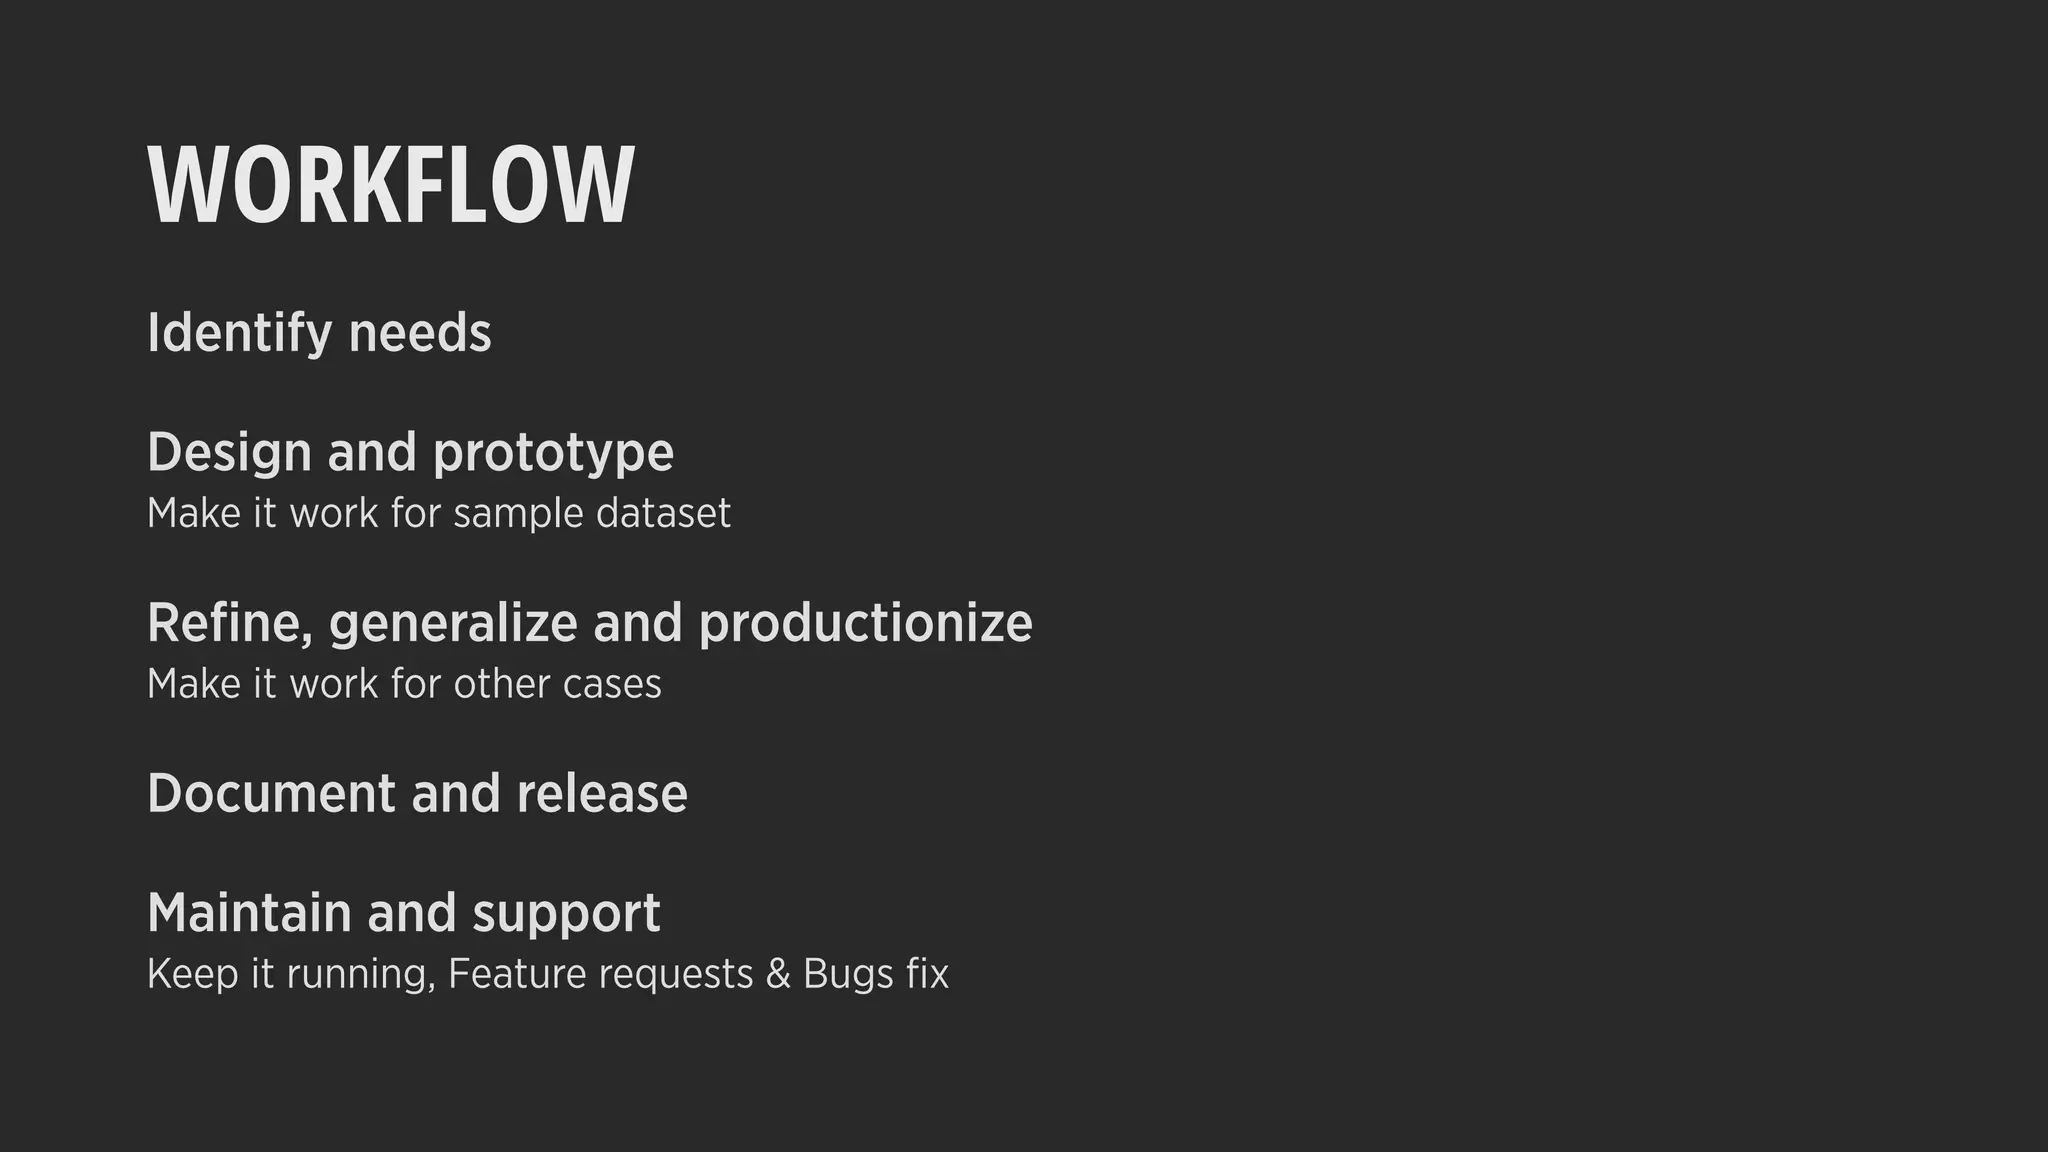


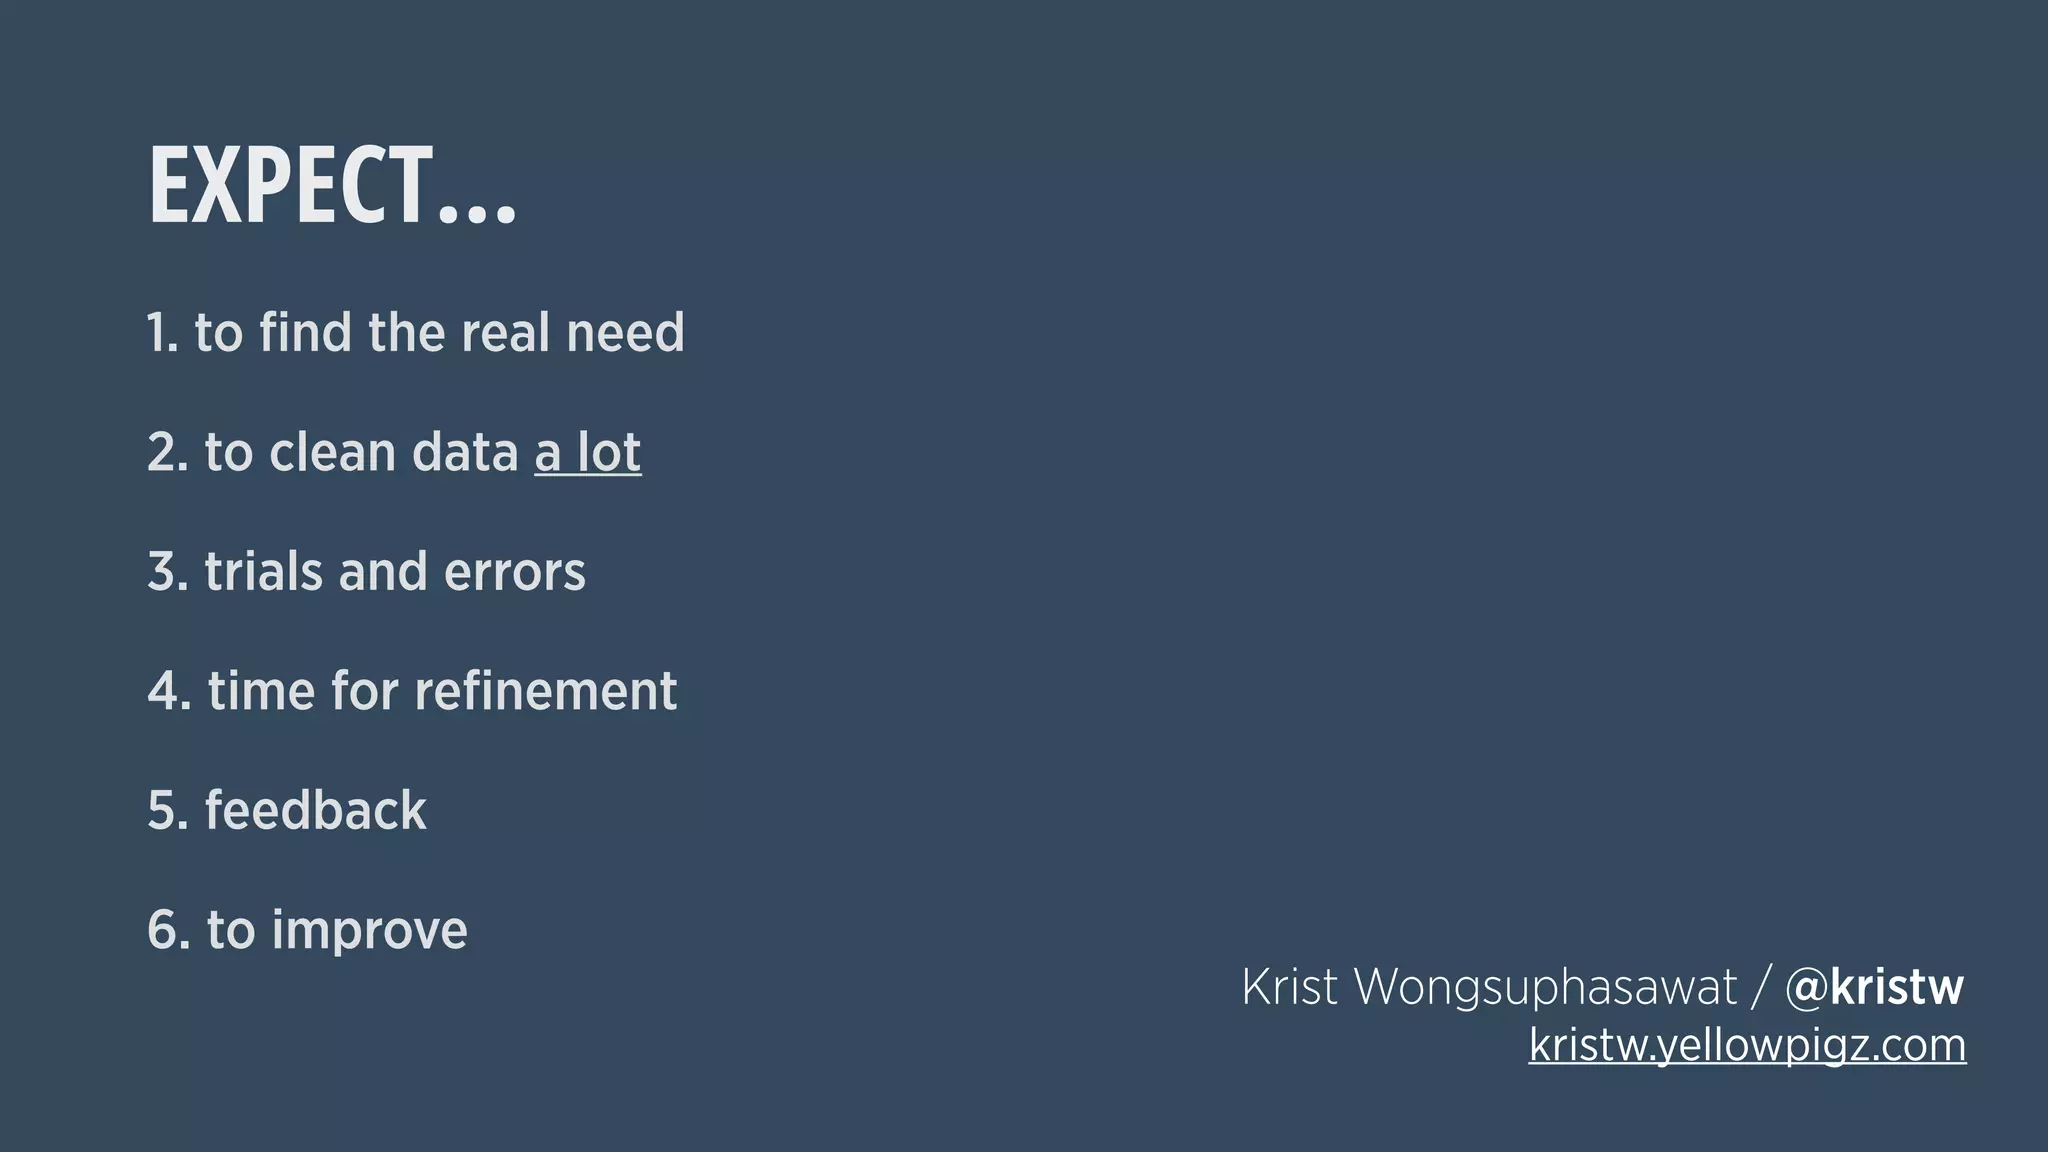


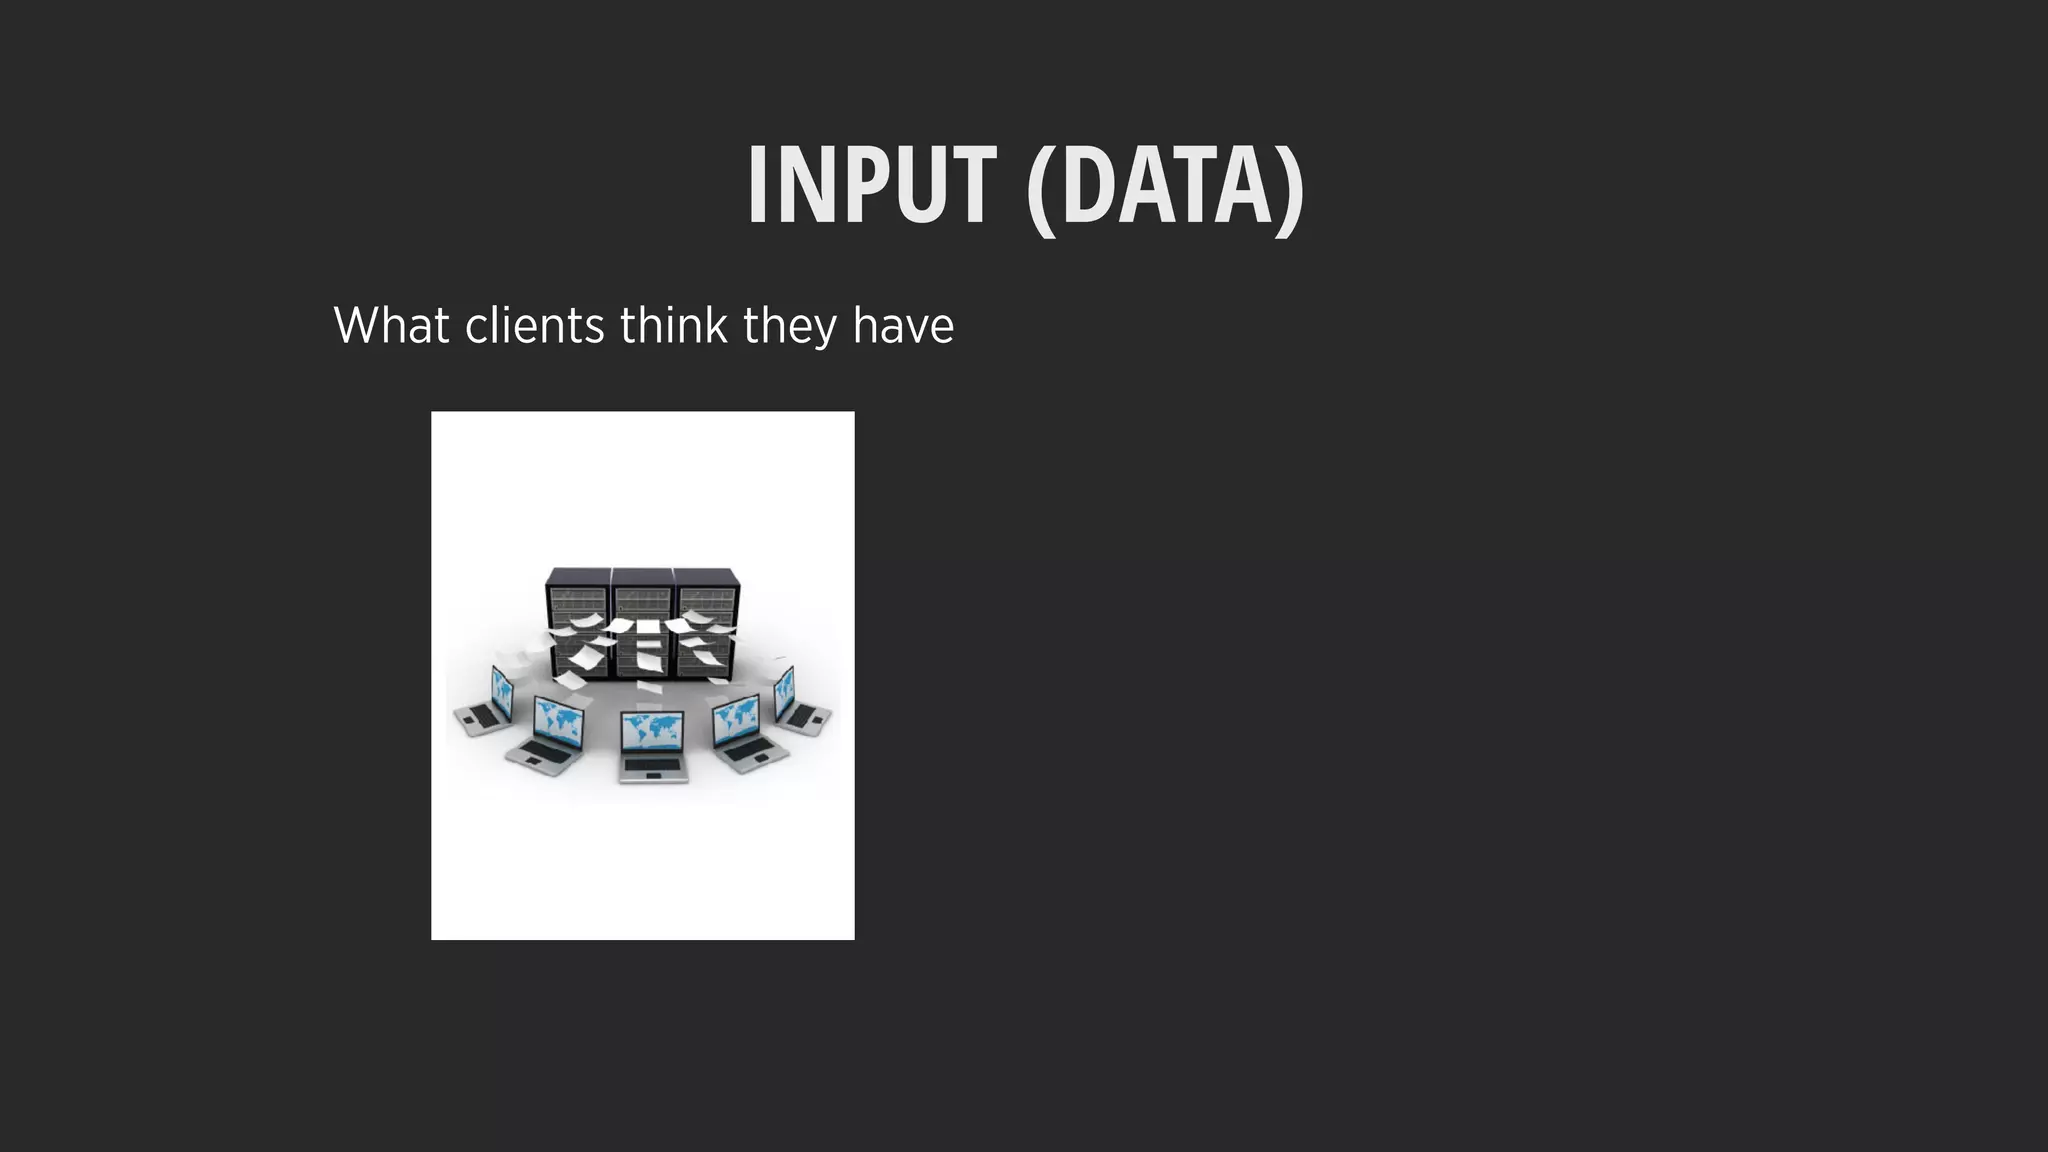
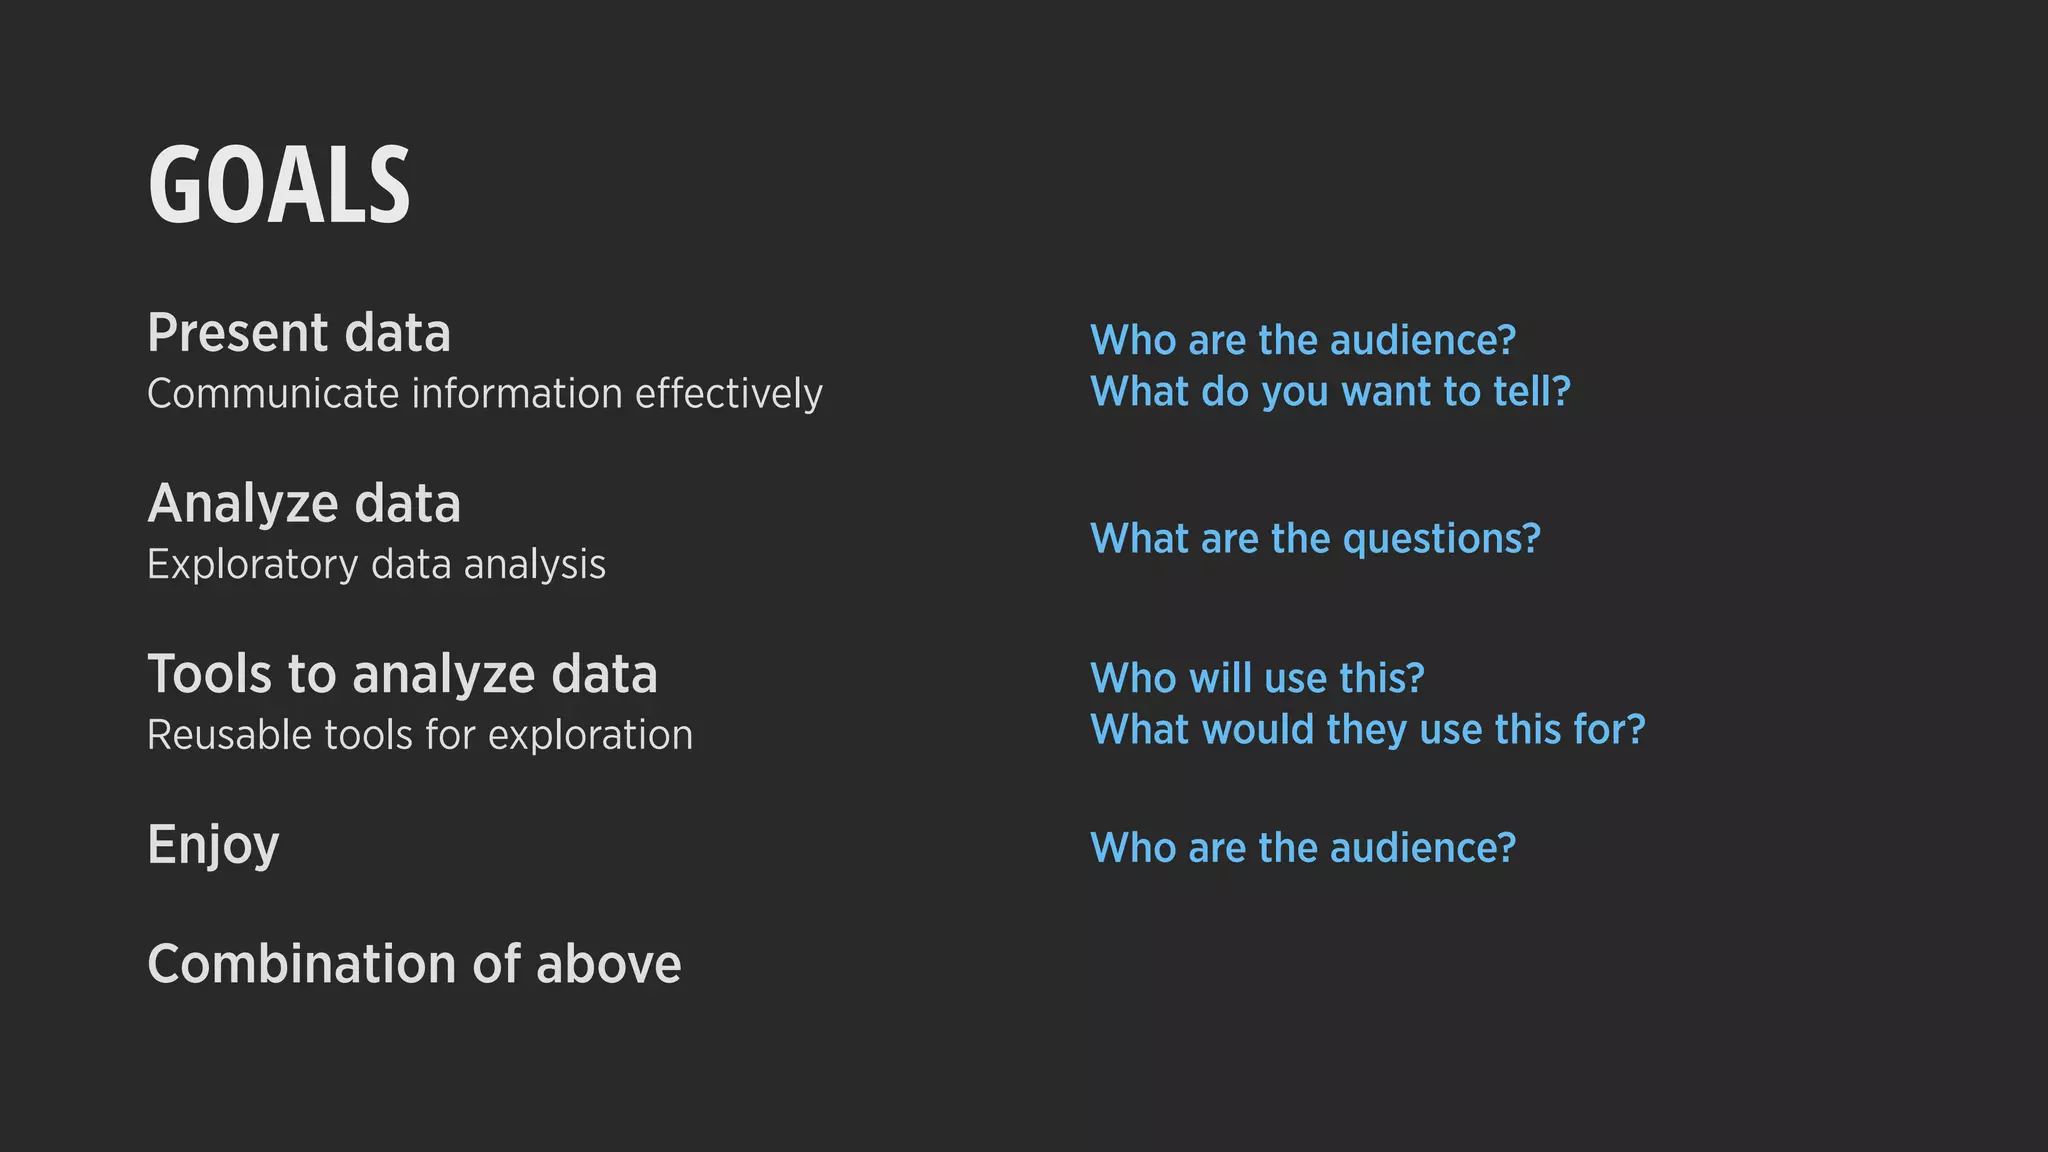
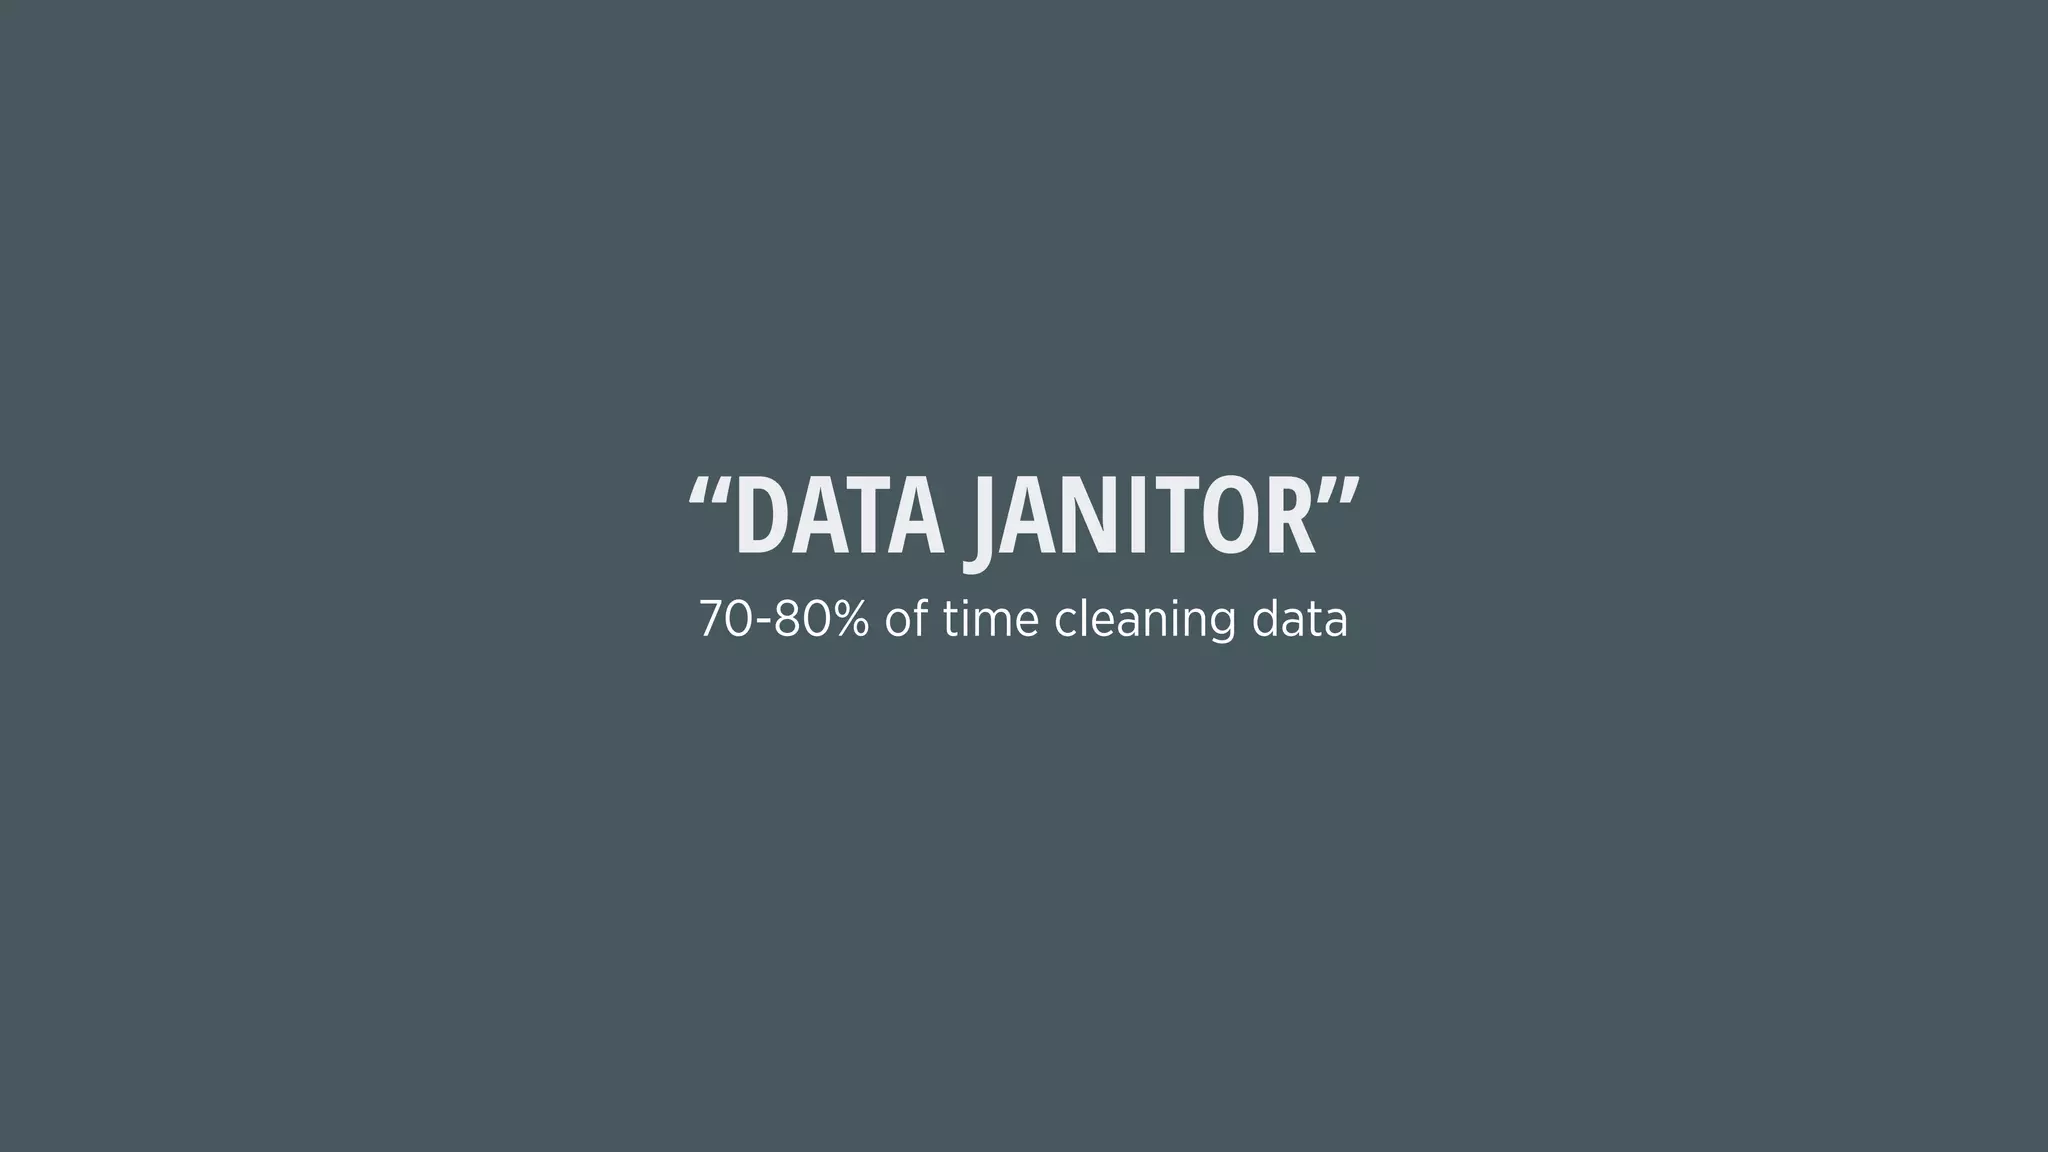
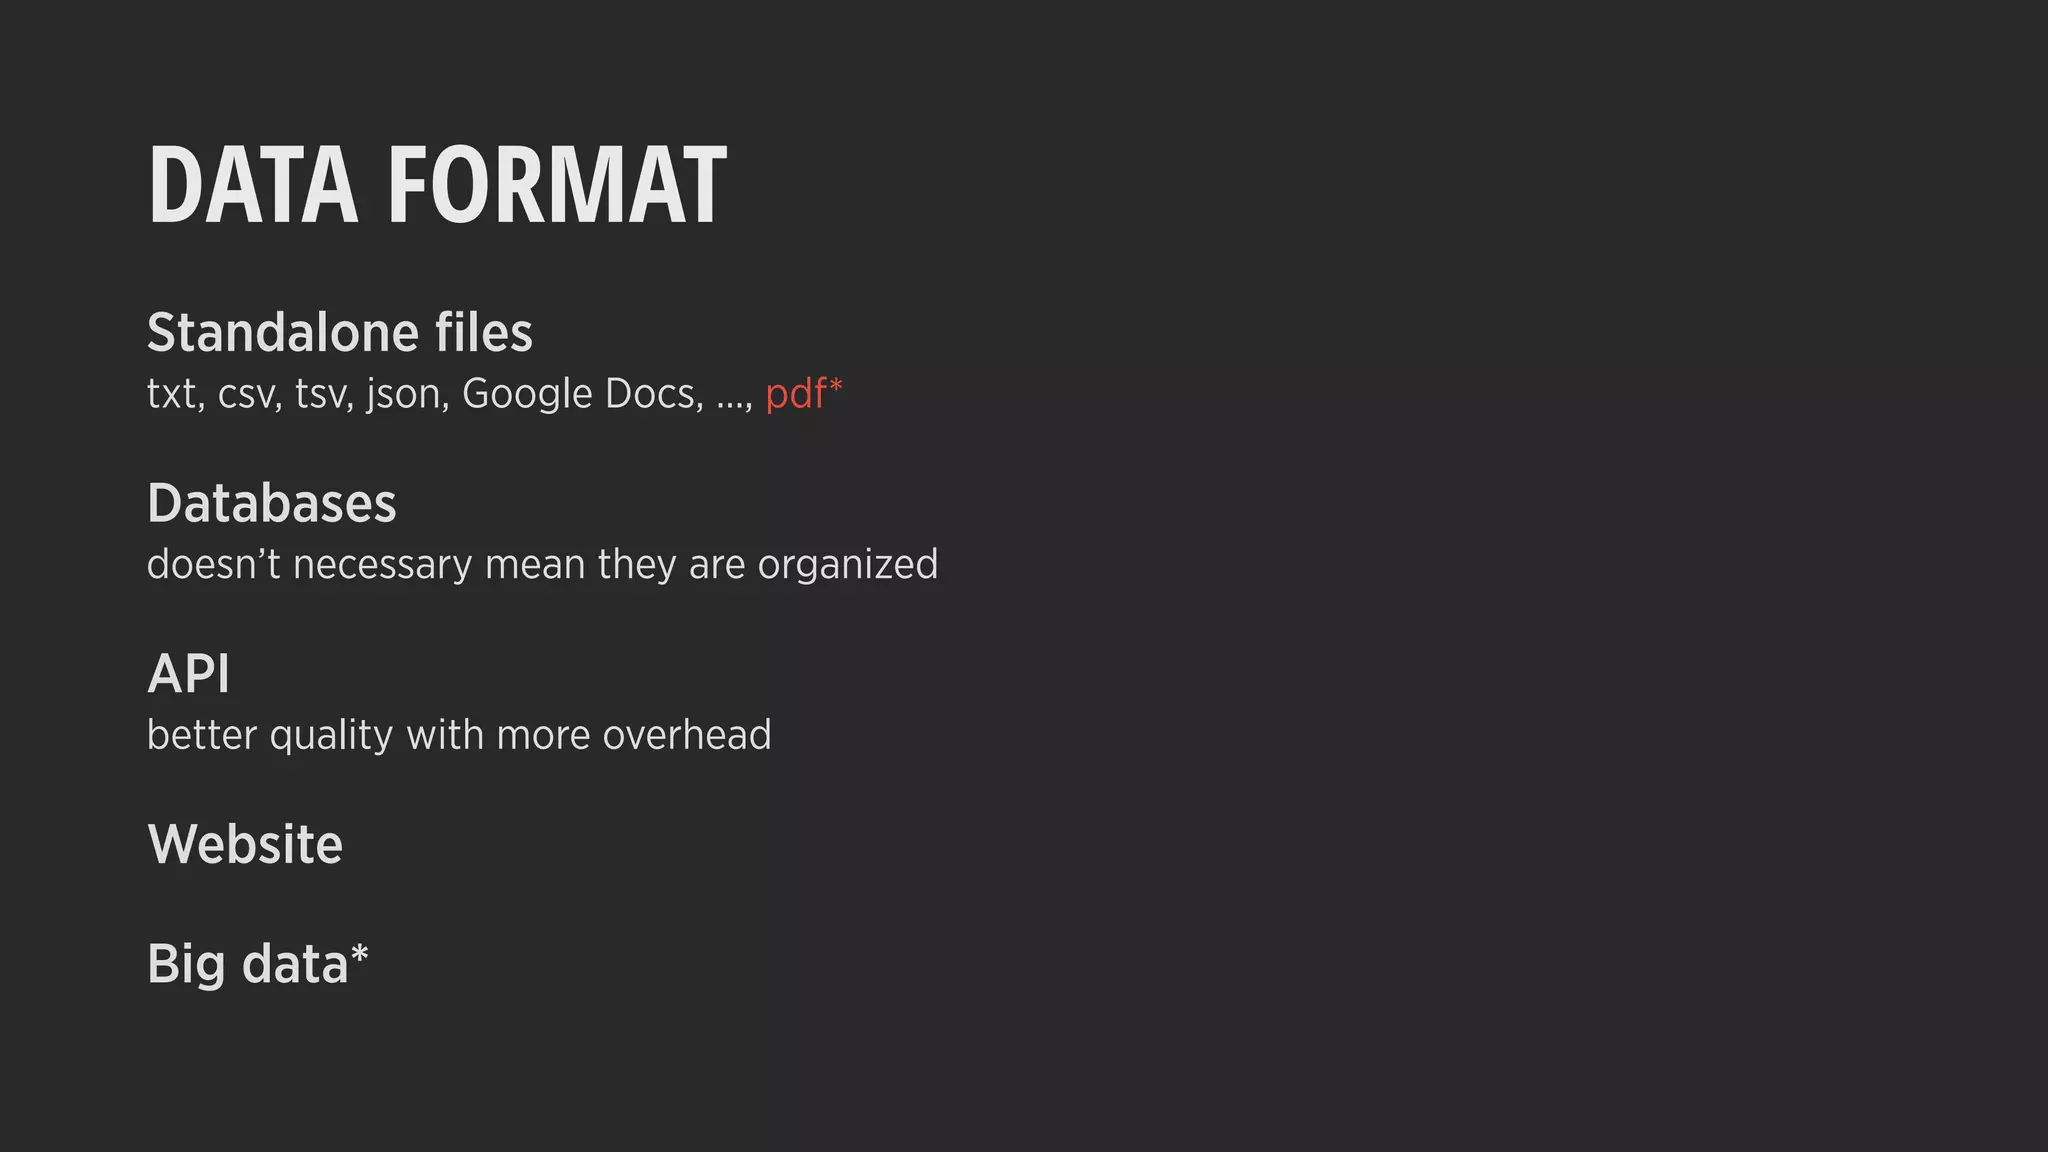
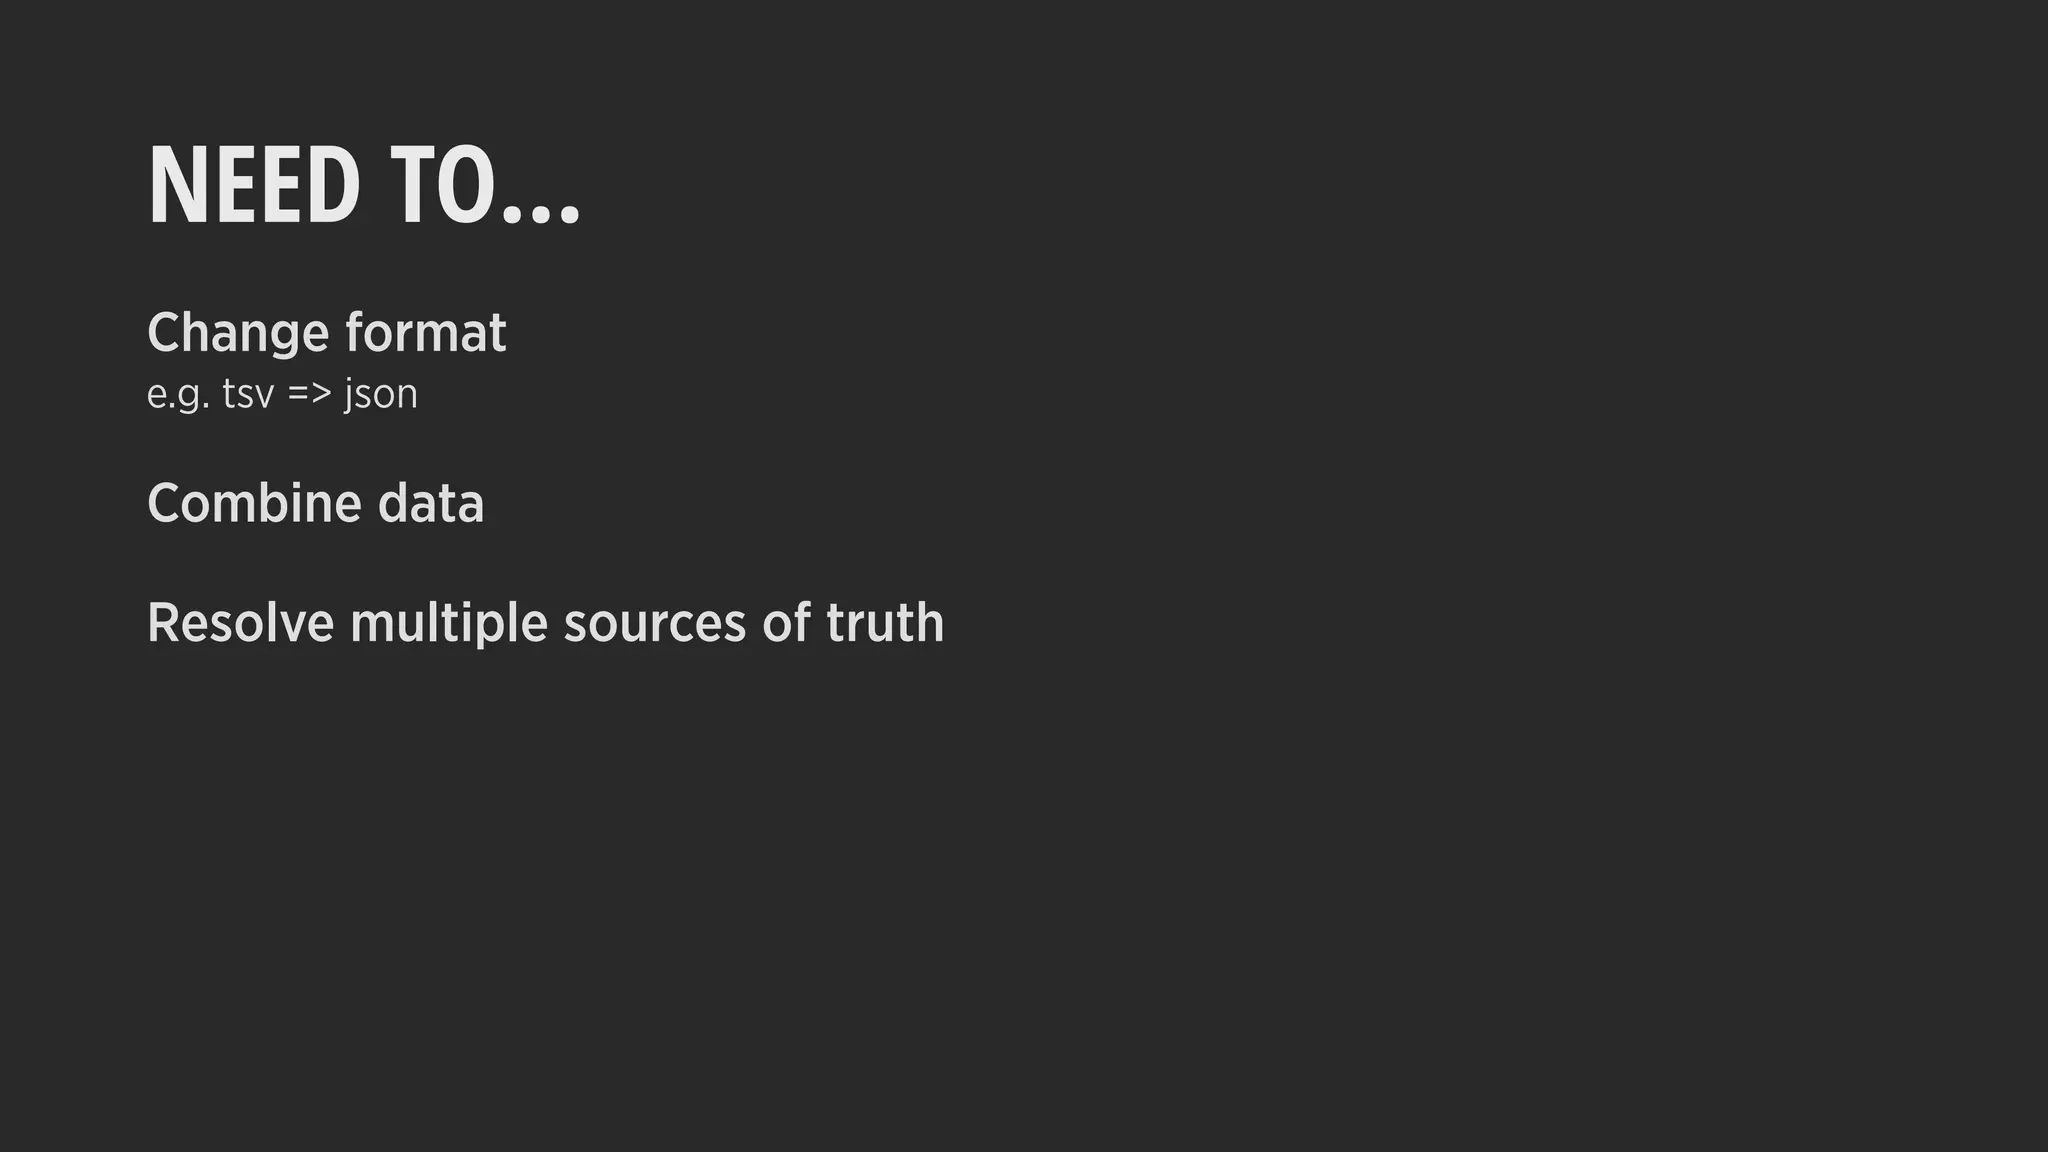
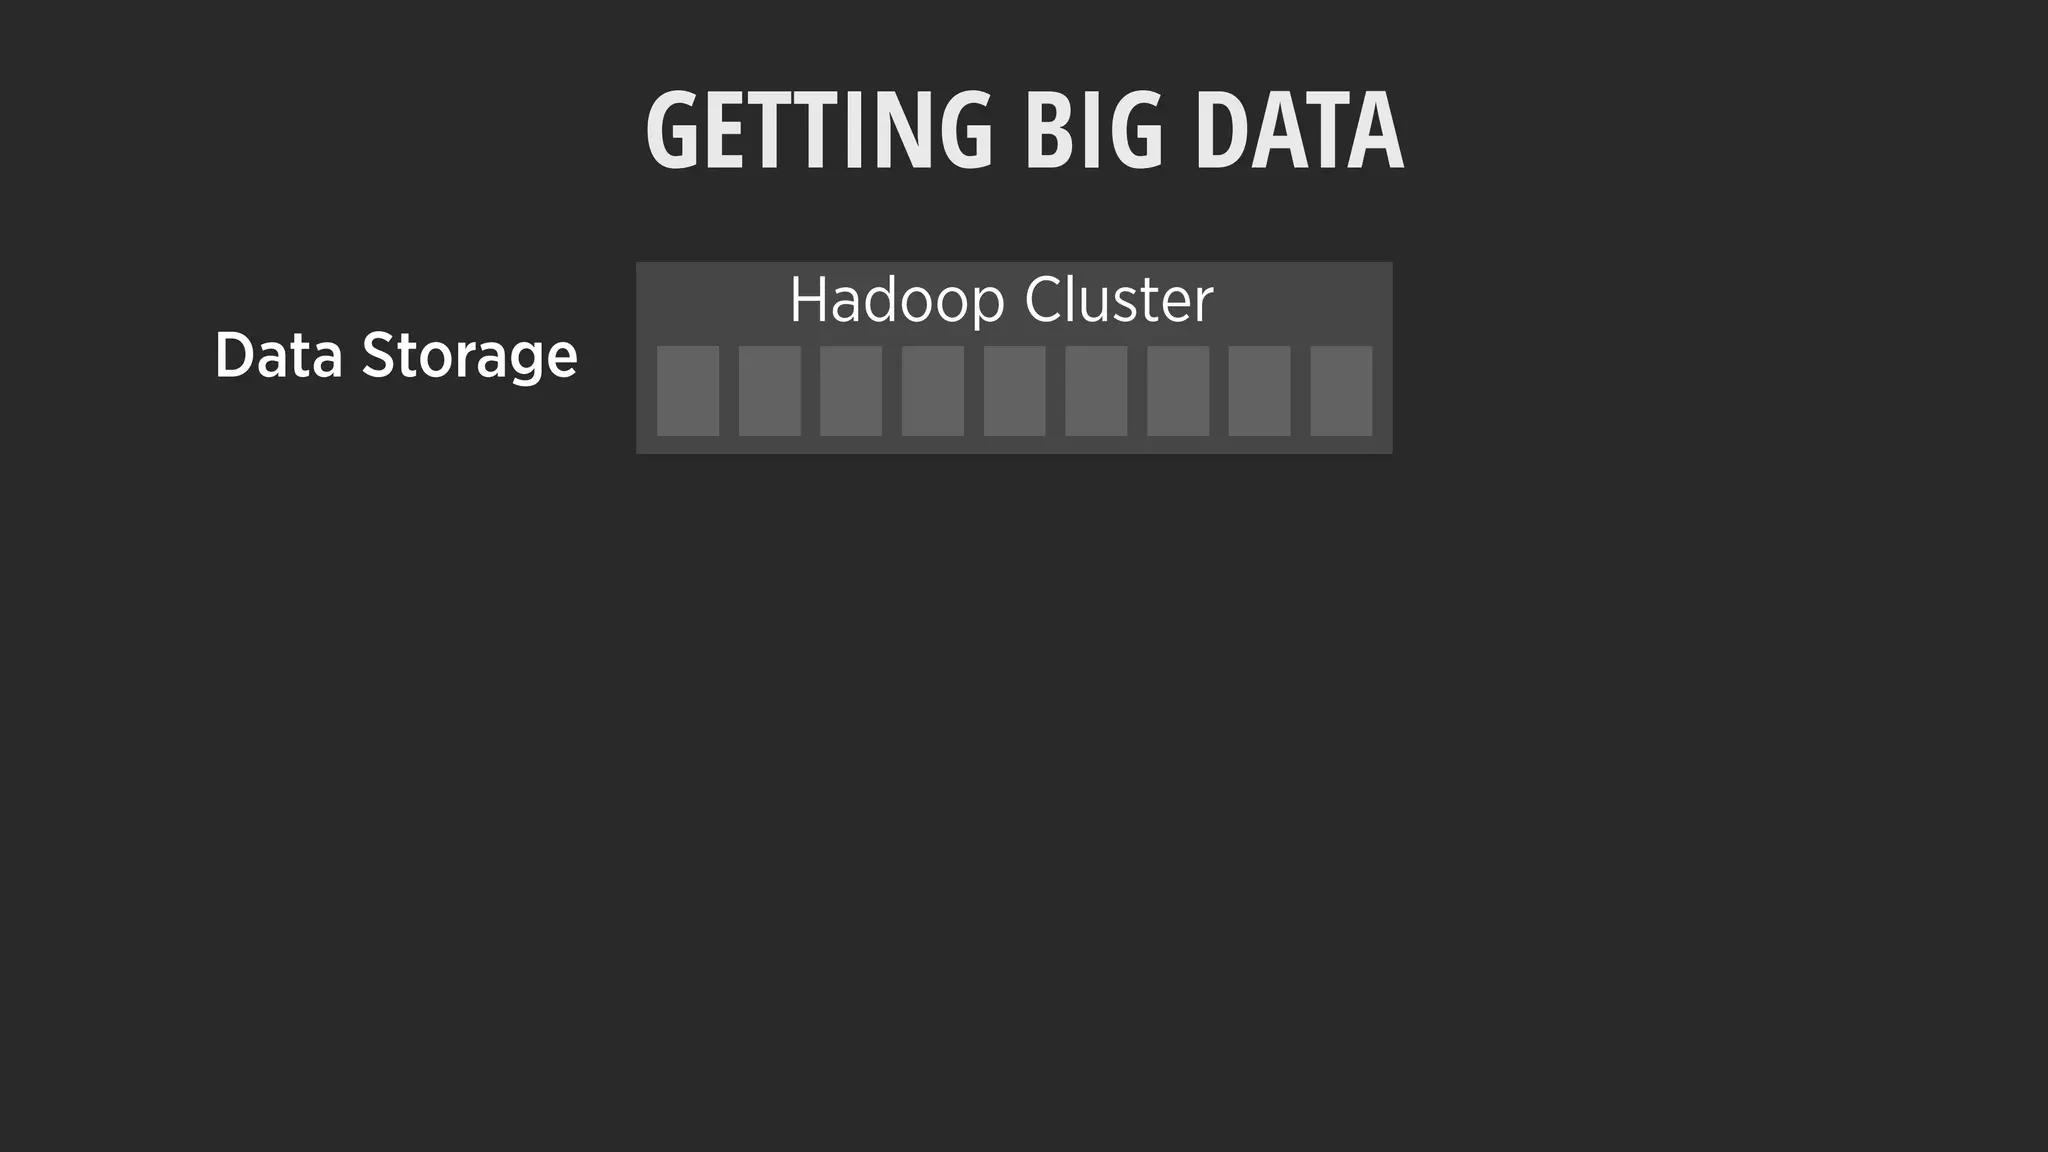
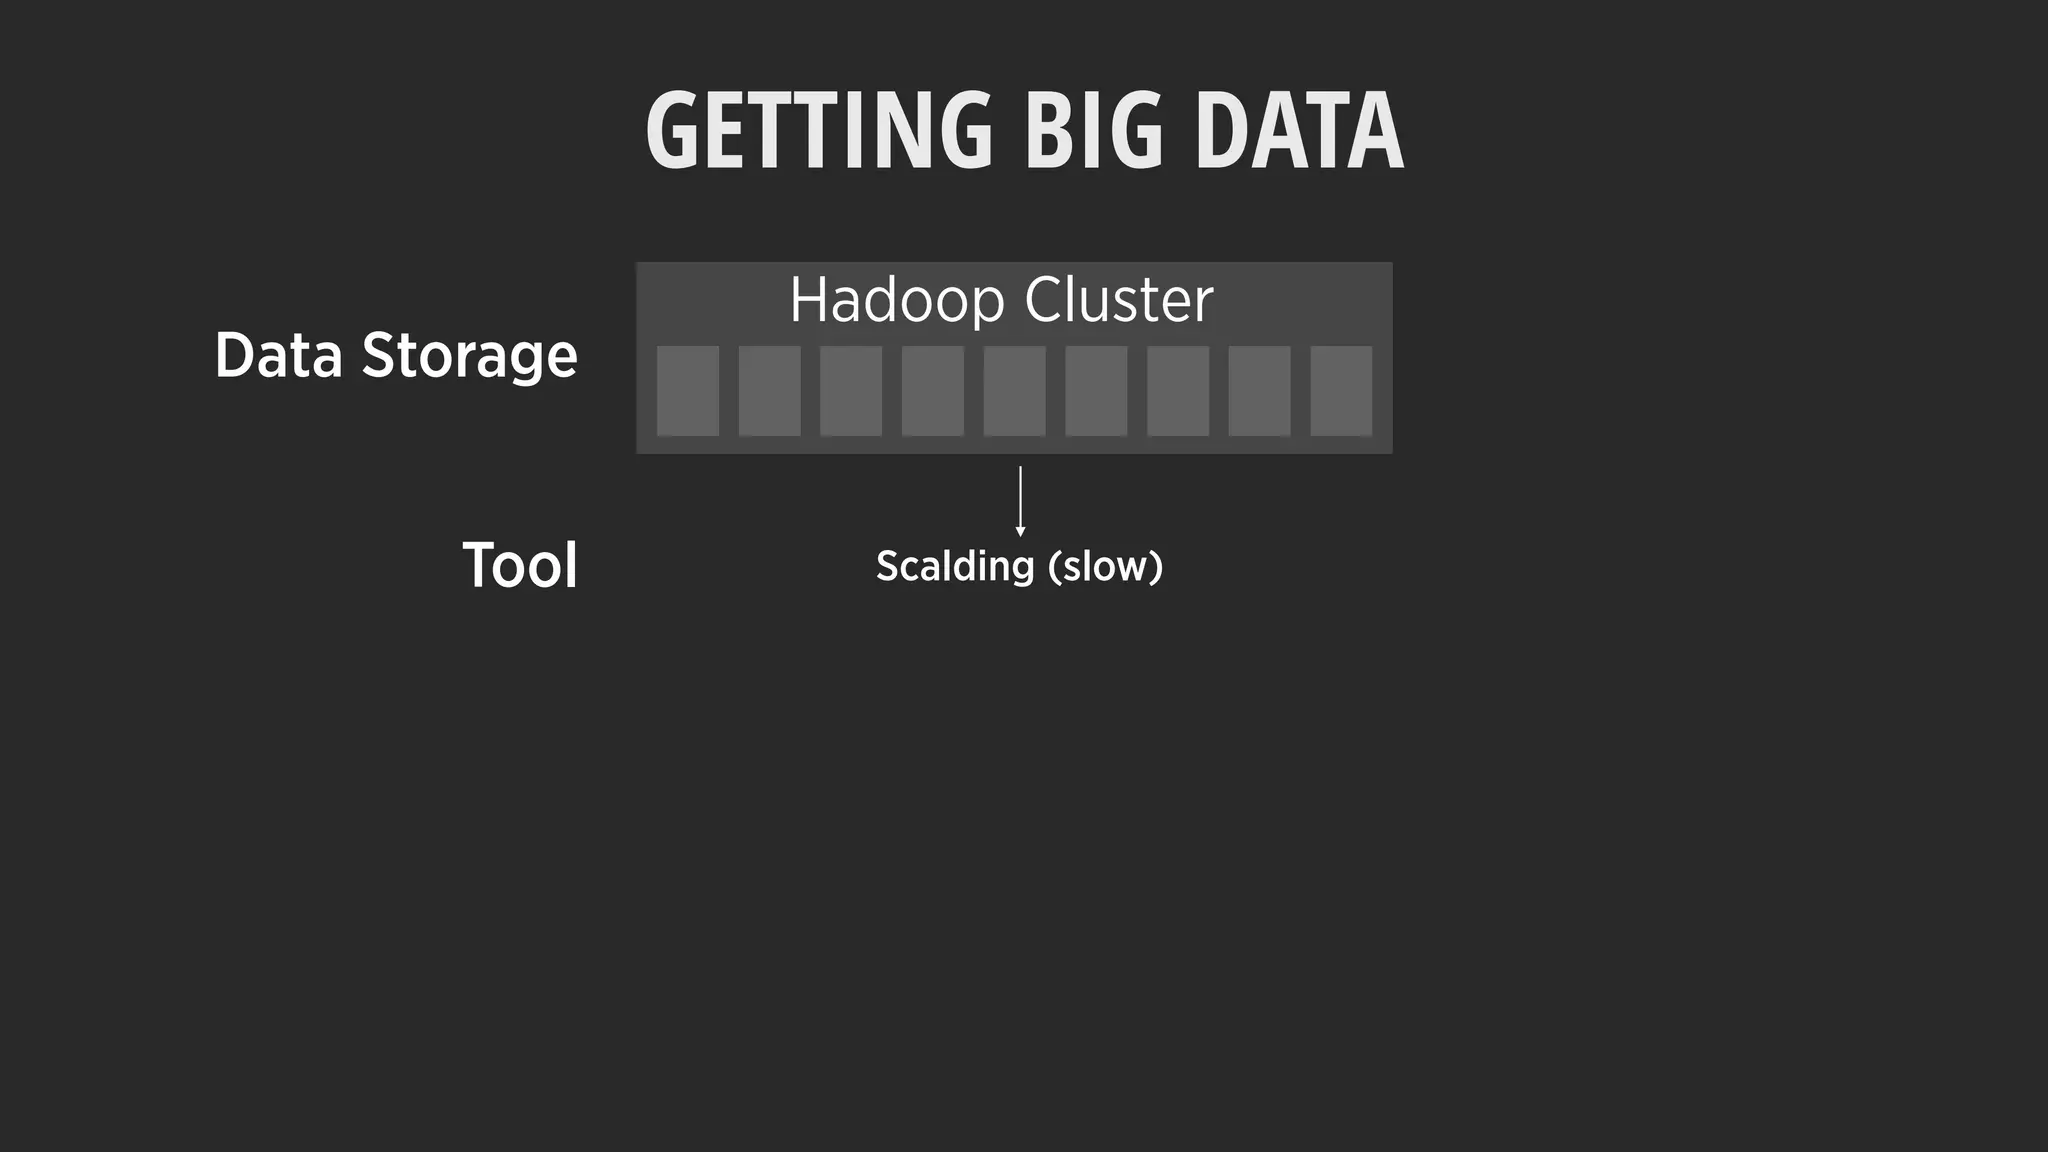
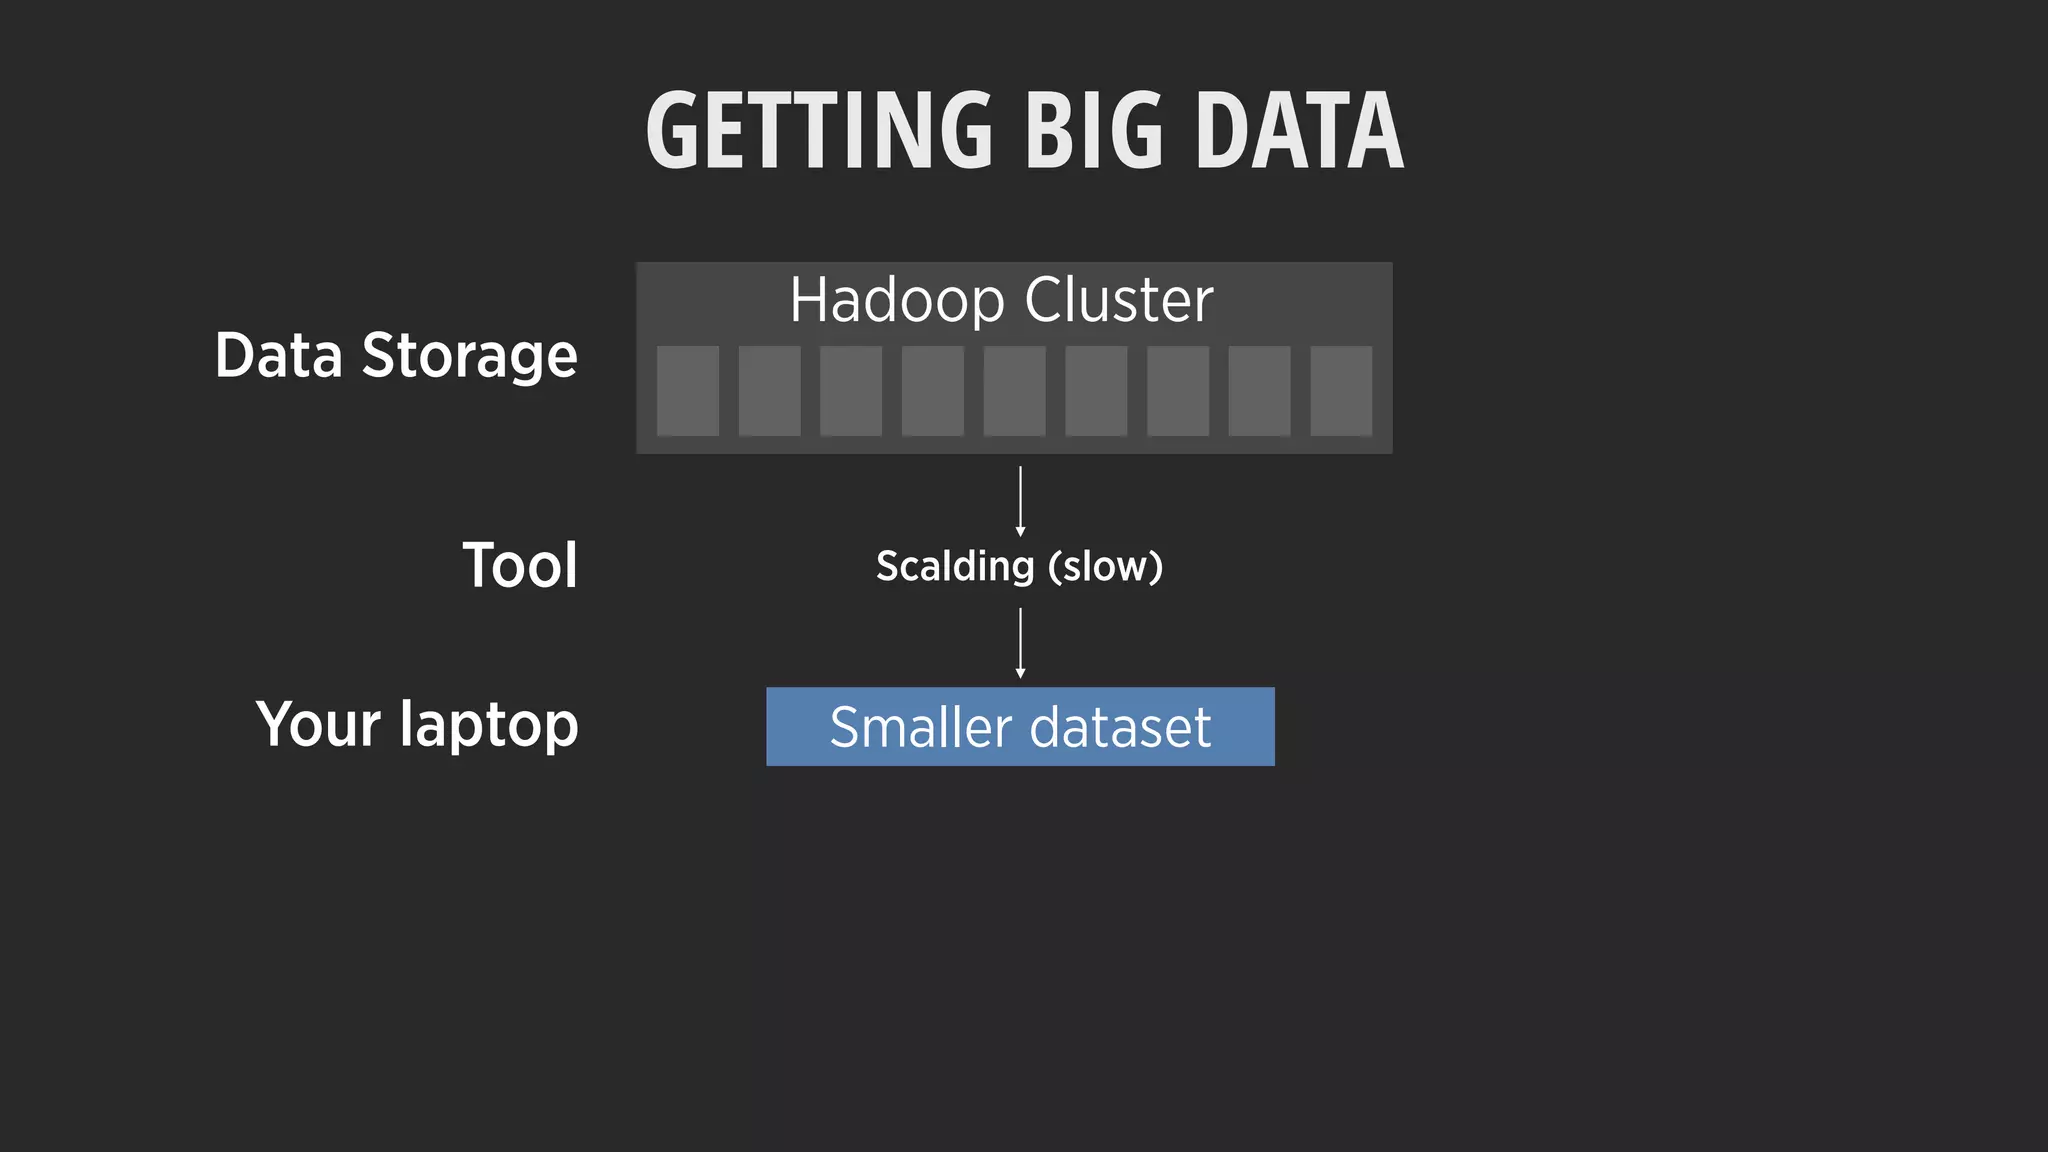
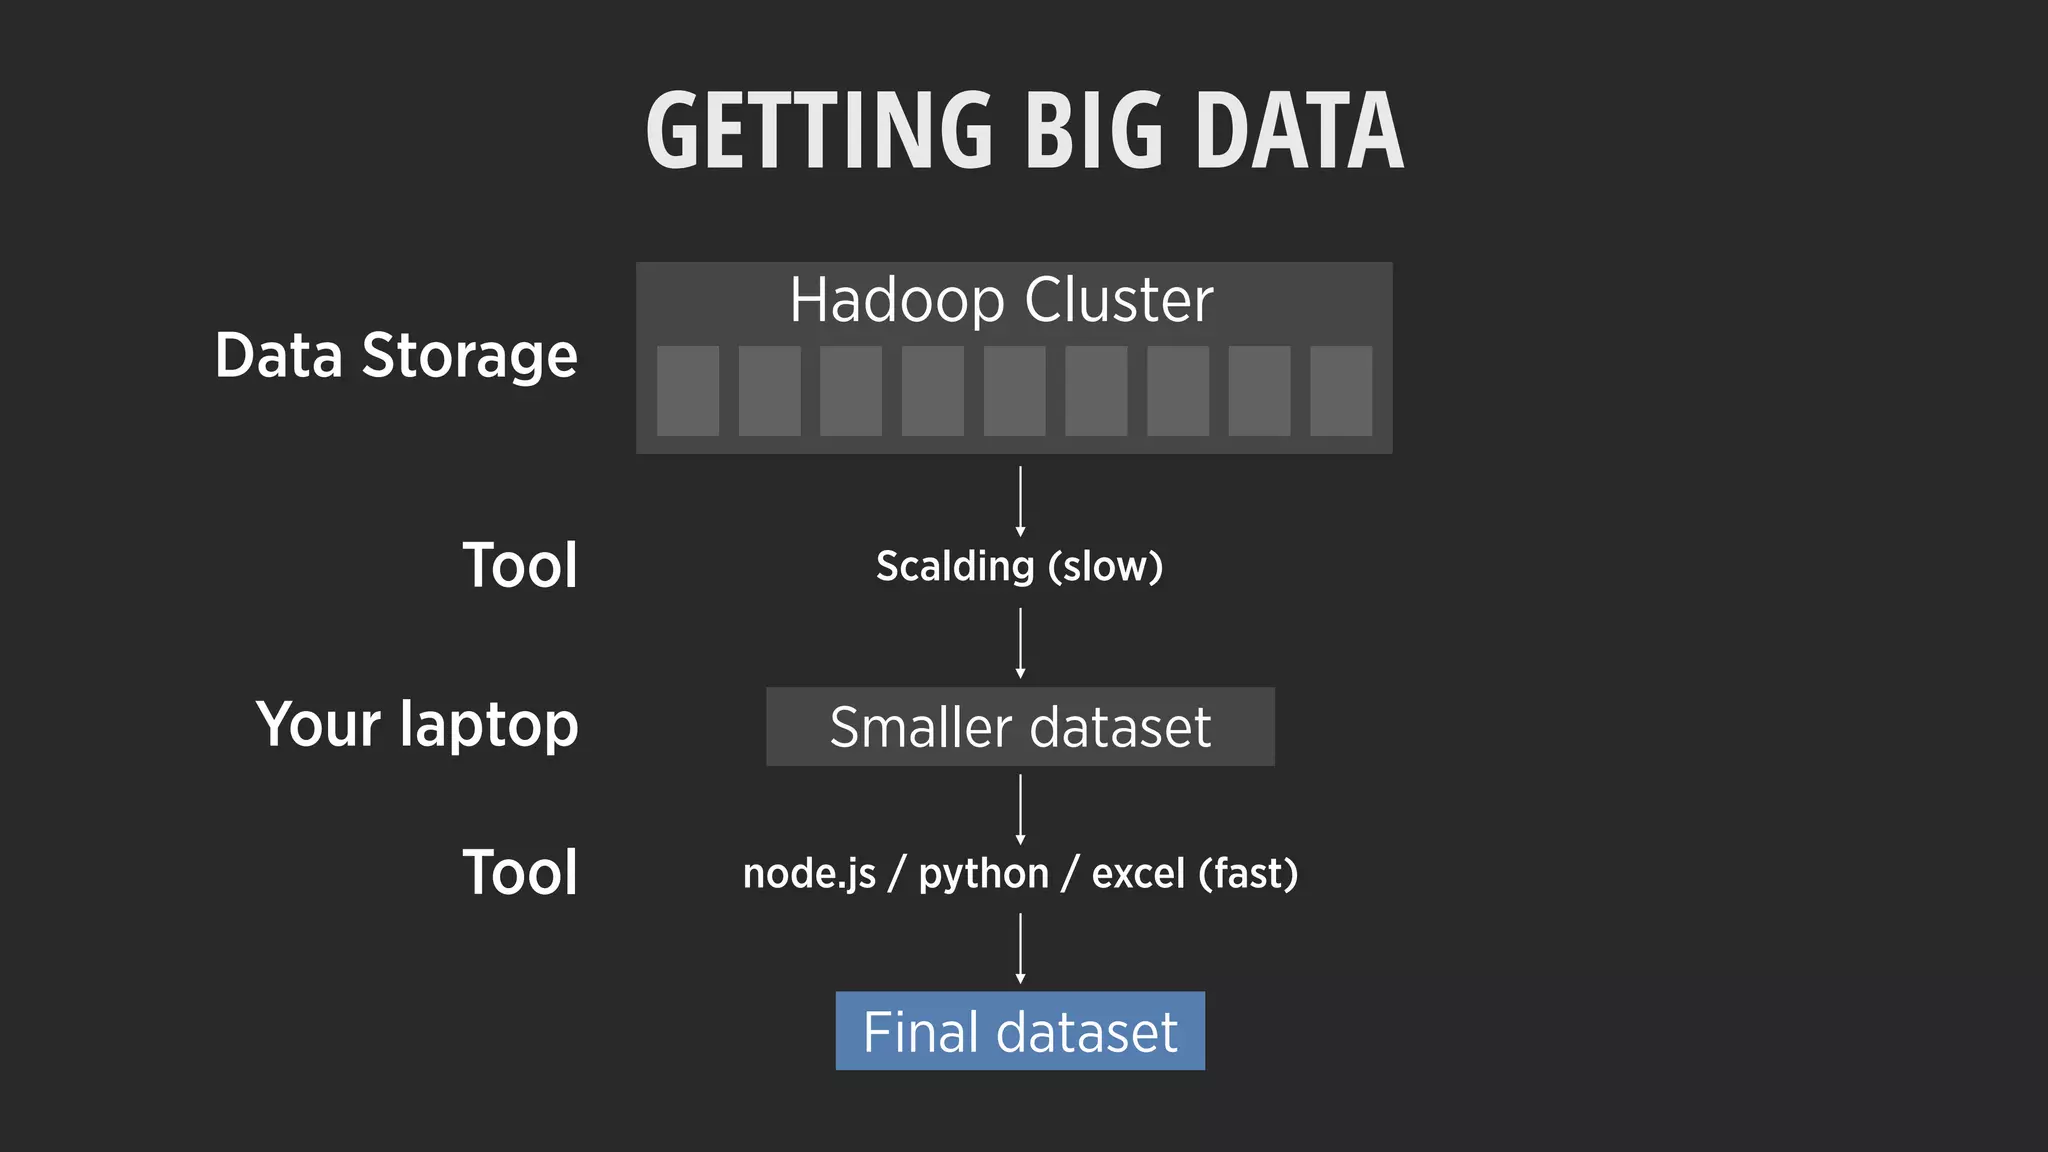
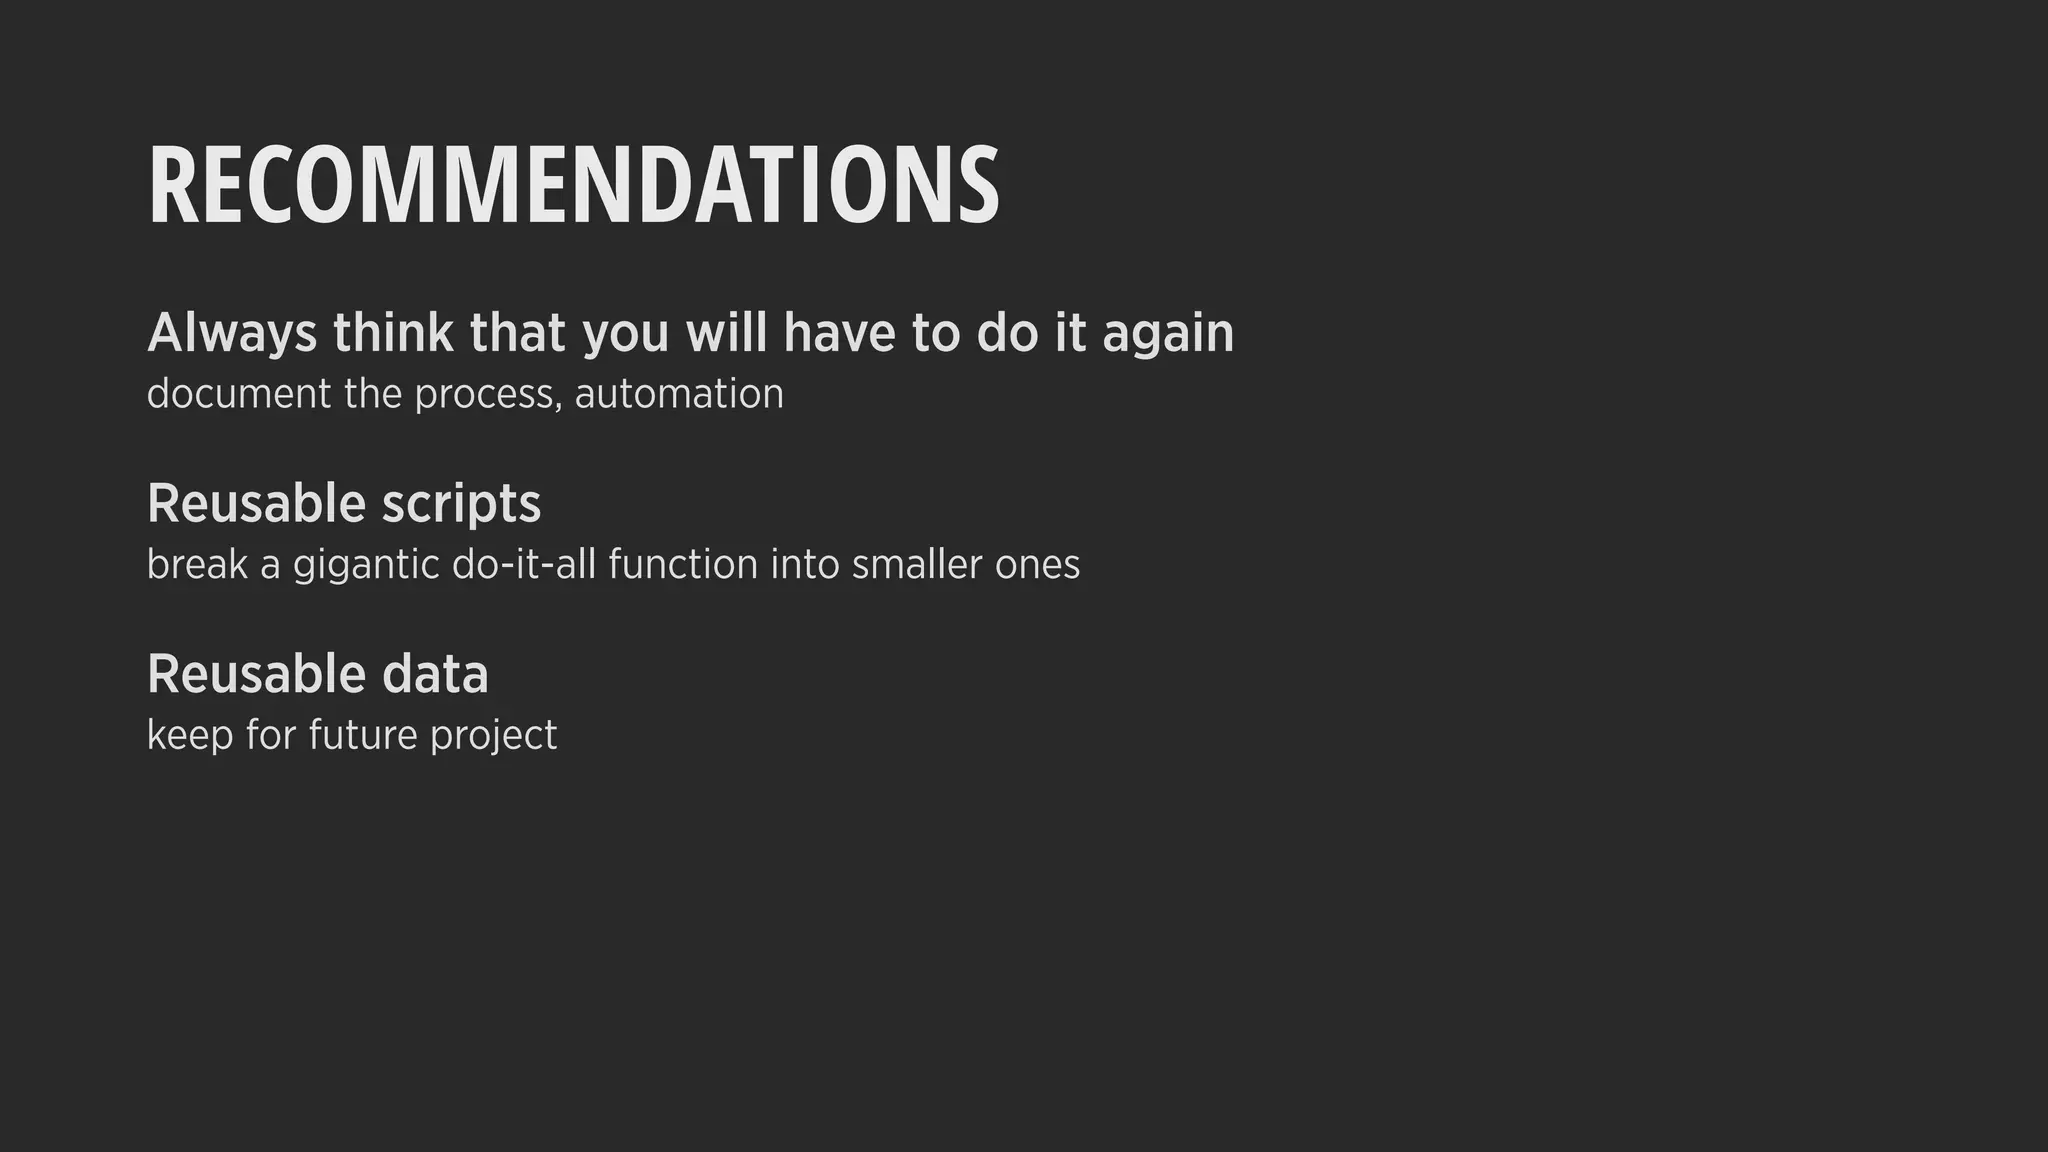
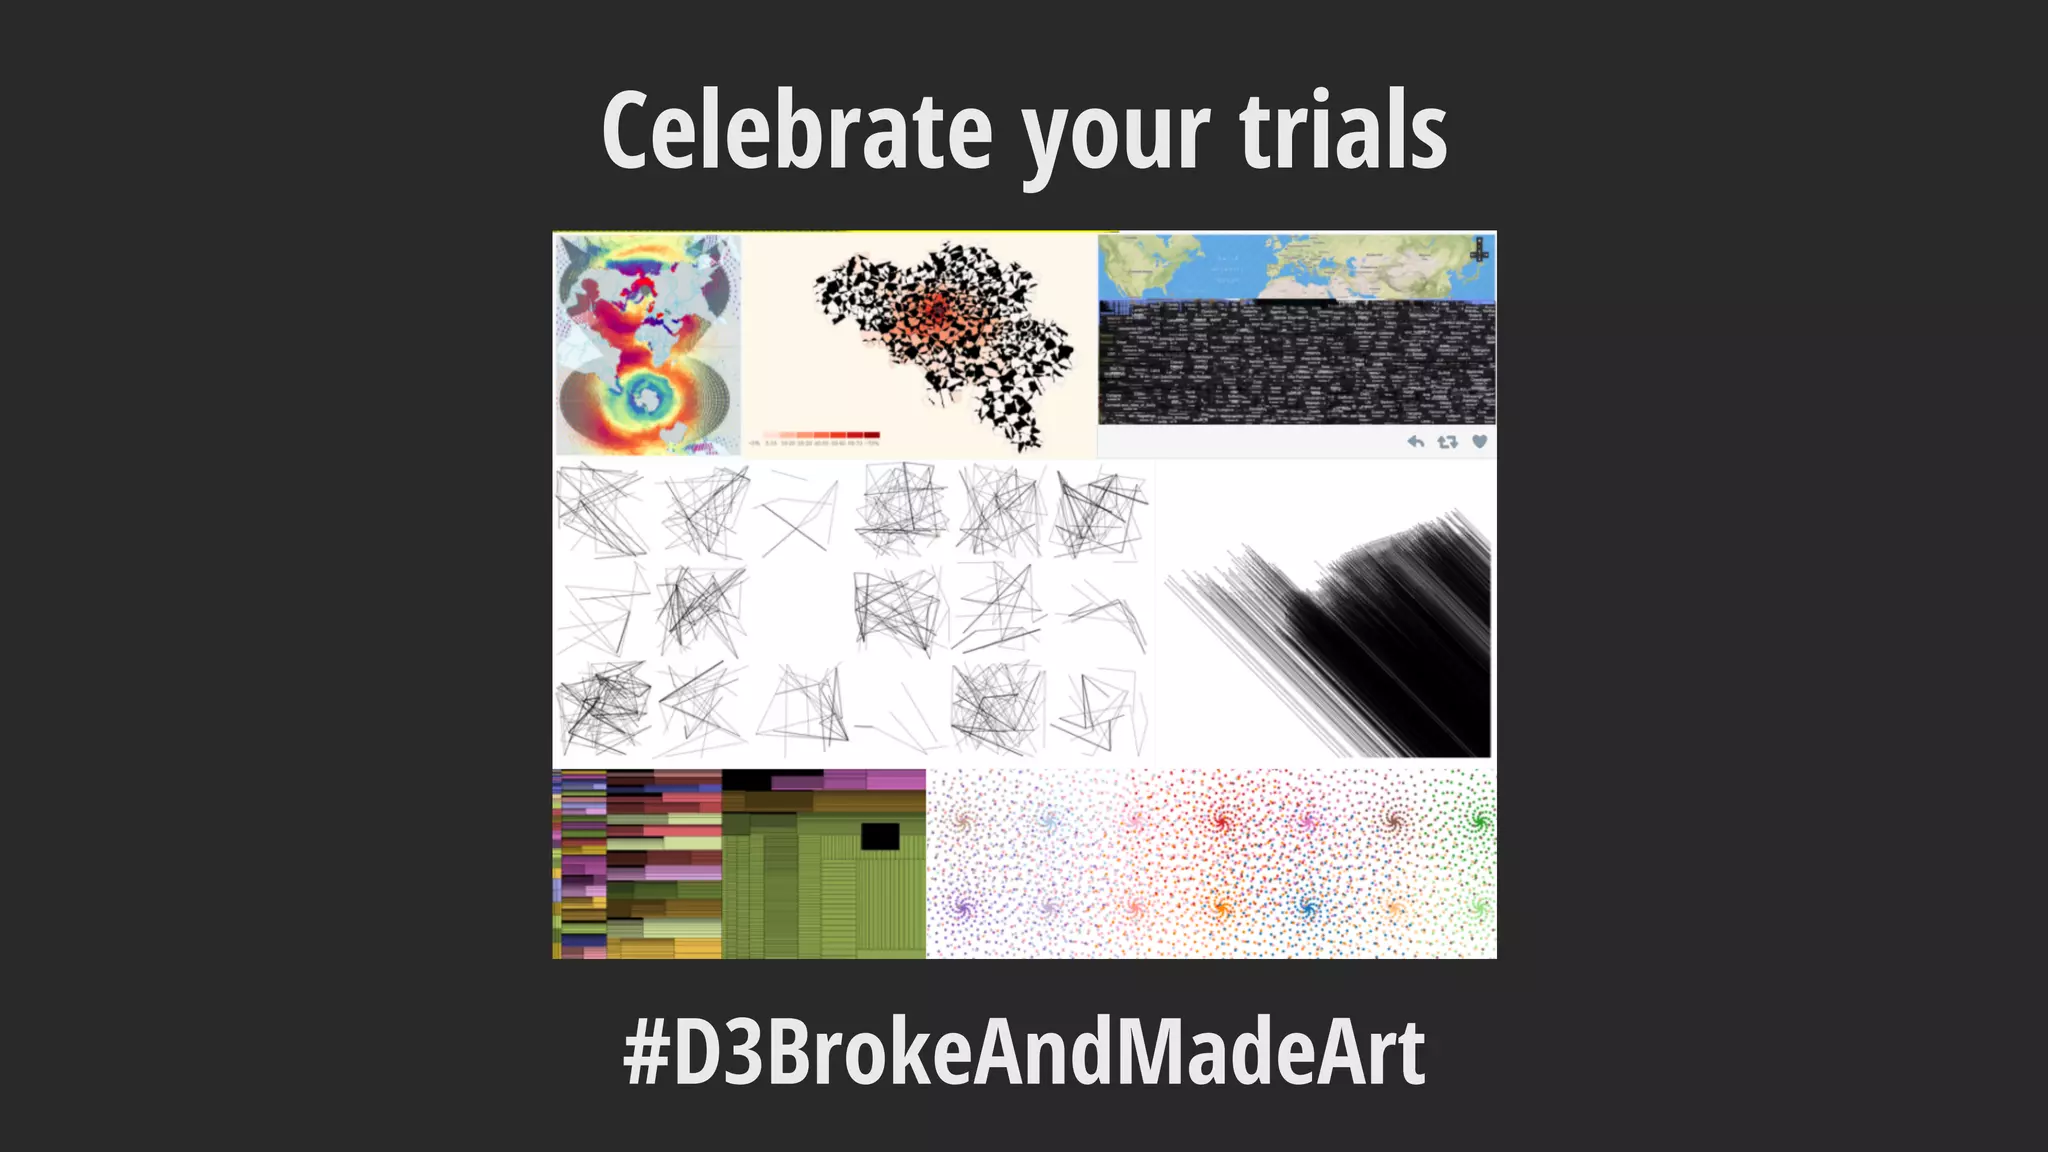
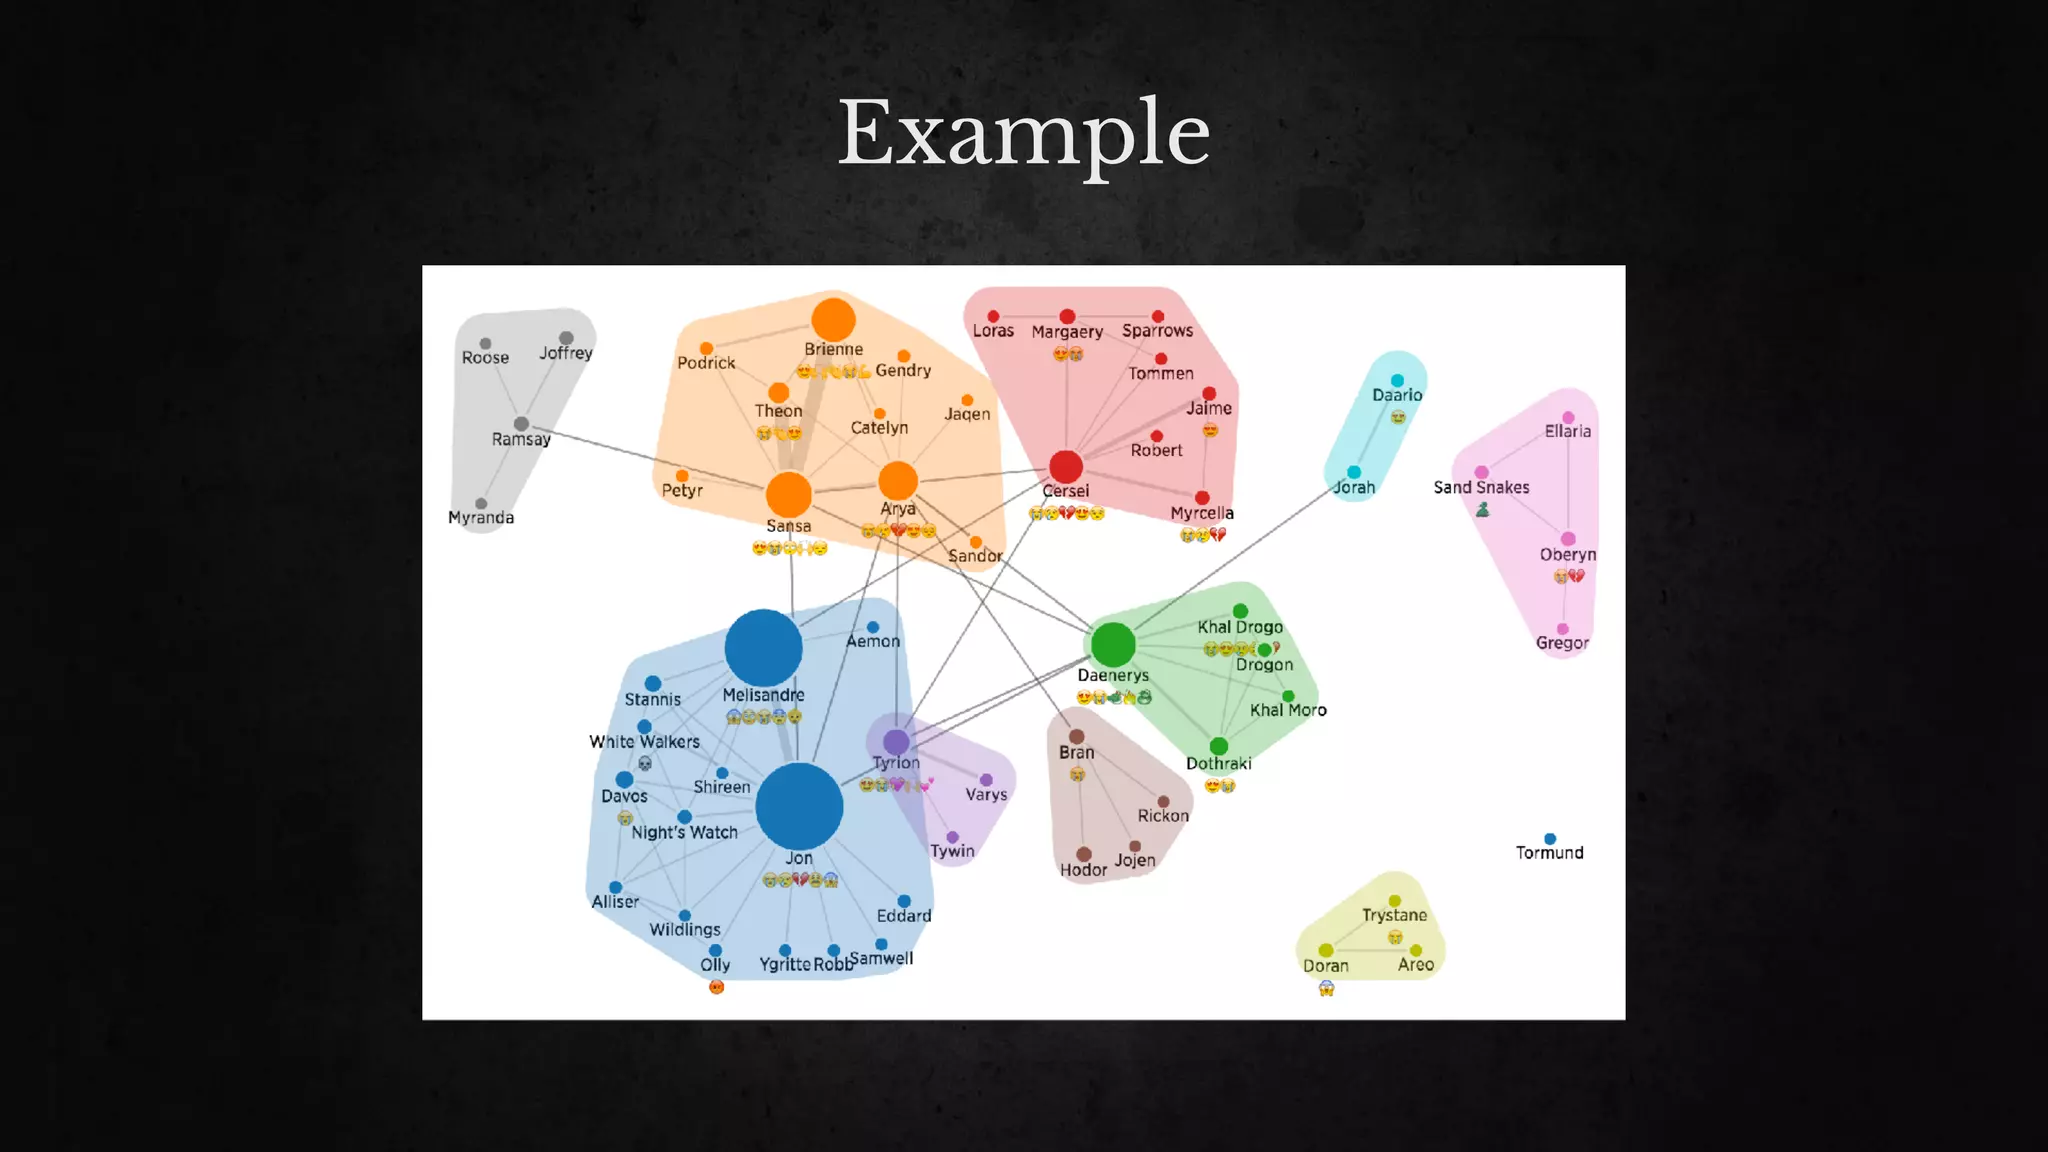
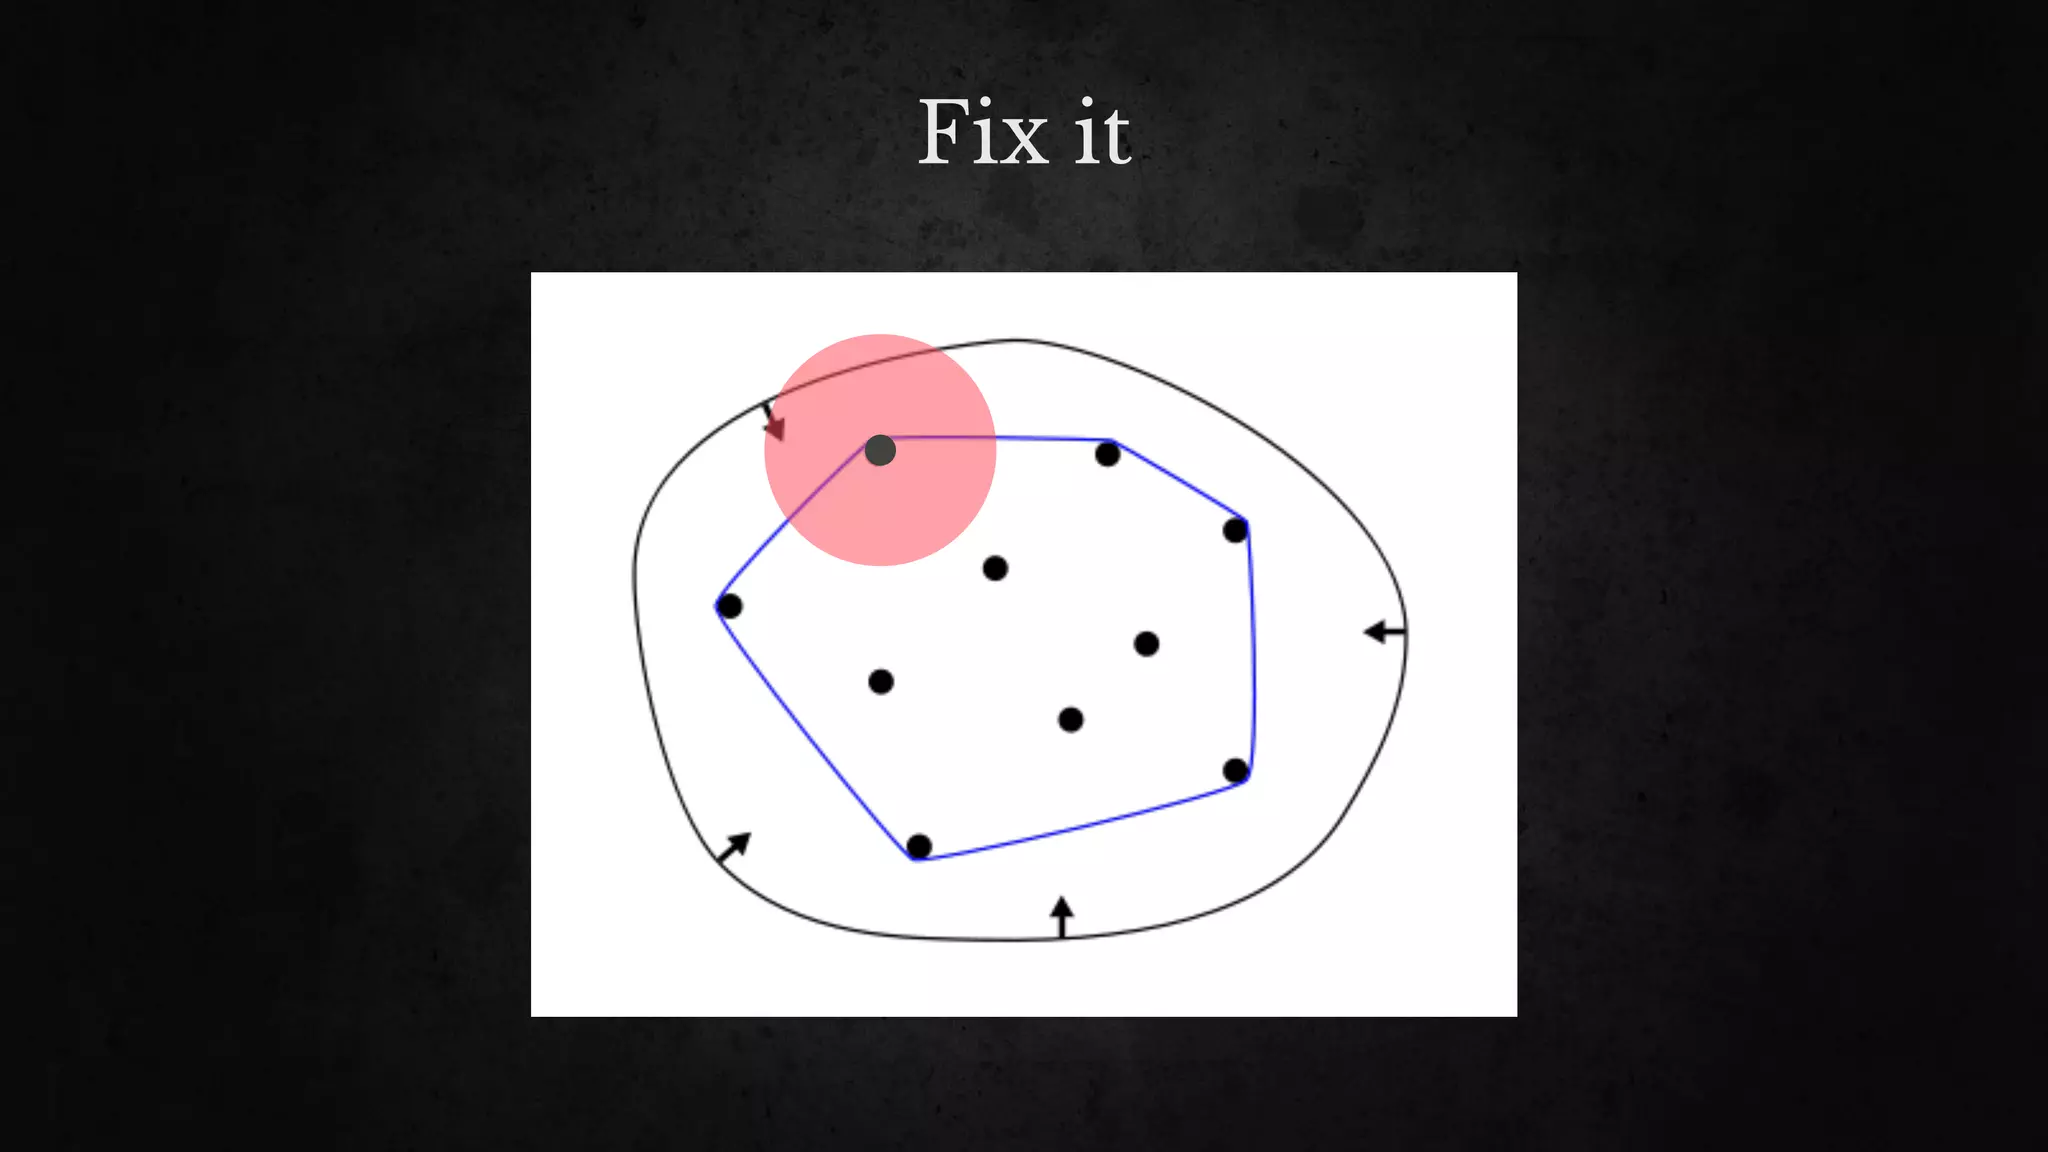
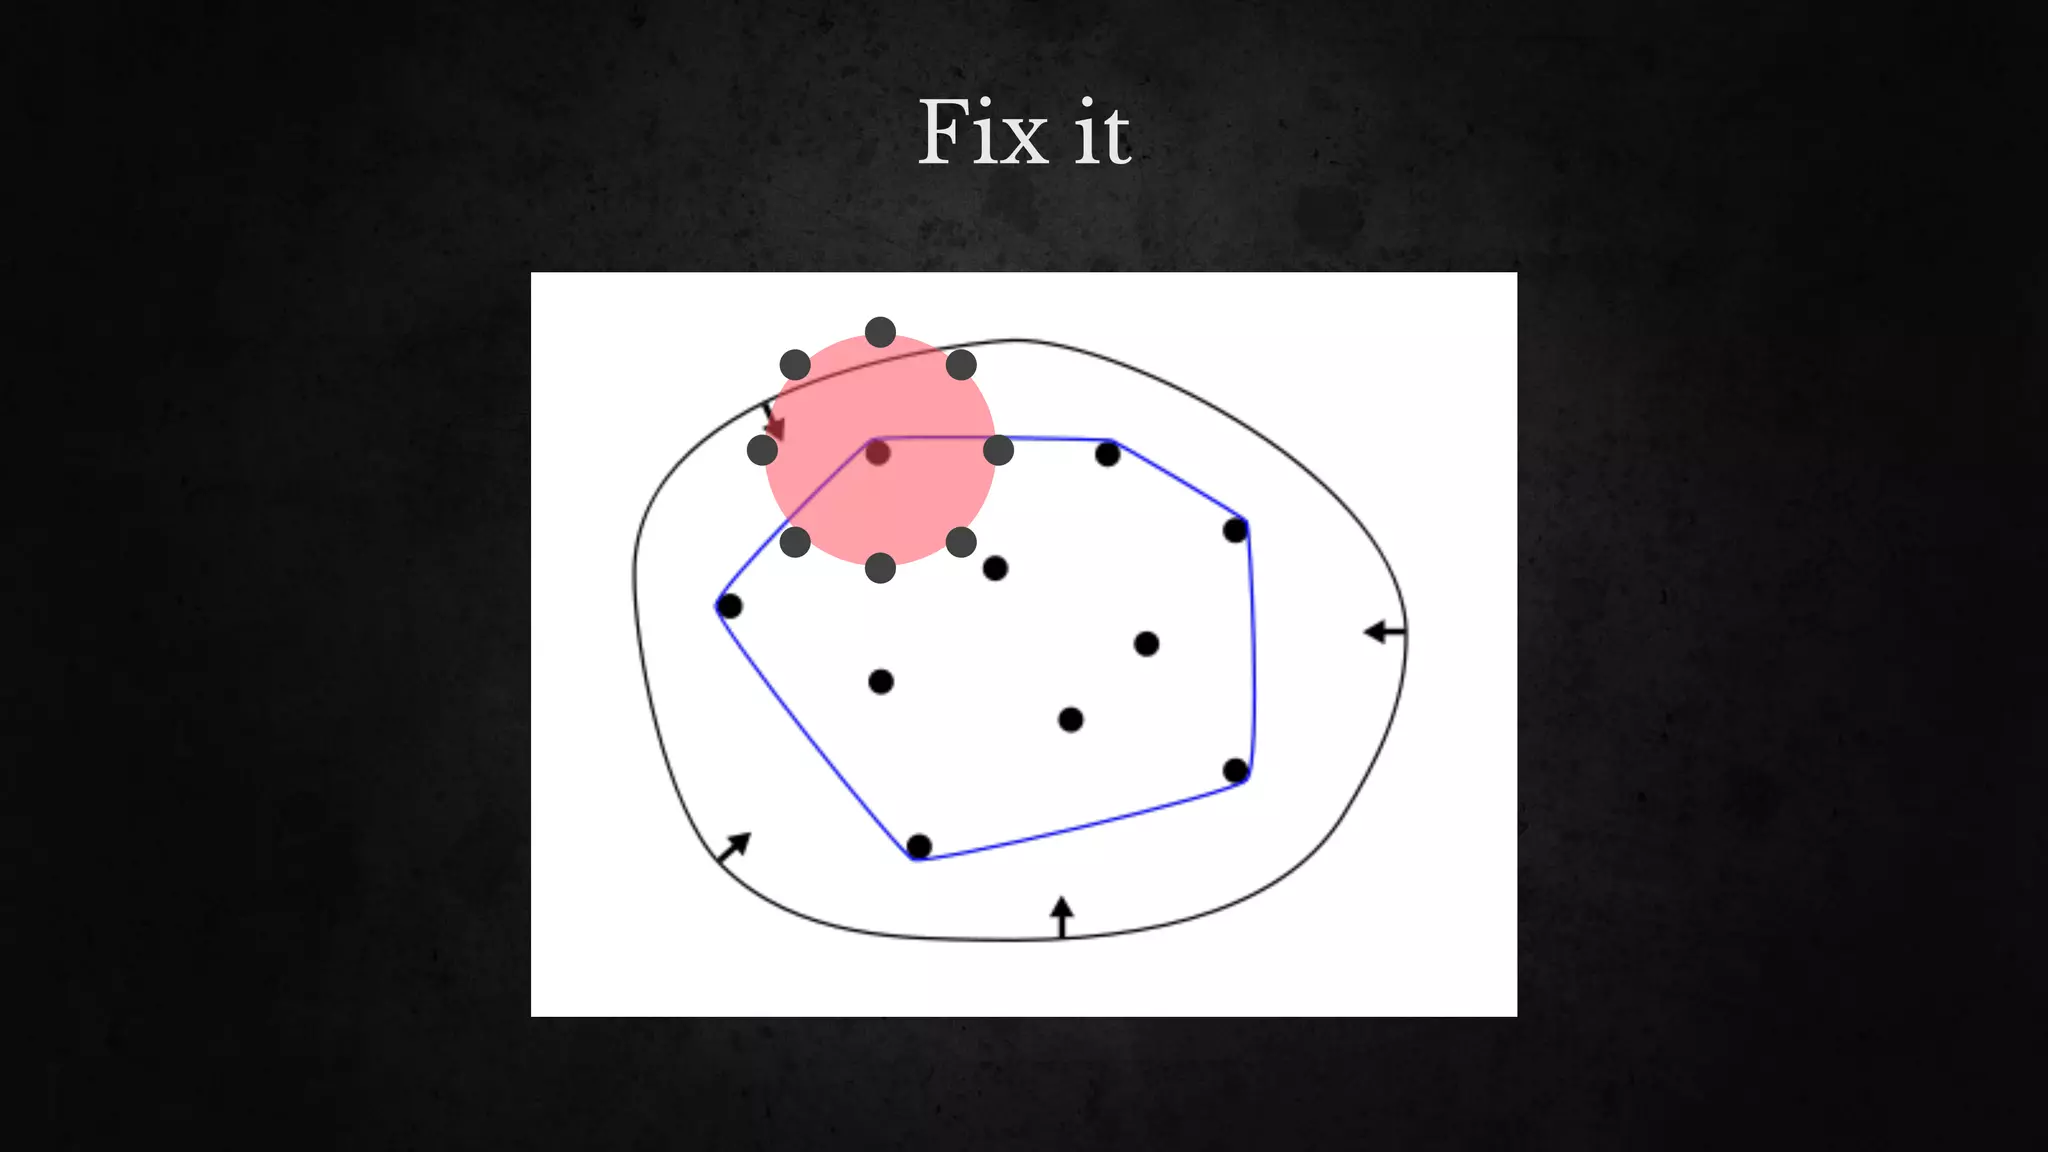
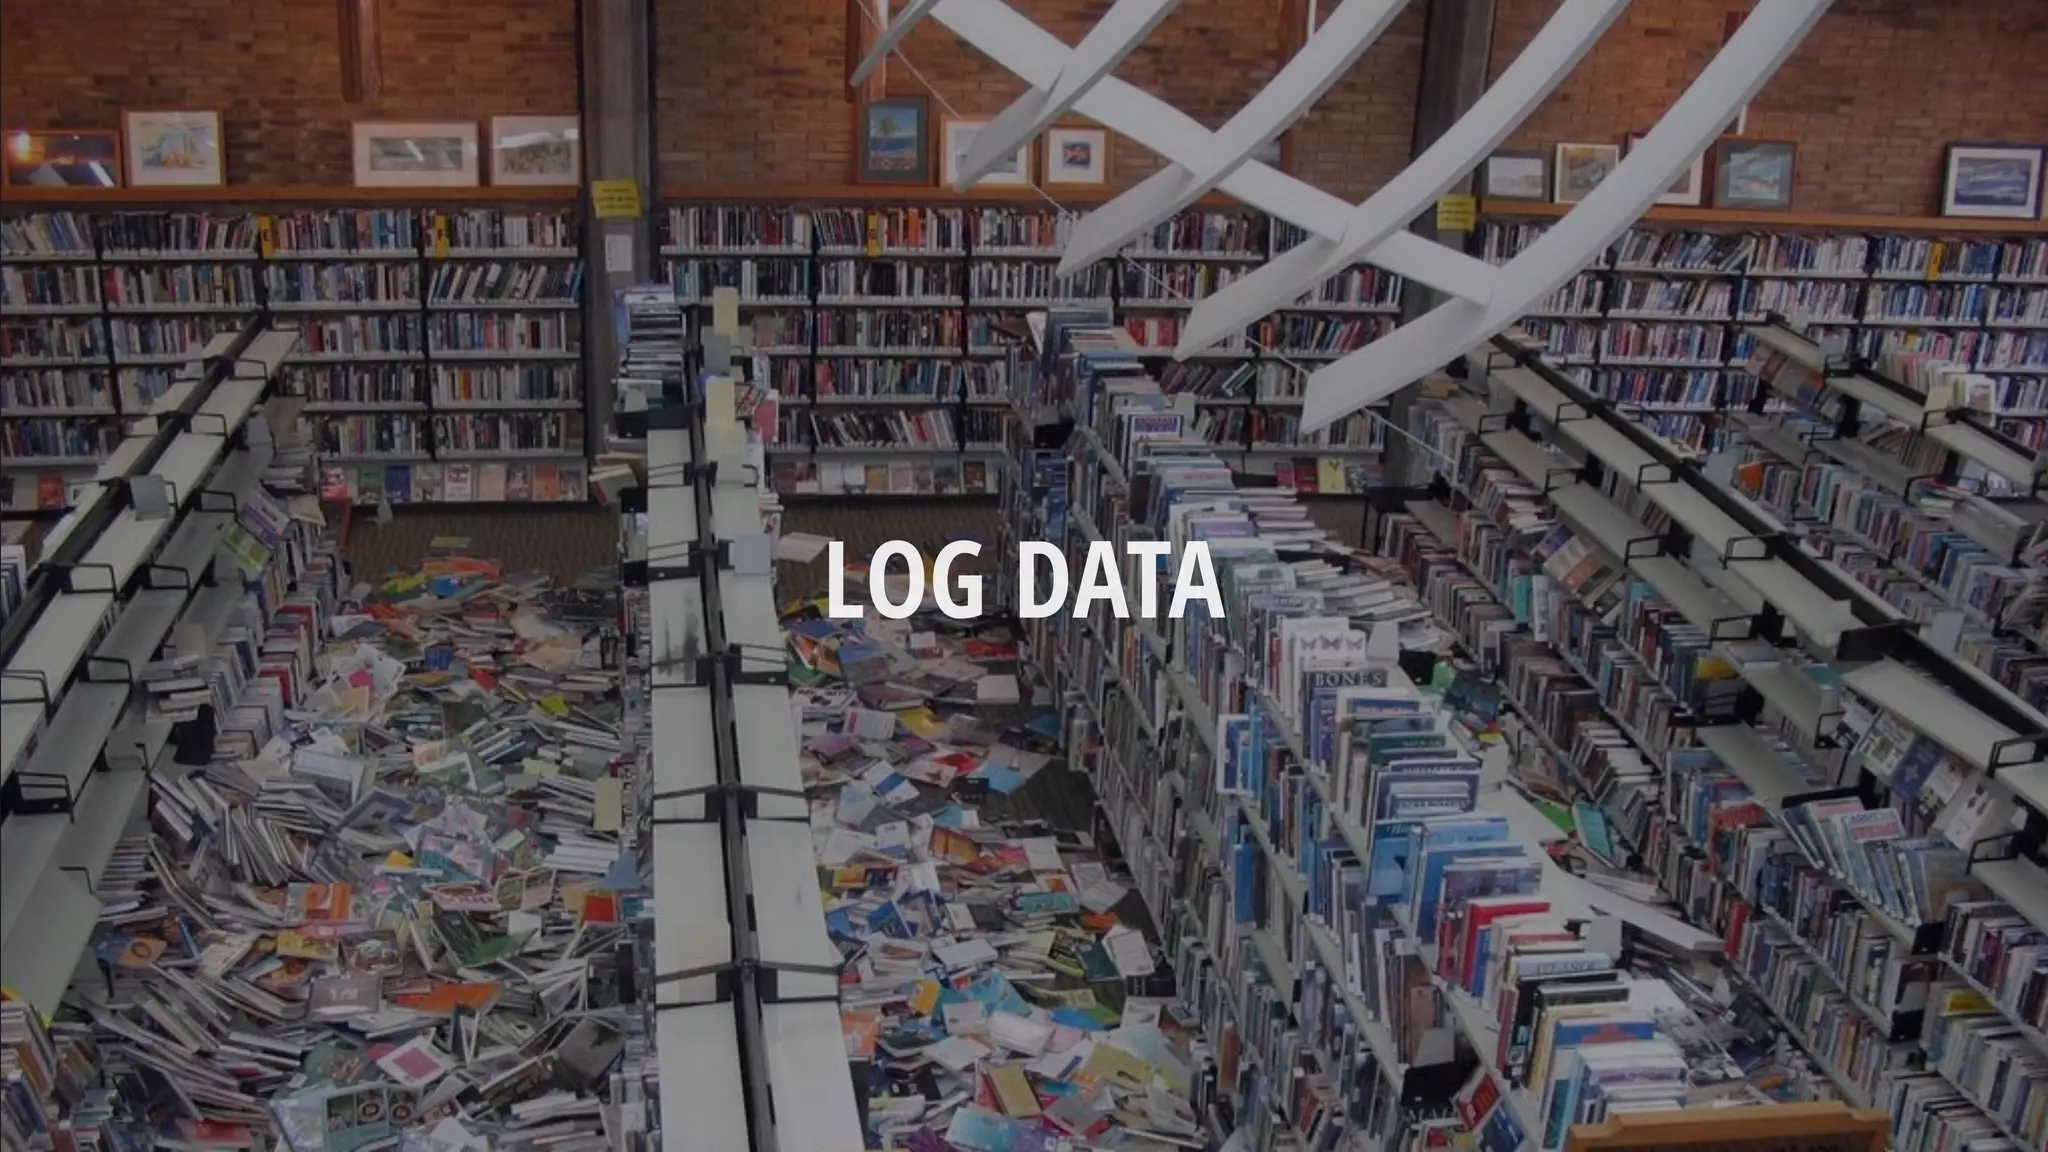
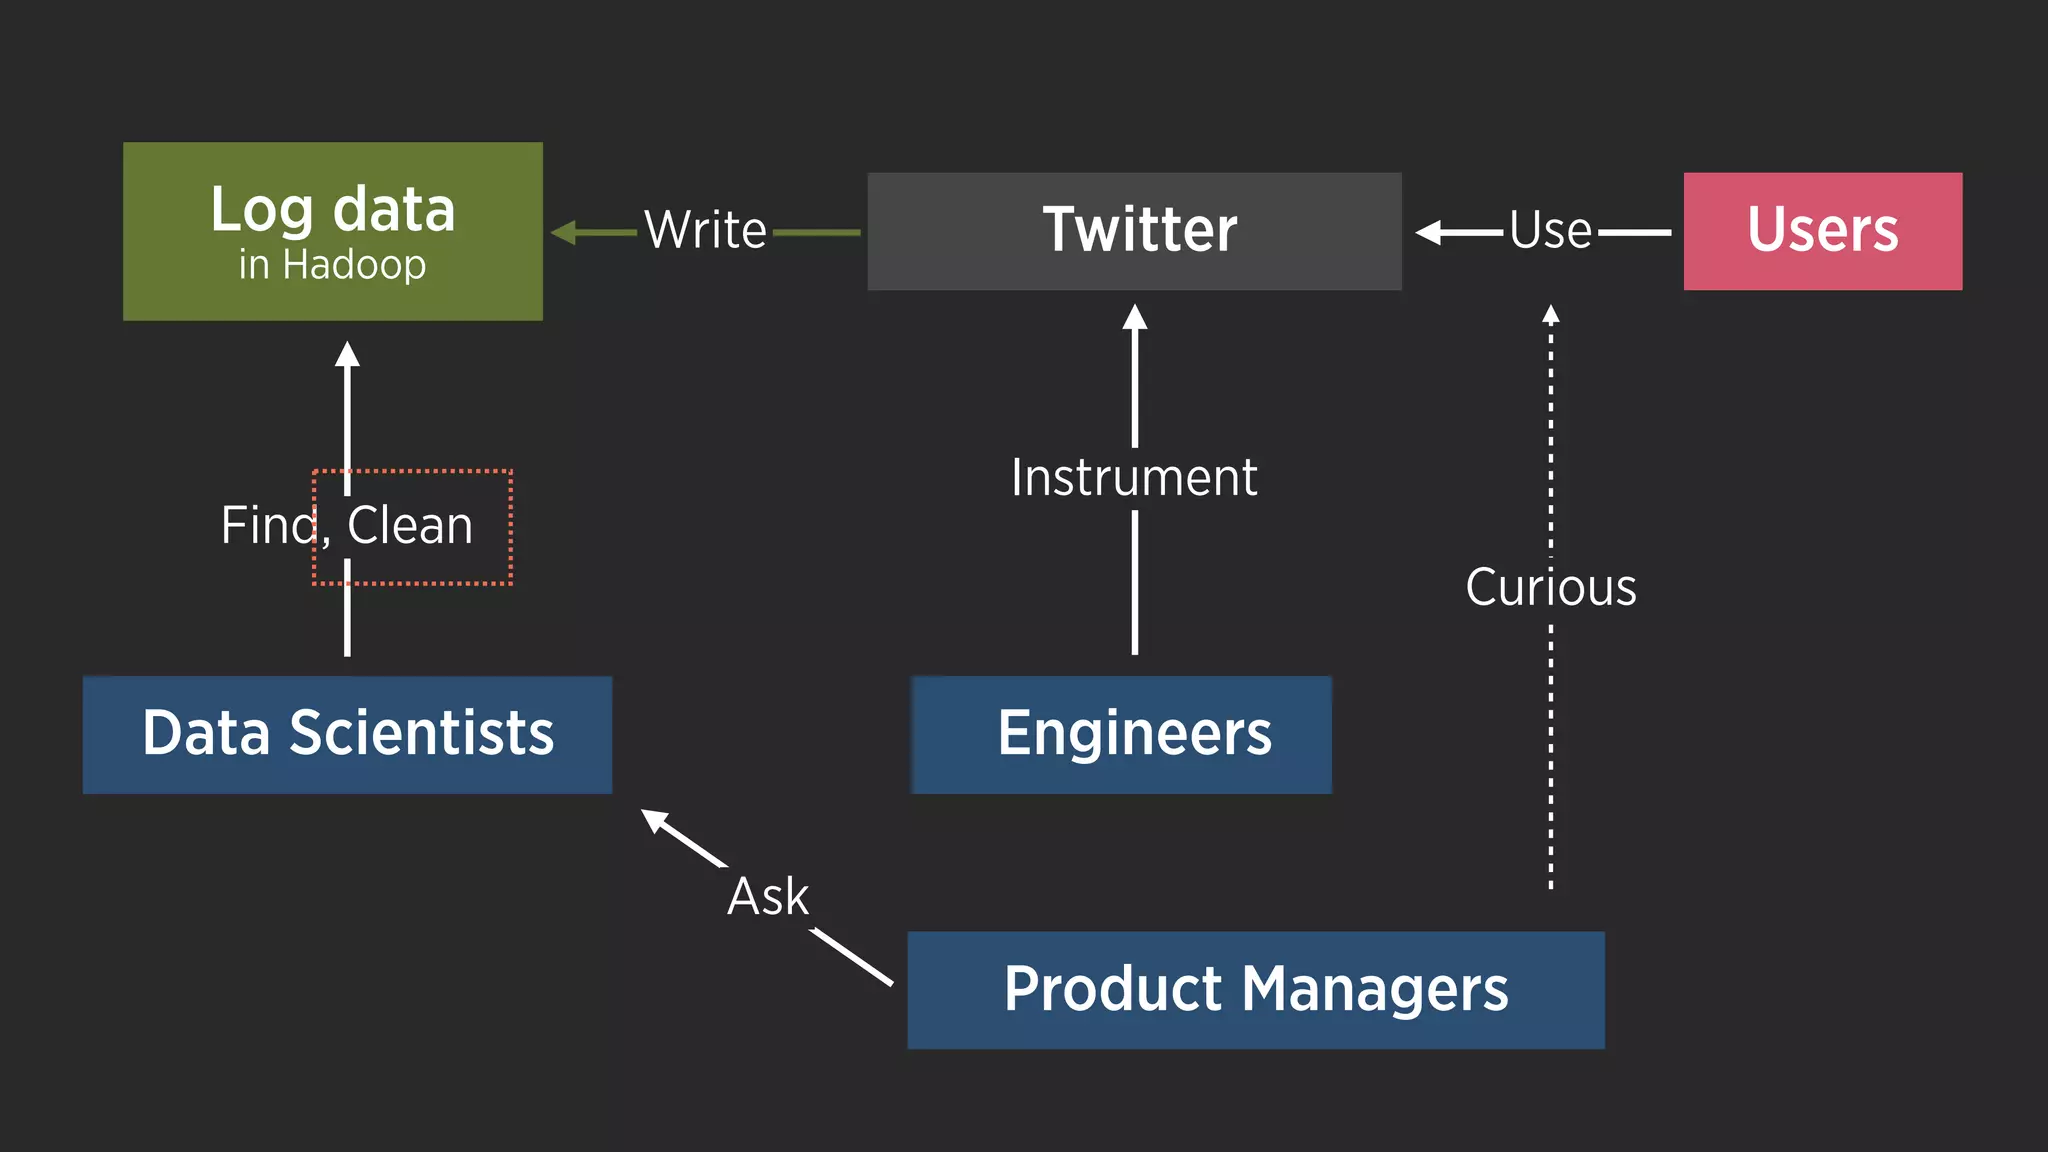
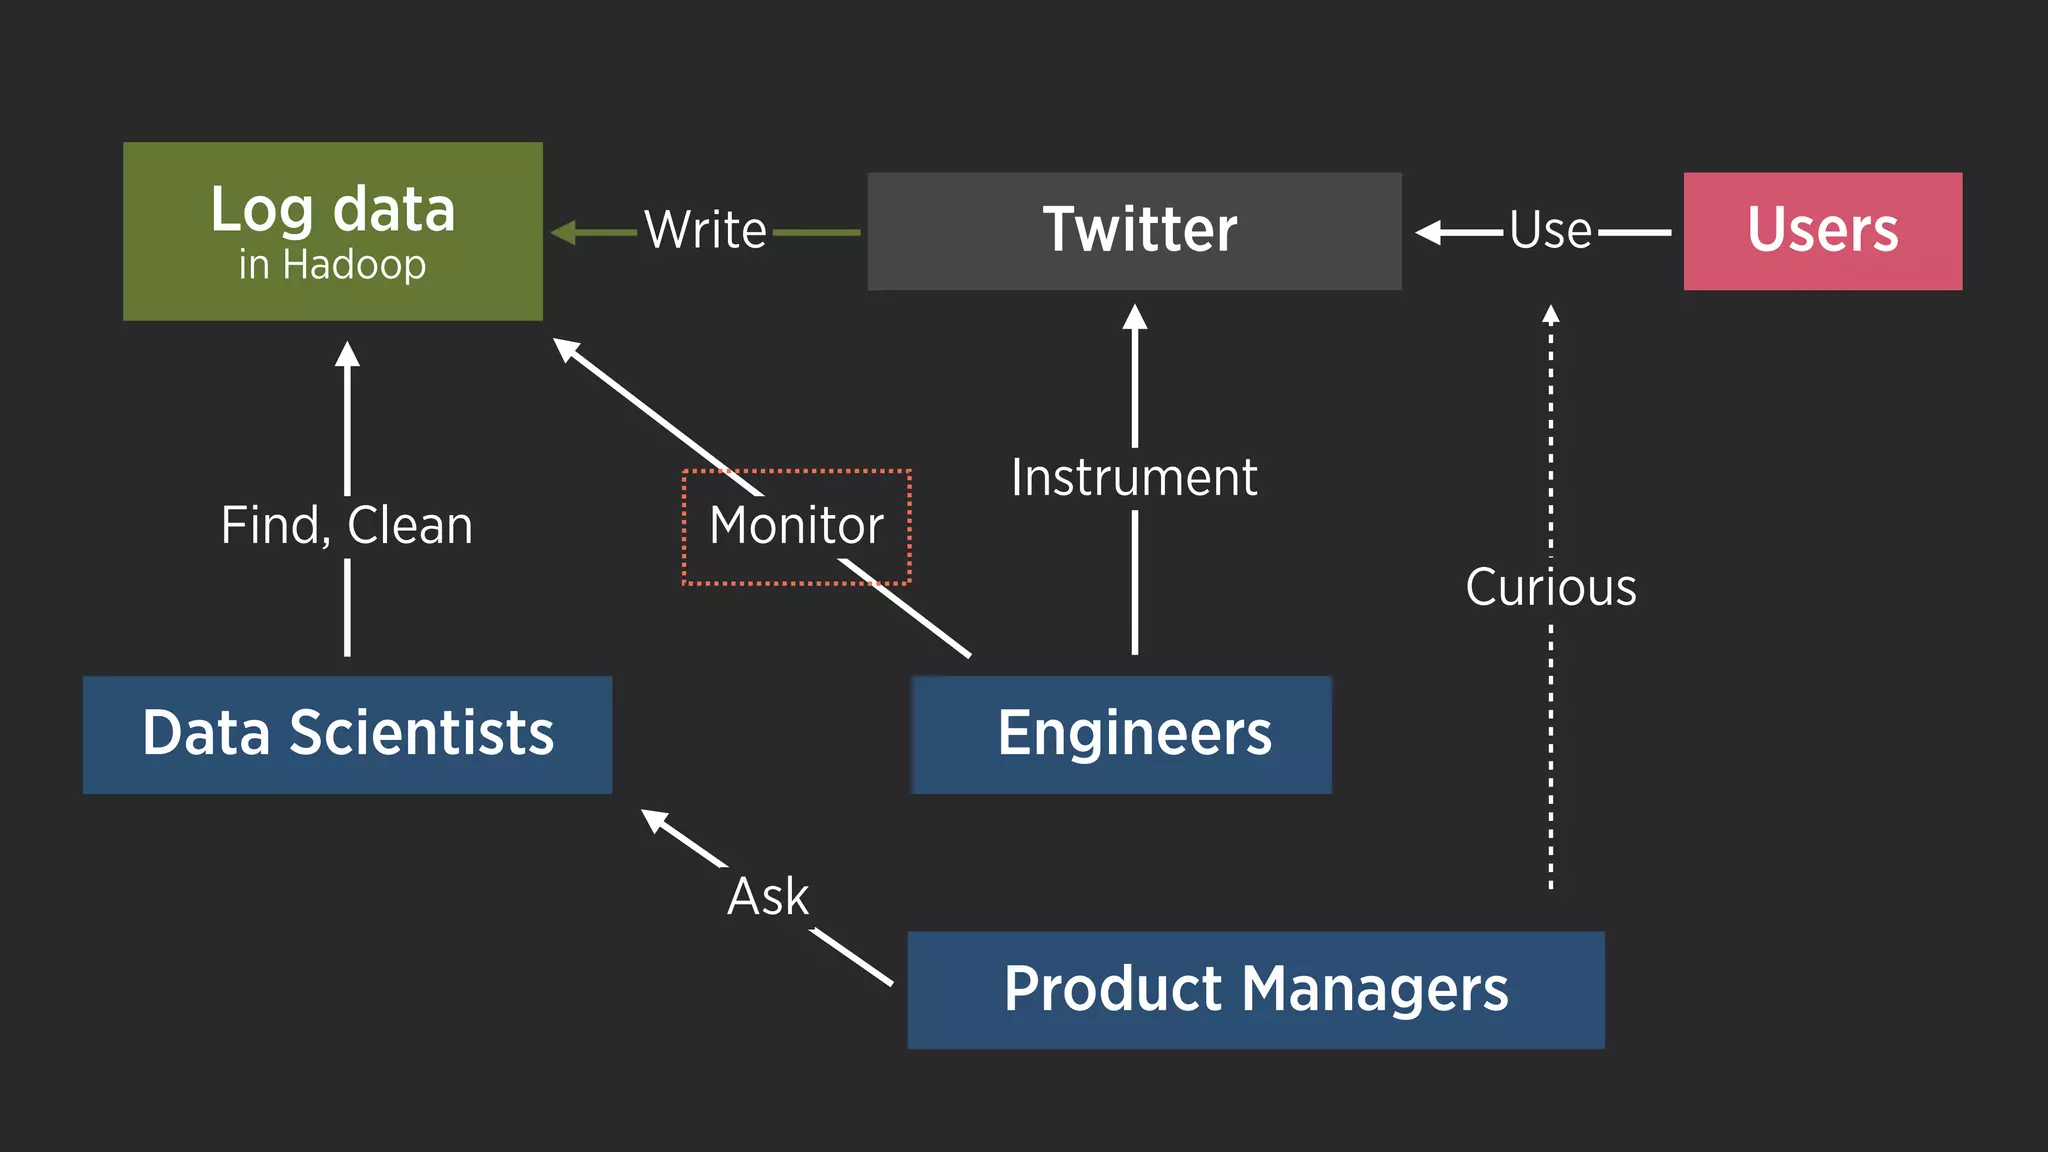
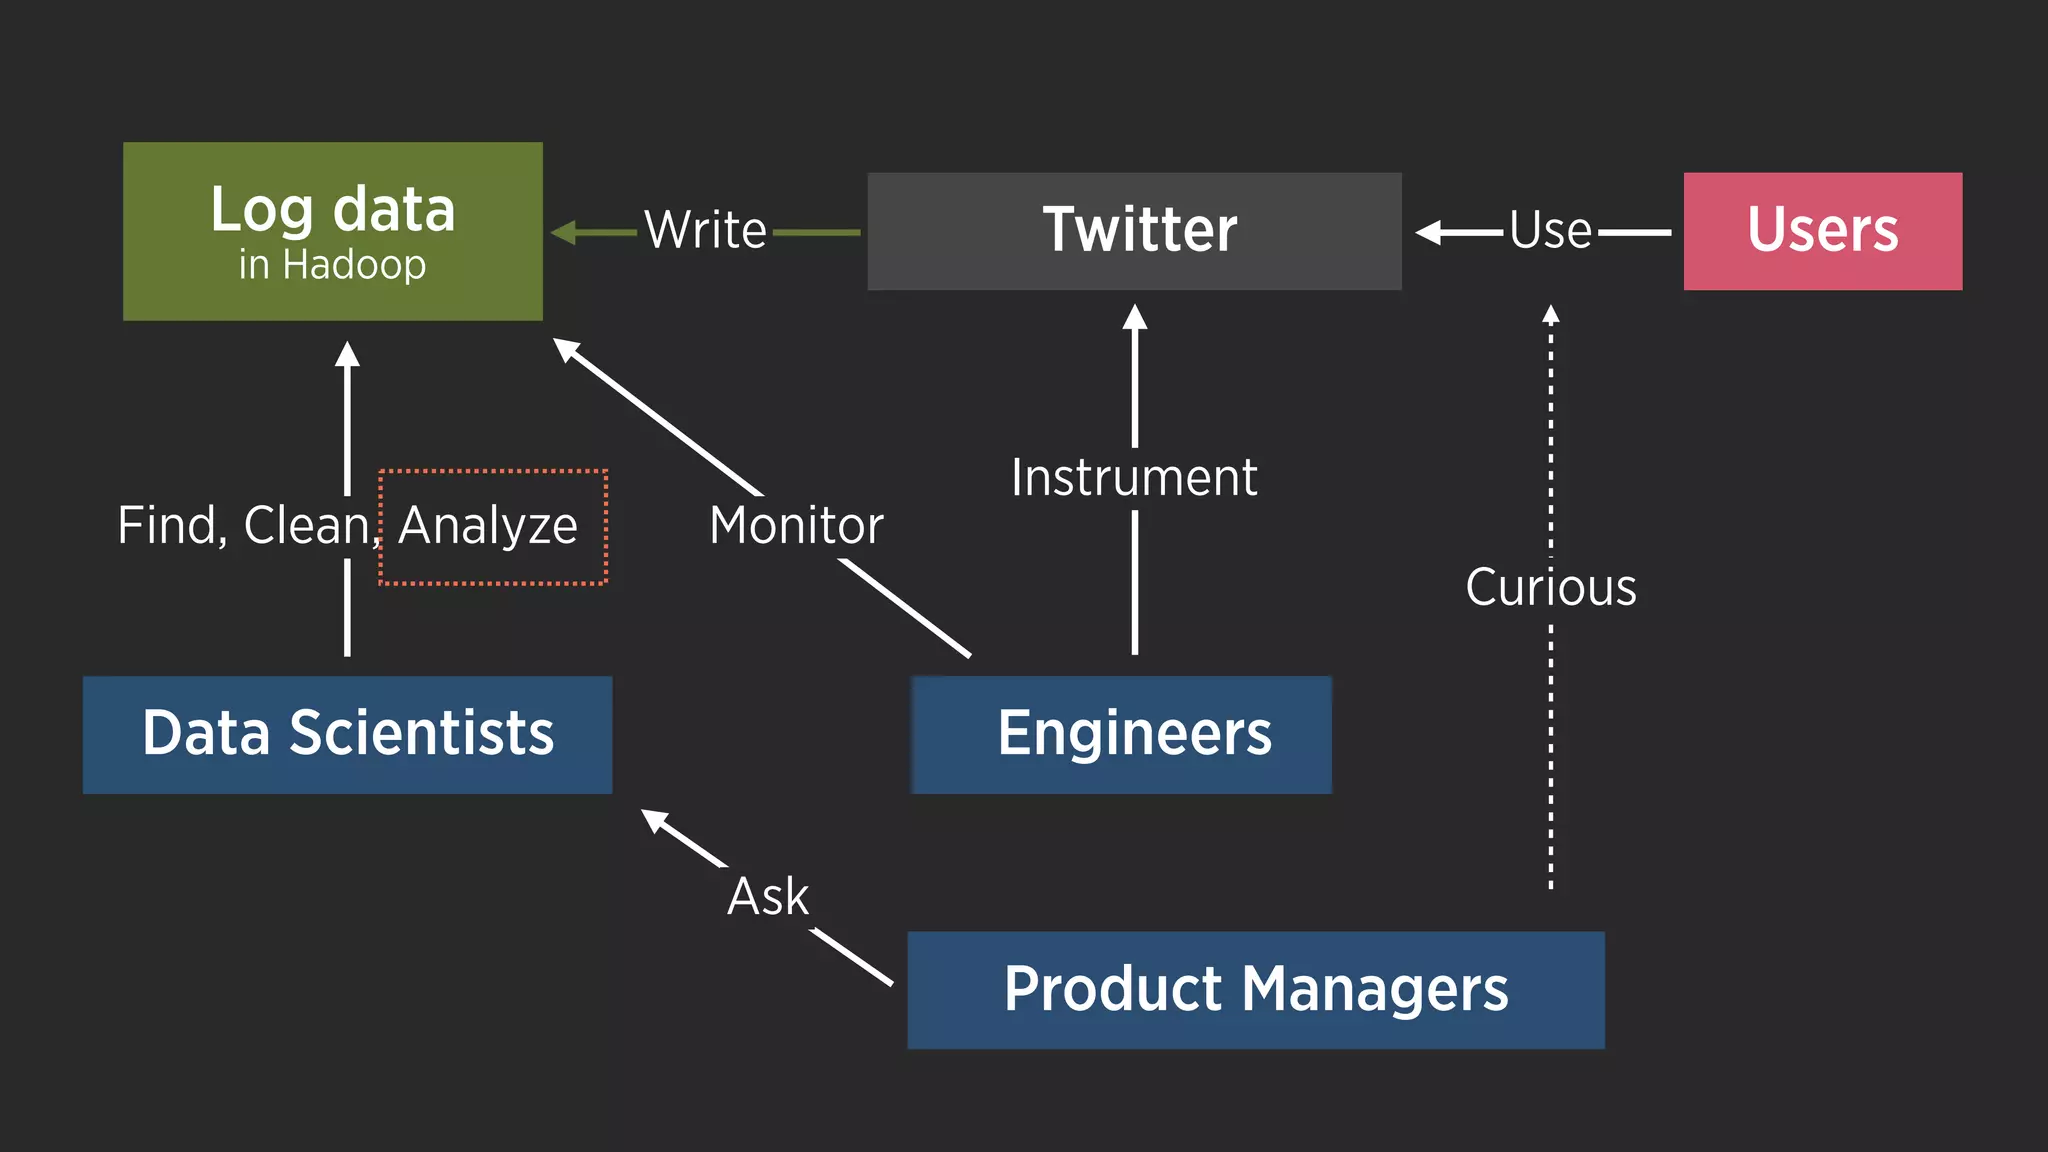
This document discusses expectations when visualizing data and creating visualizations. It covers 6 main points: 1. Expect to find the real need by understanding audience goals, questions, and intended use of the visualization. Compromise may be needed. 2. Expect to spend significant time (70-80%) cleaning data due to issues like multiple data sources and formats, missing values, and errors. 3. Expect trials and errors in the prototyping process to solve problems and meet deadlines. Iteration is important. 4. For larger datasets, expect challenges in processing, analyzing, and reducing size to find relevant insights. Tools like Hadoop can help handle bigger data. 5.


![[2C6]Everyplay_Big_Data](https://cdn.slidesharecdn.com/ss_thumbnails/2c6everyplaybigdata-140930020825-phpapp01-thumbnail.jpg?width=640&height=640&fit=bounds)


![[DSC Europe 25] Kaja Kandare - LLM as a judge.pptx](https://cdn.slidesharecdn.com/ss_thumbnails/arxyccaxsdsd1ba99wjw-7-251212104007-2b4e3f64-thumbnail.jpg?width=640&height=640&fit=bounds)
![[DSC Europe 25] Branko Dzakula - From Defense to Attack: How AI Redefines Cyb...](https://cdn.slidesharecdn.com/ss_thumbnails/80bdzdxpr3ky2g0qvyk9-8-251211083048-ce5fc1ee-thumbnail.jpg?width=640&height=640&fit=bounds)


![[DSC Europe 25] Jovan Bogicevic - Legacy to AI-Driven Defense: Transforming D...](https://cdn.slidesharecdn.com/ss_thumbnails/rsarluadt563hntyfc8q-3-251211083849-3e7bc4c0-thumbnail.jpg?width=640&height=640&fit=bounds)


![[DSC Europe 25] Branko Urosevic -Rethinking Financial Talent: Integrating Cod...](https://cdn.slidesharecdn.com/ss_thumbnails/8jjrus8ttko6qj64f58f-3-251212103250-642c6374-thumbnail.jpg?width=640&height=640&fit=bounds)
![[DSC Europe 25] Jon Dajci - Bridging TradFi and DeFi: Building the Future of ...](https://cdn.slidesharecdn.com/ss_thumbnails/fqmhfvlbqhkihjvqvhmu-7-251211083849-6af7e325-thumbnail.jpg?width=640&height=640&fit=bounds)

![[DSC Europe 25] Hans Kleinsman - The Compliance Gearbox: How Tax Tech Mediate...](https://cdn.slidesharecdn.com/ss_thumbnails/dxdytie1toel0hr90bjs-2-251212103250-174fdbe7-thumbnail.jpg?width=640&height=640&fit=bounds)

![[DSC Europe 25] Dusan Nesic - Securing Tomorrow’s Infrastructure: Why Cyber-P...](https://cdn.slidesharecdn.com/ss_thumbnails/qikbszfftyowjm2q6duw-1-251211083848-8f2ead6b-thumbnail.jpg?width=640&height=640&fit=bounds)
