Downloaded 56 times


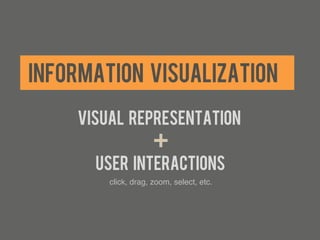
![INFORMATION VISUALIZATION
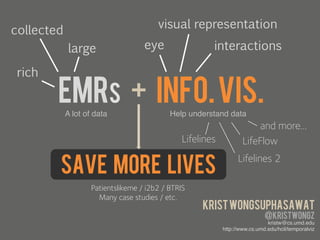
INFO. VIS.
“ Using visual representations and interaction techniques,
which take advantage of the human eye’s
broad bandwidth pathway into the mind,
to allow users to see, explore, and understand
large amounts of information at once.”
[Wikipedia]!](https://image.slidesharecdn.com/infovisforhealthcare22-111127221133-phpapp02/85/Information-Visualization-for-Health-Care-4-320.jpg)
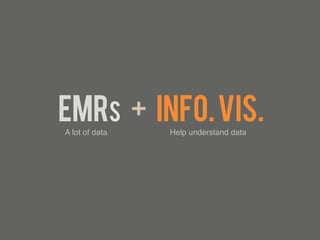
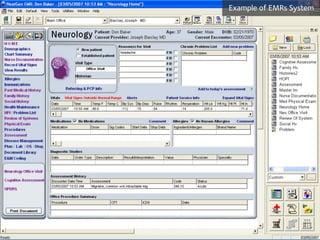
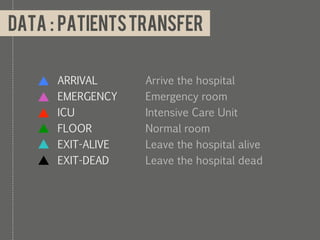
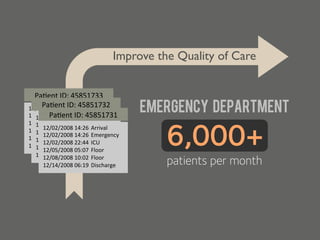
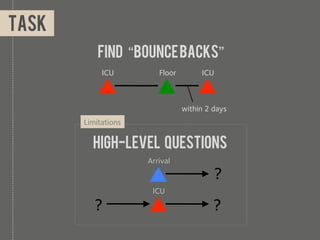
![Healthcare
Electronic medical records (EMRs)
“ To improve the quality of our health care while lowering its cost,
we will make the immediate investments necessary to ensure that,
within five years, all of America's medical records are computerized.
This will cut waste, eliminate red tape and reduce the need
to repeat expensive medical tests.
But it just won't save billions of dollars and thousands of jobs;
it will save lives by reducing the deadly but preventable medical errors
that pervade our health-care system.”
[President Barack Obama – Jan 2009]!](https://image.slidesharecdn.com/infovisforhealthcare22-111127221133-phpapp02/85/Information-Visualization-for-Health-Care-9-320.jpg)
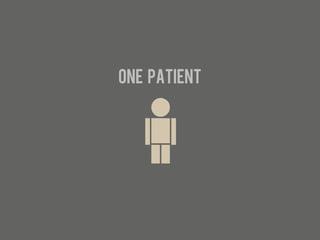
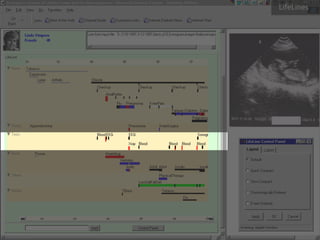
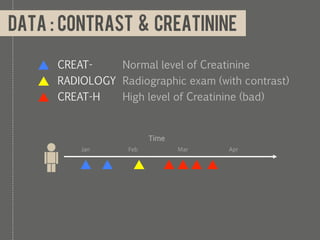
![Lifelines
One patient
x
[Plaisant et al. 1998]!
http://www.cs.umd.edu/hcil/lifelines!](https://image.slidesharecdn.com/infovisforhealthcare22-111127221133-phpapp02/85/Information-Visualization-for-Health-Care-13-320.jpg)
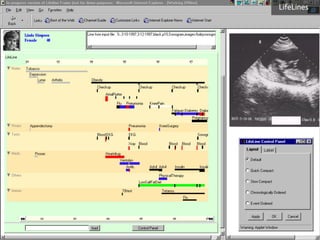
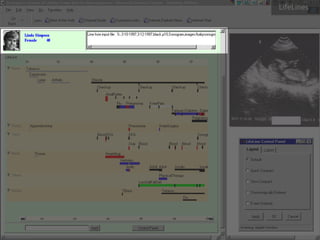
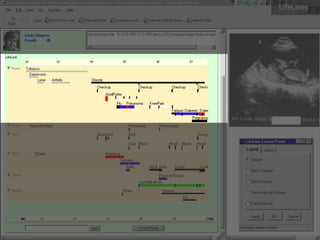
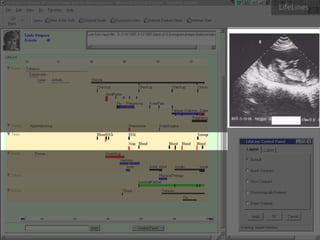
![Lifelines
One patient
Demographic
- Gender
- Age
- …
x
[Plaisant et al. 1998]!
Medical Events*
- Emergency room on Jan 15
- Surgery on Oct 1
- …
http://www.cs.umd.edu/hcil/lifelines!](https://image.slidesharecdn.com/infovisforhealthcare22-111127221133-phpapp02/85/Information-Visualization-for-Health-Care-20-320.jpg)
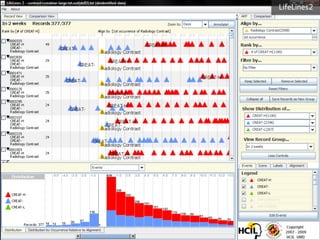
![Lifelines 2
Multiple patients
xxxxx
[Wang et al. 2008, 2009]!
http://www.cs.umd.edu/hcil/lifelines2!](https://image.slidesharecdn.com/infovisforhealthcare22-111127221133-phpapp02/85/Information-Visualization-for-Health-Care-21-320.jpg)
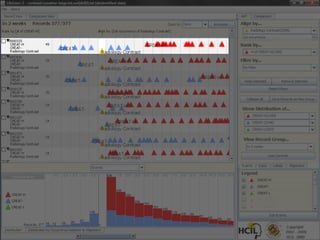

![Lifelines 2
Multiple patients
xxxxx
[Wang et al. 2008, 2009]!
http://www.cs.umd.edu/hcil/lifelines2!](https://image.slidesharecdn.com/infovisforhealthcare22-111127221133-phpapp02/85/Information-Visualization-for-Health-Care-28-320.jpg)
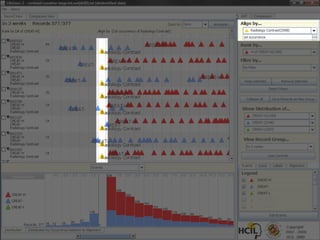
![Lifelines 2
search from medical events
xxxxx [Wang et al. 2008, 2009]!
http://www.cs.umd.edu/hcil/lifelines2!](https://image.slidesharecdn.com/infovisforhealthcare22-111127221133-phpapp02/85/Information-Visualization-for-Health-Care-29-320.jpg)
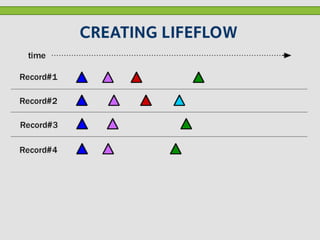
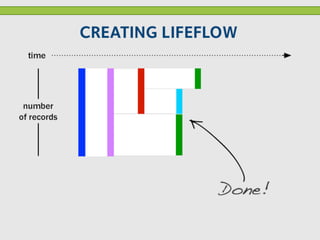
![LifeFlow
overview
xx
x x
xx x
x x xx
[Wongsuphasawat et al. 2011]!
http://www.cs.umd.edu/hcil/lifeflow!](https://image.slidesharecdn.com/infovisforhealthcare22-111127221133-phpapp02/85/Information-Visualization-for-Health-Care-34-320.jpg)


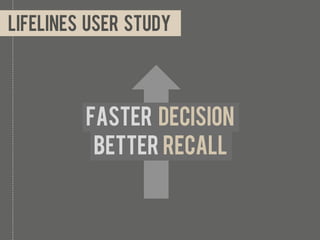
This document discusses using information visualization techniques in healthcare, specifically for electronic medical records (EMRs). It provides examples of systems like Lifelines and LifeFlow that visualize patient data longitudinally over time in 1-3 sentences to help clinicians understand large amounts of patient data and identify patterns. Visualizations of EMR data can help improve healthcare quality by enabling faster decision making and better recall of patient information.


