Download as PDF, PPTX


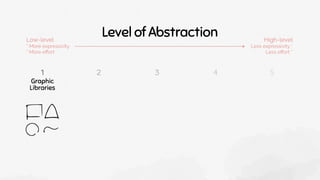
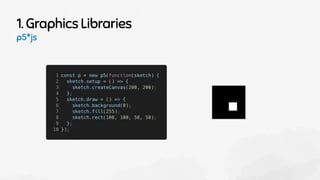
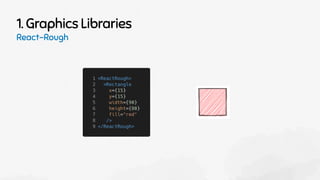
![1. Graphics Libraries
Processing, p5*js, Three.js, Two.js, Rough.js, …
• Graphics operations
• e.g., draw, shading
• Very high expressivity
• Very high effort
• Does not know about data
[https://codesandbox.io/embed/r3f-gamma-correction-kmb9i]](https://image.slidesharecdn.com/navigatevislibforshare-210205032044/85/Navigating-the-Wide-World-of-Data-Visualization-Libraries-20-320.jpg)


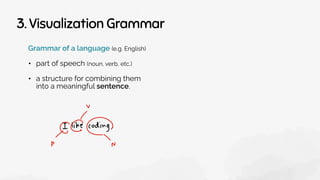
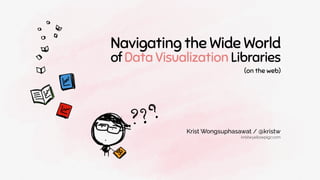
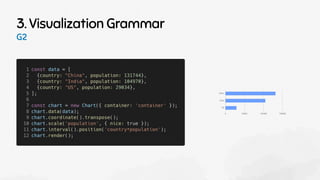
![3. Visualization Grammar
Grammar of a language (e.g. English)
• part of speech (noun, verb, etc.)
• a structure for combining them
into a meaningful sentence.
The Grammar of Graphics [Wilkinson]
• part of charts
• a structure for combining them
to describe an output graphics.](https://image.slidesharecdn.com/navigatevislibforshare-210205032044/85/Navigating-the-Wide-World-of-Data-Visualization-Libraries-33-320.jpg)
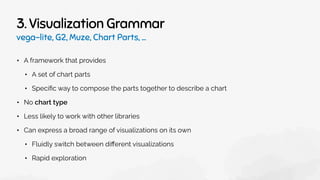
![3. Visualization Grammar
[Leland Wilkinson. “The Grammar of Graphics” p. 7]](https://image.slidesharecdn.com/navigatevislibforshare-210205032044/85/Navigating-the-Wide-World-of-Data-Visualization-Libraries-34-320.jpg)
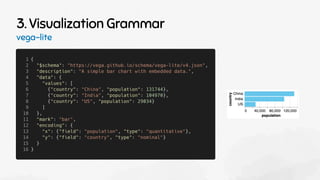
![3. Visualization Grammar
[Leland Wilkinson. “The Grammar of Graphics” p. 191]](https://image.slidesharecdn.com/navigatevislibforshare-210205032044/85/Navigating-the-Wide-World-of-Data-Visualization-Libraries-35-320.jpg)
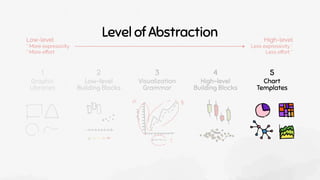
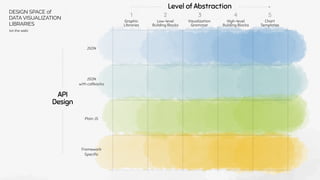
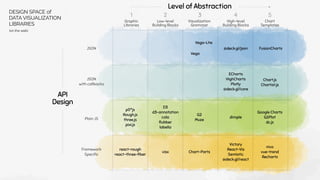

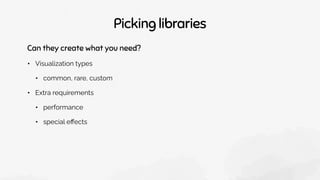
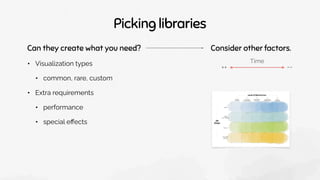
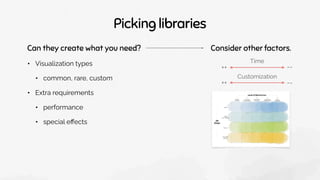
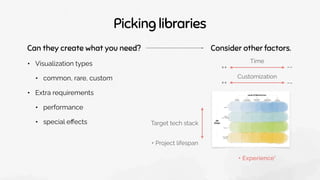

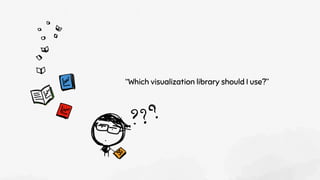
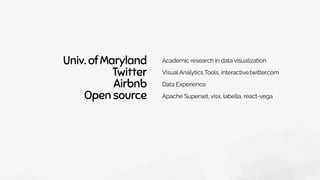
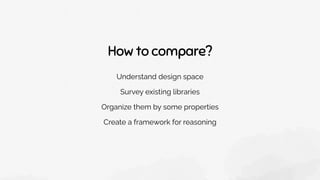
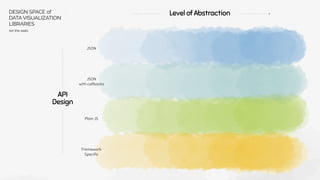
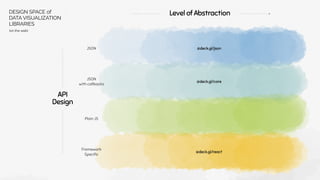
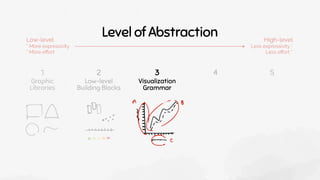
![What visualization library should I use?
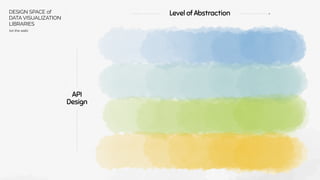
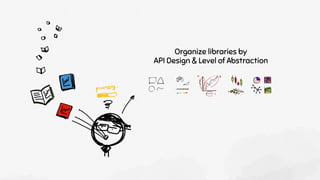
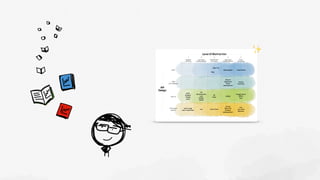
Organize by API design & Level of Abstraction
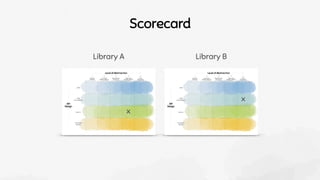
Scorecard & Guidelines
[medium.com/nightingale/navigating-the-wide-world-of-web-based-data-visualization-libraries-798ea9f536e7]
kristw.yellowpigz.com
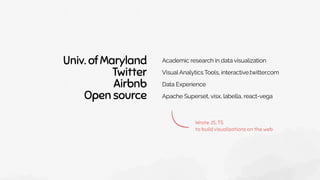
Krist Wongsuphasawat / @kristw
Navigating the Wide World
of Data Visualization Libraries
(on the web)](https://image.slidesharecdn.com/navigatevislibforshare-210205032044/85/Navigating-the-Wide-World-of-Data-Visualization-Libraries-69-320.jpg)

![What visualization library should I use?
Organize by API design & Level of Abstraction
Scorecard & Guidelines
[medium.com/nightingale/navigating-the-wide-world-of-web-based-data-visualization-libraries-798ea9f536e7]
kristw.yellowpigz.com
Krist Wongsuphasawat / @kristw
Navigating the Wide World
of Data Visualization Libraries
(on the web)](https://image.slidesharecdn.com/navigatevislibforshare-210205032044/85/Navigating-the-Wide-World-of-Data-Visualization-Libraries-71-320.jpg)


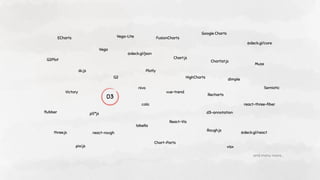
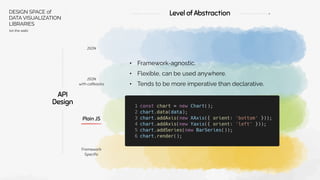
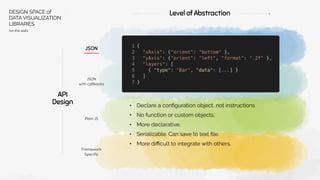
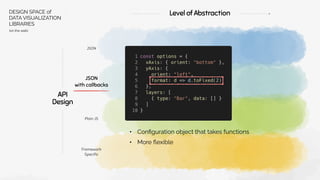
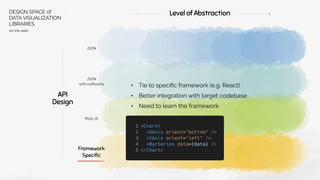
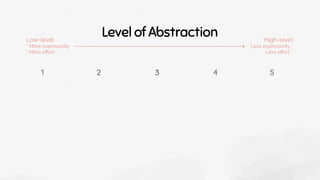
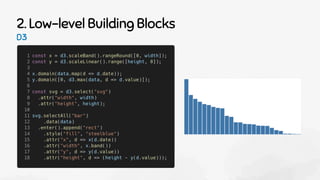
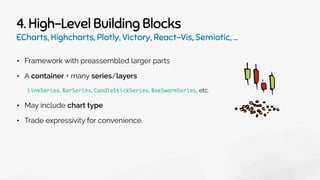
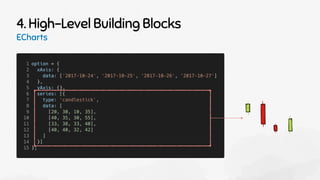
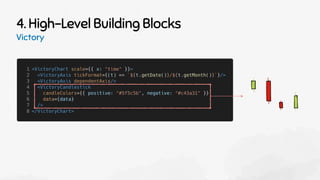
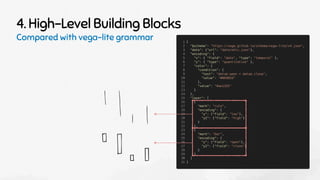
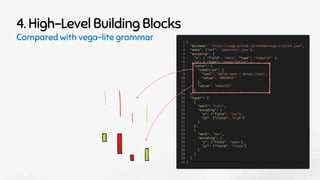
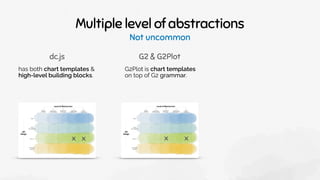
The document discusses the various options and considerations in choosing data visualization libraries for web applications, including highlighting popular libraries like D3, Chart.js, and high-level frameworks like ECharts. It outlines a framework for understanding these libraries based on their API design and level of abstraction, ranging from low-level building blocks to high-level templates. A scorecard and guidelines are provided to help users select the most suitable library for their specific visualization needs.

![[Φυσική Προσανατολισμού Β´ Λυκείου] Καμπυλόγραμμες Κινήσεις](https://cdn.slidesharecdn.com/ss_thumbnails/01-170203100144-thumbnail.jpg?width=640&height=640&fit=bounds)